Analysis

9 Single Candlestick Patterns Every Trader Needs to Know

March 12, 2026

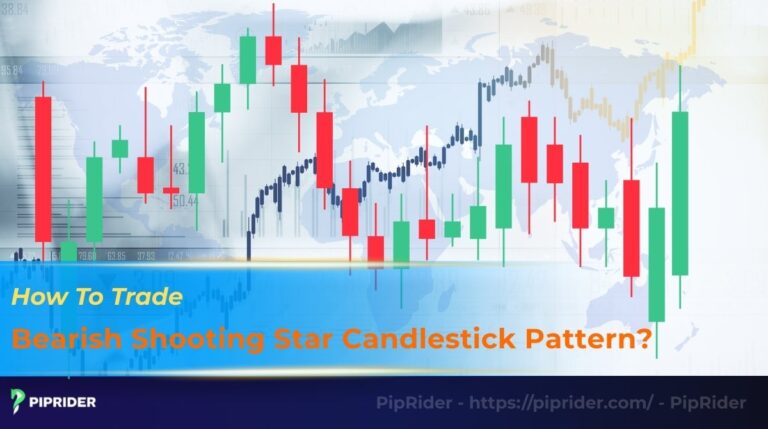
9 Single Candlestick Patterns For Instant Market Insights

Single candlestick patterns are the foundational language of technical analysis. They capture the emotional battle between buyers and sellers within a single trading period, offering clear and immediate insights into market sentiment. Mastering these simple, one-candle formations, such as the Hammer and Doji, is the first step toward reading price action effectively on any candlestick...


Continuation Candlestick Patterns: Definition And Strategies

March 10, 2026

Continuation Candlestick Patterns: Staying In Winning Trades

Continuation candlestick patterns are trend-pause setups that can offer clean entries when the trend context and confirmation are present. Treat them as probabilistic signals, your edge comes from structure, confirmation, and risk control, not the pattern name. This guide delivers the structural and psychological insights required to identify both bullish and bearish continuation setups and...


Mastering The Long Legged Doji: Advanced Technical Analysis

March 12, 2026

Long Legged Doji: Trading Market Indecision Effectively

The Long-Legged Doji (LLD) is a significant single-candlestick formation that identifies high volatility and a temporary balance between buyers and sellers. It is not a guaranteed directional signal, but rather a warning that the current trend’s momentum may be reaching a state of exhaustion. For experienced traders, recognizing this state of market neutrality helps improve...


resistance drawing

February 2, 2026

Resistance Drawing: Identifying High-Probability Sell Zones

Resistance drawing is a fundamental skill in technical analysis, used to identify specific price zones where selling pressure historically halts rallies. However, many traders struggle to distinguish between a minor hurdle and a major market barrier. This guide provides a repeatable framework to plot high-quality resistance levels on any chart. By mastering this process, you...


How To Draw Trend Lines

March 9, 2026

How To Draw Trend Lines: A Scientific Approach To Charts

Trendlines are the most essential tool for technical analysis. They define a market’s direction, identify dynamic support and resistance, and generate reliable trading signals. Learning how to draw trend lines correctly is critical for disciplined analysis. This guide will give you the clear, objective steps needed to draw and apply valid trendlines immediately, helping you...


Gartley Patterns

March 12, 2026

Gartley Patterns: Mastering Harmonic Reversals In Forex

Gartley patterns are the well-known formations in harmonic chart pattern trading, offering a structured, rule-based approach to identifying high-probability market reversals. Its reliance on precise geometric structures makes it a powerful tool for identifying high-probability market reversals. This guide provides a complete playbook on what the pattern is, how to identify it using Fibonacci ratios,...


crab pattern

February 2, 2026

Crab Pattern Strategy: Catching Extreme Market Extensions

Discovered by Scott Carney in 2000, the Crab Pattern is a precise harmonic structure designed to pinpoint extreme market reversals. Unlike basic setups, it utilizes a unique 1.618 Fibonacci extension to identify “stop hunt” zones where trends exhaust. This guide covers the essential validation rules and execution strategies to trade the Crab successfully across stocks,...


Pin bar in trading

February 26, 2026

Pin Bar Trading: The “Rejection Candle” Strategy Guide

The pin bar is a core candlestick pattern in price action trading, visually representing a sudden price rejection. While highly recognizable, its effectiveness is strictly dependent on structural context. Understanding how to validate this signal against broader market conditions can help traders filter out market noise and refine their entry decisions. This guide will provide...


Triple Top

February 26, 2026

Triple Top Pattern: Spotting Major Trend Reversals Early

The Triple Top is a classic major bearish reversal pattern in technical analysis (StockCharts, n.d.). While highly recognizable, its real-world reliability depends heavily on strict confirmation—specifically a decisive neckline close, broader market context, and volume validation. This comprehensive guide will provide a detailed examination of the Triple Top pattern, covering its structure and the disciplined...


Harmonic Patterns

March 9, 2026

Harmonic Patterns in Trading: Complete Guide with Ratios, Cheat Sheet, and Examples

Harmonic patterns represent specific geometric price formations on a chart that adhere to precise Fibonacci retracement and extension ratios. These patterns in Forex trading are not random; they are believed to reflect the cyclical and repetitive nature of market psychology, often signaling potential shifts in supply and demand. Harmonic patterns are advanced Fibonacci-based reversal structures....