Author for Forex Learn Levels 1–3, creating accessible, research-driven modules that simplify forex and personal finance for beginner to intermediate learners.
The Bullish Harami is a foundational candlestick formation that signals a potential end to a bearish trend and the beginning of a bullish recovery. This guide provides a comprehensive breakdown of how to identify this pattern, understand its psychological drivers, and execute high-probability trades by filtering out market noise. Quick Definition Box: The Bullish Harami...
The Dead Cat Bounce pattern is one of the most deceptive traps in a bear market, often tricking traders into believing a crash has ended. This guide provides a comprehensive framework for distinguishing these fake rallies from genuine market bottoms, using volume analysis and technical confirmation to execute high-probability short trades. By understanding the mechanics...
The Falling Wedge pattern is a powerful technical formation that signals a potential bullish breakout. Recognizing this structure allows traders to spot when selling pressure is fading and buyers are ready to take control. This guide provides a complete roadmap to mastering the setup. You will learn how to filter out false signals, confirm the...
In the world of technical analysis, the Ascending Triangle Chart Pattern is widely regarded as one of the most reliable continuation signals in a bull market. This formation occurs when buyers consistently push prices higher, creating higher lows against a static resistance level. This comprehensive guide will equip you with the skills to accurately identify...
The rising wedge pattern is a significant bearish signal that often highlights a subtle shift in market momentum. While price continues to make higher highs and higher lows, the narrowing range suggests that prevailing buying interest is gradually diminishing (Thompson, 2025). Identifying this formation allows traders to recognize potential exhaustion in an uptrend or a...
The hammer candlestick pattern is a widely recognized reversal signal in price action trading, often marking the exhaustion of selling pressure. When it appears at key support levels or at the conclusion of a sustained downtrend, the hammer helps traders identify potential market bottoms where risk is historically lower and the probability of a trend...
The Head and Shoulders pattern is one of the more respected classical reversal patterns in technical analysis. While no setup is guaranteed, mastering this formation helps you identify potential trend exhaustion, allowing you to exit winning trades before a crash and enter new positions with calculated risk. This guide teaches you to identify valid structures,...
The Symmetrical Triangle Pattern acts like a coiling spring in the market. While it is one of the most powerful continuation patterns, many traders lose money by guessing the breakout direction too early. Understanding the correct structure, volume dynamics, and breakout confirmation rules is the key to trading this “neutral” formation safely and effectively as...
The On Neck Pattern is a bearish continuation signal often confused with reversal patterns like the Thrusting or Piercing line candlestick pattern. Understanding the on neck pattern helps traders avoid false buy signals and time their sell orders correctly during a downtrend. This guide explains how to identify the structure, interpret the psychology, and trade...
1. Introduction: The Year That Defied Expectations Entering 2025, the financial consensus was dominated by fears of an inevitable recession, yet the market reality proved significantly more resilient. The defining narrative of the year became the successful execution of a “Soft Landing,” where major economies managed to curb inflation without triggering a deep contraction. This...
The Golden Cross Pattern is a popular and widely used long-term trend confirmation signal utilized by traders across stock, forex, and crypto markets to identify potential uptrends. Learning how to trade the golden cross involves spotting when short-term momentum rises above the long-term average. This guide explains how to identify these signals and manage the...
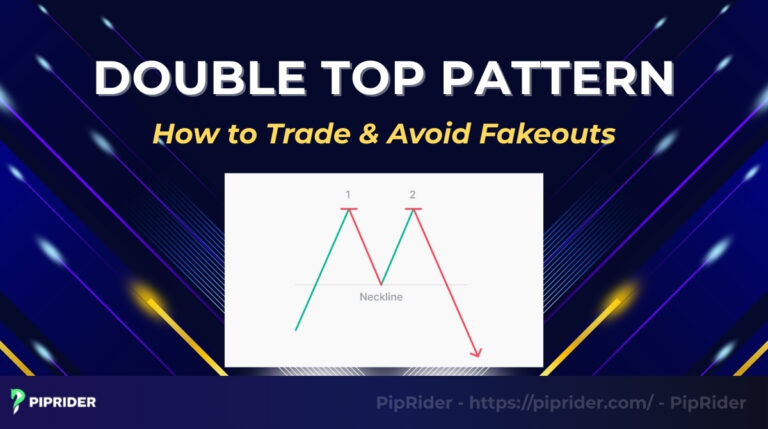
The double top pattern is a powerful bearish reversal signal that forms when the market fails twice to break a high. Understanding how to trade double top patterns is critical for spotting market tops, avoiding bull traps, and finding high-probability short entries. This guide explains the structure, confirmation rules, and strategies to trade this pattern...
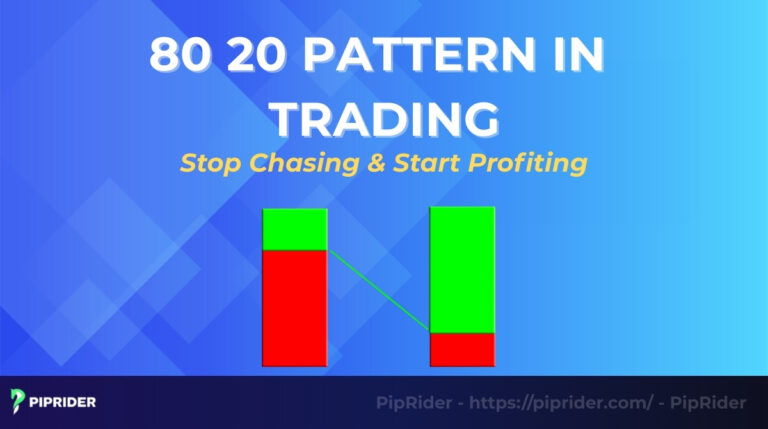
The 80/20 pattern is a powerful price action rule based on the Pareto principle. It states that 80% of breakouts from a trading range will fail, creating high-probability reversal opportunities for traders. However, the 80-20 pattern is not a standalone signal. While excellent for capturing reversals after strong moves, it works best when combined with...
The megaphone pattern is a rare but powerful chart formation that warns traders of extreme market volatility and changing market dynamics. Understanding this “Broadening Formation” is the key to catching major breakouts while avoiding chaotic price swings. This guide explains exactly how to identify the pattern, the market psychology behind it, and the step-by-step strategies...
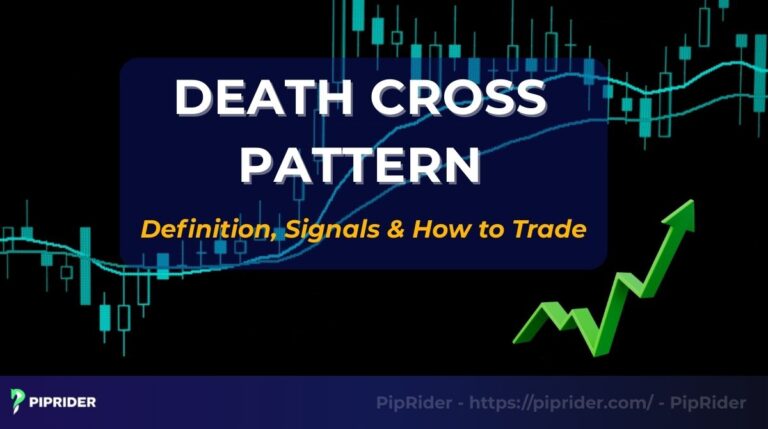
The death cross pattern is a famous bearish signal that traders and investors watch closely in the stock market. It occurs when a short-term moving average (like the 50-day) crosses below a long-term moving average (like the 200-day). This cross signals a potential major shift from a bull market to a bear market. This guide...
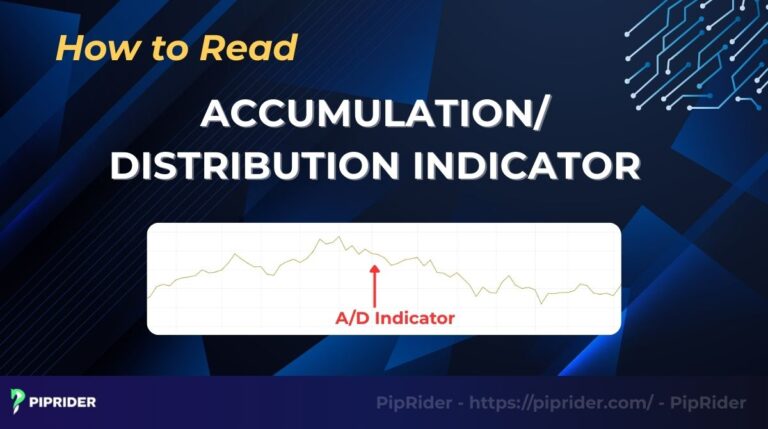
The Accumulation/Distribution (A/D) Indicator is a powerful tool that helps traders see if “Smart Money” is flowing into or out of a market. This flow is a critical signal for measuring a trend’s true strength. This guide explains how to read accumulation/distribution indicator effectively by focusing on its two most powerful signals: trend confirmation and...
Learning how to identify trend in stock market is the most critical skill for a trader. It stops you from buying against the market’s momentum. The easiest way is to use Price Action (looking for “Higher Highs and Higher Lows”) and then confirm the trend with tools like Trendlines and Moving Averages. This guide provides...
Learning how to find key levels in trading is the single most important skill for precise execution. These levels are the “map” of the market, showing you exactly where price is likely to react based on past order flow. This guide provides a full methodology for finding key levels, starting with basic price action and...