
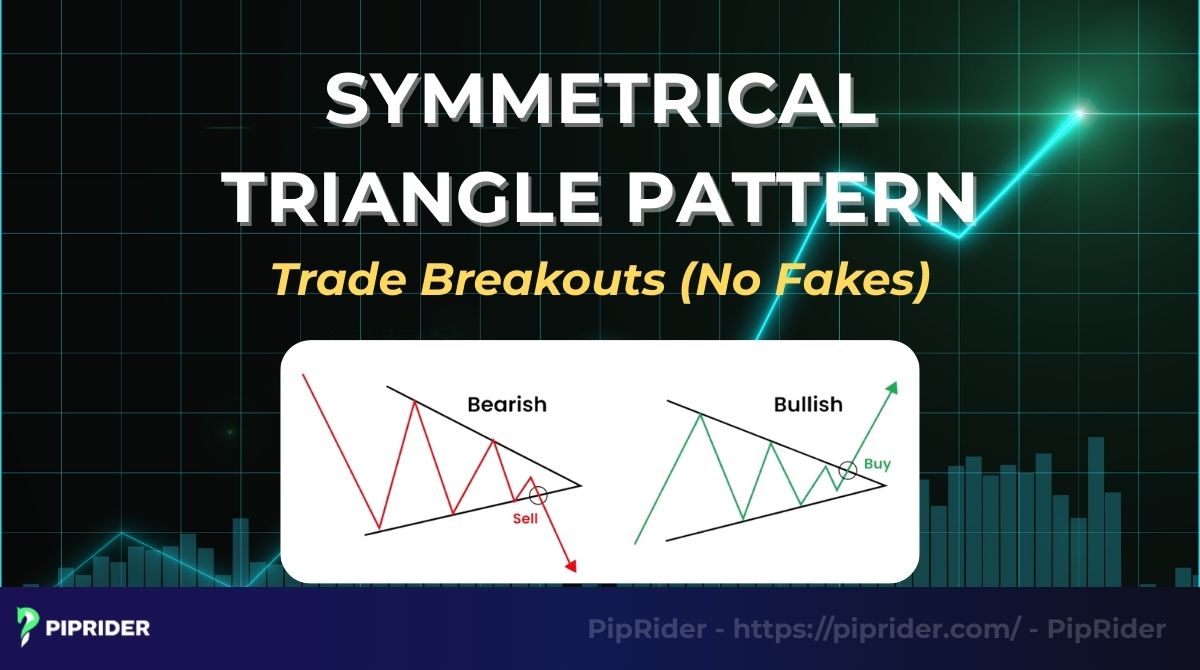
The Symmetrical Triangle Pattern acts like a coiling spring in the market. While it is one of the most powerful continuation patterns, many traders lose money by guessing the breakout direction too early. Understanding the correct structure, volume dynamics, and breakout confirmation rules is the key to trading this “neutral” formation safely and effectively as part of a robust trading strategy.
Key Takeaways
- A Symmetrical Triangle Pattern is a chart formation that signals a likely continuation of the existing trend (uptrend or downtrend).
- It is formed by two converging trendlines connecting a series of lower highs and higher lows.
- The pattern is confirmed only when the price breaks out of the trendline with a significant increase in volume.
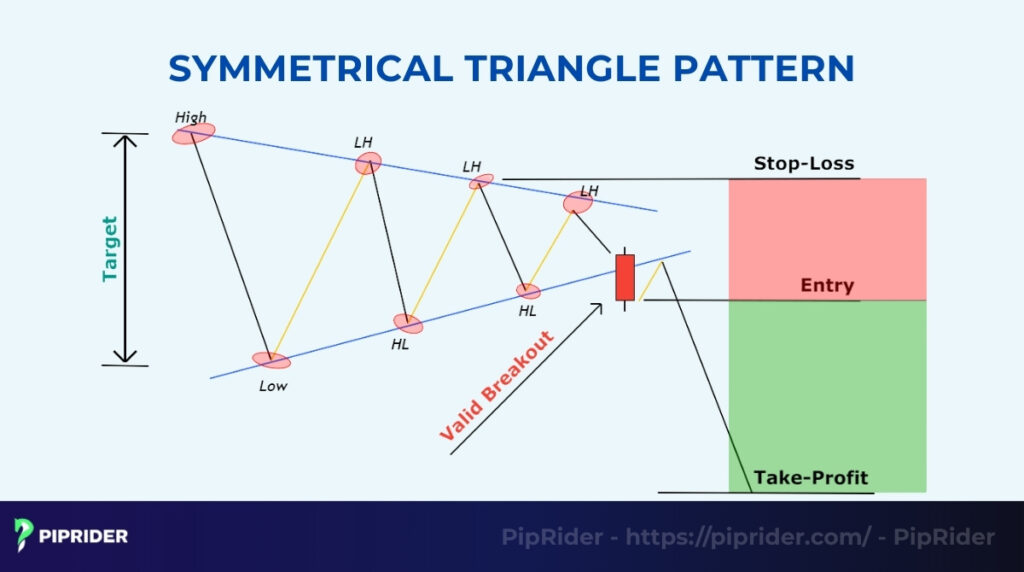
- Traders calculate the profit target using a Measured Move, which is the vertical height of the triangle projected from the breakout point.
- Because false breakouts are common, you must use confluence tools like RSI, MACD, and market structure to validate the signal.
1. What Is a Symmetrical Triangle Pattern?
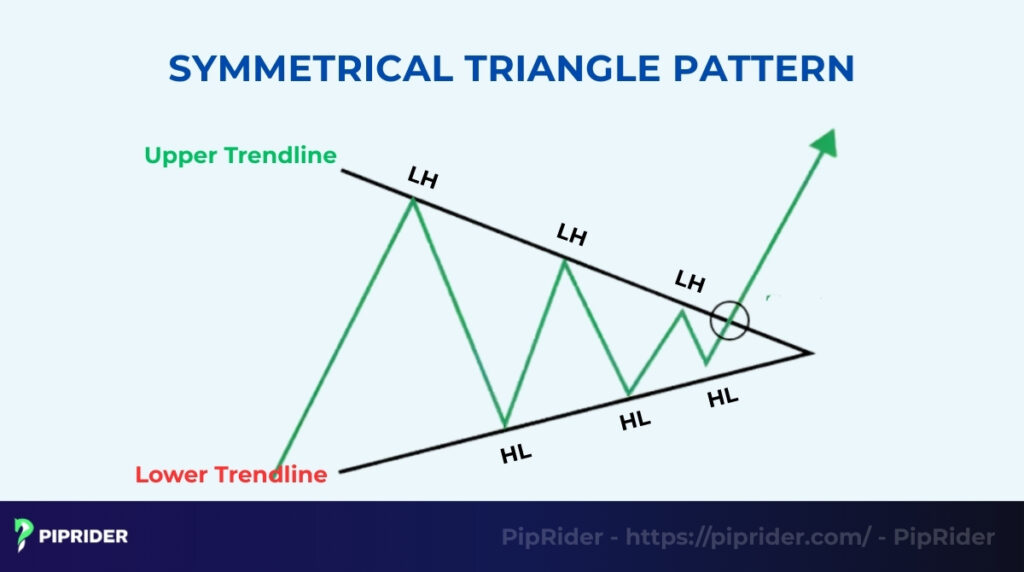
The Symmetrical Triangle Pattern (often called a “coil”) is a chart formation used in technical analysis that represents a period of consolidation, acting as a market pause in the prevailing trend. It is created by two converging trend lines that squeeze the price into a distinct triangle shape:
- Upper Trendline: Connects a series of Lower Highs.
- Lower Trendline: Connects a series of Higher Lows (or troughs).
Quick Definition: Symmetrical Triangle
- Structure: Converging trendlines with at least two lower highs and two higher lows.
- Nature: Geometrically neutral, but functions as a continuation pattern based on context.
- Bias: Highly dependent on the prior trend (the move leading into the triangle).
- Golden Rule: Enter only after a confirmed candle close outside the pattern.
Unlike Ascending or Descending triangles which have a flat side, the Symmetrical Triangle is geometrically neutral because both lines slope toward the center (Thompson, 2025). This indicates a temporary stalemate between buyers and sellers.
However, in technical analysis, it is widely regarded as a continuation candlestick pattern. This means if the prior trend was up, the probability favors a bullish breakout towards a higher price target.
Because it reflects universal market psychology (indecision before a big move), this pattern works across all liquid markets.
- Stocks: Often appears as a “pause” in a long-term trend, lasting weeks or months.
- Crypto: A common structure during accumulation phases before volatile moves in Bitcoin or Ethereum.
2. How Does the Symmetrical Triangle Form?
The pattern is formed by a specific psychological battle. It is not just random lines; it shows that buyers and sellers are equally aggressive, pushing the price movement into a tighter and tighter corner.
2.1. Lower Highs: Sellers Step In
The upper trendline slopes downward because sellers are becoming impatient. They are not waiting for the price to reach the previous peak to sell. Instead, they are willing to sell at lower and lower prices to get out of their positions, creating a series of lower highs.
2.2. Higher Lows: Buyers Defend Price
The lower trendline slopes upward because buyers are also becoming impatient. They are not waiting for the price to drop to the previous bottom. They step in early to “buy the dip” at higher and higher prices, creating a series of higher lows.
2.3. Compression Phase: Market is Coiling
As the highs drop and the lows rise, the trading range gets squeezed. This is the compression phase. During this time, volatility drops, and trading volume usually decreases. Think of this as a spring being wound up tight; the energy is building for a massive release.
2.4. Apex & Breakout Point
The Apex is the point where the two trendlines eventually cross.
- The Rule: Established by foundational market technicians Edwards and Magee, a valid breakout statistically happens when the price is about 2/3 to 3/4 of the way to the Apex.
- Warning: If the price trades all the way to the Apex without breaking out, the pattern often loses its power and simply drifts sideways.
3. What Is the Market Psychology Behind the Pattern?
Why does this pattern lead to such explosive price movement? The answer lies in market sentiment, the psychology of fear, greed, and trapped traders.
3.1. Trader Indecision & Volatility Contraction
The shrinking range reflects growing uncertainty. Neither the bulls nor the bears are confident enough to push the price to a new level. As a result, volatility contracts. This silence is deceptive; it is the calm before the storm.
3.2. Energy Build-Up
As the price coils tighter, pressure builds. Traders on the sidelines are watching and waiting. They are placing entry orders (buy stops above the highs, sell stops below the lows) just outside the triangle. This accumulation of pending orders creates a “powder keg” of potential energy.
3.3. The Breakout (Fueled by Trapped Traders)
The breakout marks the violent release of all that stored energy. When the price finally breaches one of the trendlines, the stalemate ends abruptly, triggering a chain reaction of orders that drives the market fast in one direction.
- Momentum: Pending entry orders sitting just outside the triangle are triggered instantly.
- Trapped traders: Traders who were betting on the wrong direction inside the triangle are panic-selling to close their positions. Their exit orders add even more fuel to the breakout, causing the price to surge.
Psychological Key Stages
- Indecision: Buyers and sellers are in a temporary equilibrium, creating lower highs and higher lows.
- Order Build-up: Liquidity (Stop-losses and Breakout orders) accumulates heavily just outside the converging lines.
- Trapped Traders: Early entrants who “front-run” the move are forced to exit as the breakout goes against them.
- Explosive Release: The combination of new orders and forced liquidations creates a surge in momentum.
4. How to Identify a Valid Symmetrical Triangle
Drawing lines on trading charts is simple, but identifying a tradeable pattern requires strict adherence to technical rules. To avoid “fakeouts” and distinguish valid setups from random market noise, a Symmetrical Triangle pattern must meet these four specific criteria.
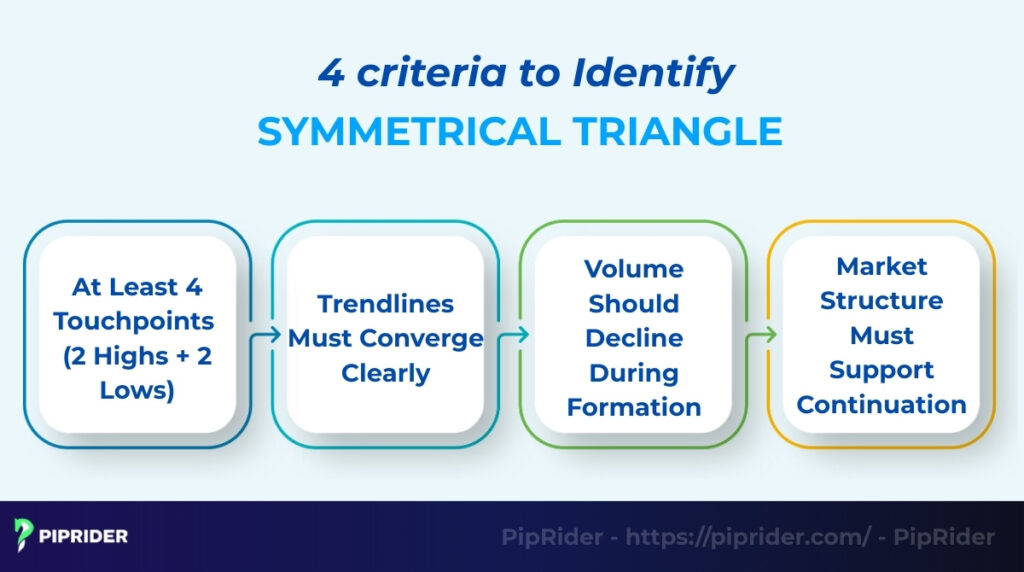
4.1. At Least 4 Touchpoints (2 Highs + 2 Lows)
A single point cannot define a trend. To create a valid triangle, the price must touch the trend lines at least four times. A minimum of two distinct lower highs is required to draw the upper line, and two distinct higher lows are needed for the lower line. The pattern becomes stronger each time the price tests these boundaries without breaking them.
4.2. Trendlines Must Converge Clearly
Visually, the formation must be distinct. The upper trendline should slope downward, while the lower trendline slopes upward, pointing towards a single intersection point on the right side of the chart called the Apex. If the lines are parallel, the formation is classified as a Channel, not a triangle.
4.3. Volume Should Decline During Formation
This is the primary filter for quality. As the price range tightens, trading volume should visibly decrease. This drop in volume confirms the “calm before the storm” psychology, indicating that traders are waiting for a resolution. If volume is rising or erratic inside the pattern, the market structure is likely unstable, making the breakout unreliable.
4.4. Market Structure Must Support Continuation
Context is critical for determining the likely direction. Since the Symmetrical Triangle is primarily a continuation pattern, the trend before the triangle formed dictates the bias.
- If the prior trend was bullish, analysis should favor an upward breakout.
- If the prior trend was bearish, analysis should favor a downward breakdown.
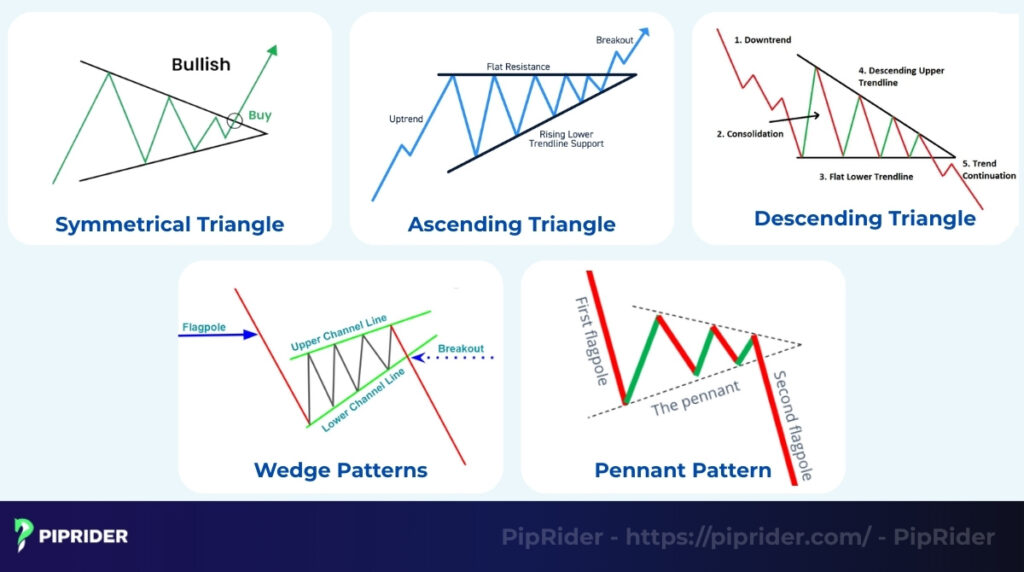
5. Symmetrical Triangle vs. The “Big Four” Rivals
Traders rarely fail because they don’t know the patterns; they fail because they misidentify them in the heat of the moment. Use this Decision Support Matrix to distinguish between these formations and understand which one fits your current experience level.
5.1. The Pattern Comparison Matrix
| Pattern | Market Bias | Beginner Friendly? | The “Identification Trap” (Common Mistake) |
| Symmetrical Triangle | Neutral / Continuation | Medium | Anticipating the direction: Entering early based on a “gut feeling” before the breakout actually occurs. |
| Ascending Triangle | Bullish | High | Jagged Highs: Mistaking a series of random, uneven highs for a solid, flat horizontal resistance line. |
| Descending Triangle | Bearish | High | Jumping the Gun: Selling at the support line before the “floor” has actually been breached. |
| Rising Wedge / Falling Wedge | Reversal / Continuation | Medium | Ignoring the Slope: Mistaking a Wedge (both lines slope the same way) for a Triangle (lines converge from opposite directions). |
| Pennant | Continuation (Short-term) | Medium | Missing the Flagpole: Trading the small triangle structure without a sharp, vertical preceding price move (the pole). |
5.2. Which Pattern Should You Trade First?
If you are a Beginner, the Ascending and Descending Triangles are your best entry points into pattern trading.
Why? Because they feature a “Flat Wall” (horizontal support or resistance). This provides a crystal-clear, objective price level to watch. The Symmetrical Triangle is more advanced because it is geometrically neutral; it requires the patience to wait for the market to reveal its hand, a skill that takes time to develop.
5.3. The “Slope Trap”: Triangle vs. Wedge
This is the most frequent error that leads to “trading the wrong way.”
- The Rule: In a Symmetrical Triangle, the trendlines must move in opposite directions (one sloping down, one sloping up).
- The Trap: If both trendlines are pointing upward (even if they are converging), you are looking at a Rising Wedge, not a triangle. A Rising Wedge is typically a bearish reversal signal, whereas a Symmetrical Triangle in an uptrend is bullish. Misidentifying this can lead to buying right before a massive reversal.
6. What Are the Types of Symmetrical Triangle Breakouts?
Since the Symmetrical Triangle is a neutral “coiling” pattern, traders must be prepared for three distinct outcomes. Recognizing which breakout type is unfolding allows traders to react quickly and correctly.
6.1. Bullish Continuation Breakout
Occurring typically within an existing uptrend, this breakout signals that the bulls have won the stalemate. Price breaks decisively above the upper trendline. To be considered valid, this move generally requires a significant spike in buy volume to confirm that the pause is over and the trend is resuming.
6.2. Bearish Continuation Breakout
In a larger downtrend, sellers often regain control after a brief consolidation. The signal occurs when price breaks below the lower trendline. While bearish breakdowns can sometimes happen on lighter volume (as price movement falls under its own weight), a surge in selling pressure makes the signal much more reliable and tradeable.
6.3. False Breakout (The Fakeout)
Traders must also be wary of false breakouts (or fakeouts), a trap set by the market to capture liquidity. In this scenario, price pierces one of the trendlines (e.g., breaks the top) but fails to close outside the pattern.
Instead, it leaves a long wick and immediately reverses back inside the triangle. Traders who bought the breakout too early are now trapped, often fueling a reversal in the opposite direction.
7. How to Trade the Symmetrical Triangle: The Execution Playbook
Identifying the triangle is only 20% of the work; the remaining 80% is professional execution. Instead of guessing, use this structured playbook to align your entries, stops, and targets with specific market conditions.
7.1. Strategy 1: The Breakout Entry (The Momentum Play)
This strategy captures the immediate surge of energy when the “coiling spring” finally snaps. It is the most effective approach for capturing fast-moving trends during high-volatility sessions or news-driven events.
- Best for: Momentum traders and aggressive intraday participants.
- Use when: The breakout candle is explosive (large body, small wicks), accompanied by a clear volume spike and a fundamental catalyst.
- Entry Trigger: Candle close decisively outside the trendline + No immediate rejection (the candle should close near its high for bullish or its low for bearish).
- Stop-Loss (SL):
- Aggressive: 2-3 pips below the breakout candle’s midpoint.
- Standard: Just below the breakout candle’s low.
- Take-Profit (TP): Full Measured Move (1:1 height of the triangle) or 2.5x ATR.
- Avoid When: The breakout occurs past the 80% mark of the triangle (near the Apex), as these moves often lack momentum and result in “washouts.”
7.2. Strategy 2: The Retest Entry (The Conservative Play)
This approach focuses on “Role Reversal,” waiting for the market to prove that the broken trendline has officially flipped its function. It prioritizes validation over speed to ensure you aren’t buying a temporary spike.
- Best for: Swing traders and conservative professionals prioritizing capital preservation.
- Use when: The initial breakout is moderate, and you want to avoid “buying the top.”
- Entry Trigger: Price returns to touch the broken trendline + A rejection candle forms (e.g., Pin Bar or Bullish Engulfing) on a lower timeframe.
- Stop-Loss (SL): Placed strictly below the recent swing low formed during the retest.
- Take-Profit (TP): Measured Move or the Prior Expansion Leg (the major swing high/low that initiated the pattern).
- Avoid When: The breakout was a high-volatility “Godzilla” candle. These moves rarely return for a retest; waiting here often means missing the entire wave.
7.3. Strategy 3: The Higher-Timeframe Filter (The Pro Play)
To eliminate market noise, professional traders use the higher timeframe (HTF) as their compass. This top-down analysis ensures your lower-timeframe trade is aligned with the “big money” flow.
- Best for: Traders looking to eliminate counter-trend traps and increase win rates.
- Use when: The triangle appears on a lower timeframe (M15/H1), but the D1 or H4 trend is undeniably strong.
- Entry Trigger: Only take breakouts that align with the HTF Bias.
- Example: If the Daily Trend is Bullish, ignore all downside breakdowns on the H1 triangle. Only trade the upside breakouts.
- Stop-Loss (SL): Follow the rules of Strategy 1 or 2 based on the local structure.
- Avoid When: The Higher Timeframe itself is in a flat, choppy range.
7.4. Risk Management: Stop-Loss and Take-Profit Logic
Precision in exiting is what separates professional traders from gamblers. Use these specific rules to protect your capital and standardize your results.
- Aggressive Setup SL: Strictly below/above the breakout candle’s extremes.
- Retest Setup SL: Below/above the retest swing point (outside the triangle).
- Volatility-Based TP (The ATR Method): If the triangle structure is non-textbook or “messy,” set your TP at 2x to 3x the ATR. This adapts your exit to the market’s current “speed limit” rather than a theoretical drawing.
7.5. The Partial Profit Rule: Scaling for Longevity
Never let a winning trade turn into a loser. Scaling out allows you to secure gains while keeping “runners” active for extended moves.
- First Target (1:1 R/R or Structure): Close 50% of your position at a 1:1 Risk-to-Reward ratio or when the price hits the first major historical support/resistance zone.
- Second Target (The Runner): Move your stop-loss to Break-Even and let the remaining 50% run to the full Measured Move or ATR target.
7.6. Context Overrides Geometry: The “Early Wall” Warning
Market structure always beats a chart drawing. If a major supply/demand zone sits right before your Measured Move target, do not wait for your “perfect” line to be touched.
- The Action: If the price hits a heavy structural level (like Daily resistance) just before your TP, close the trade or trail your stop-loss aggressively tight. Large algorithms and banks exit at these “walls,” often causing reversals before your target is hit.
7.7. The Failure Signal: Good Retest vs. Structural Weakness
Distinguishing a healthy pullback from a total failure is the most nuanced skill in pattern trading.
- The Confirmation (Good Retest): Price touches the broken line and bounces away quickly with a rejection wick, proving the role reversal.
- The Red Flag (Weakness): If the price returns and closes deep inside the triangle’s original range, the breakout has likely failed.
- The “Instant Exit” Rule: If a retest candle closes back inside the triangle, exit immediately. Do not wait for your stop-loss to be hit. Capital preservation is more important than being “right.”
8. The Anti-Fakeout Checklist: Your Professional Filter
Trading a Symmetrical Triangle breakout without a filter is a recipe for “death by a thousand stops.” Most retail traders fail because they react to price movement emotionally rather than systematically. By using a checklist, you remove “gut feelings” from the equation and force yourself to wait for institutional confirmation.
8.1. The “No Fakes” Verification List
Before you click “Buy” or “Sell,” run every potential setup through this 6-point Anti-Fakeout Checklist. If even one box remains unchecked, the high-probability move is to stay on the sidelines.
- Did the Breakout Candle Close Outside? Never enter while the candle is still moving. A “piercing” wick that fails to close outside the trendline is the #1 sign of a trap designed to capture liquidity.
- Is Volume Clearly Above Average? A valid breakout requires an injection of institutional money. Look for a volume spike that is at least 150% of the 20-period average. Breakouts on low or declining volume are almost always fakeouts.
- Is the Timing Right (The 75% Rule)? Does the breakout happen between 2/3 and 3/4 of the way to the Apex? If price drifts all the way into the final corner of the triangle, the pattern has “decayed,” and any move out is usually just random, low-energy noise.
- Does the Prior Trend Support the Move? Statistics show that continuation breakouts have a much higher success rate. An upside breakout in a dominant daily uptrend is a “A+ setup”; an upside breakout in a downtrend is a “C- setup.”
- Is There No Momentum Divergence? Check your RSI or MACD. If the price is breaking out to a new high but the RSI is making a lower high (Bearish Divergence), the move lacks the internal strength to sustain the rally.
- Is the Breakout Candle “Clean”? A high-quality breakout should be a “Power Candle” (large body, tiny wicks). If the candle closes outside but has a long wick pointing back toward the triangle, it indicates heavy Price Rejection.
8.2. The “3-Candle” Rule for Maximum Safety
If you are a conservative trader who wants to virtually eliminate “single-candle” traps, apply the 3-Candle Confirmation before entering:
- Candle 1 (The Breakout): Must close decisively outside the trendline.
- Candle 2 (The Follow-through): Must close beyond the high (for longs) or low (for shorts) of Candle 1. This proves that buyers/sellers are maintaining control.
- Candle 3 (The Acceleration): This is your entry candle.
While this rule might cause you to miss the very beginning of an explosive “Godzilla” move, it will save your account from hundreds of “wick-and-reverse” fakeouts over the long run.
9. Which Indicators Confirm a Symmetrical Triangle Breakout?
While price action is your primary signal, indicators act as your secondary “defense” against market noise. They provide the mathematical proof that a move has enough institutional “fuel” to sustain itself. Instead of cluttering your chart with dozens of lagging tools, professional traders focus on a specific Confirmation Matrix to filter out low-probability setups.
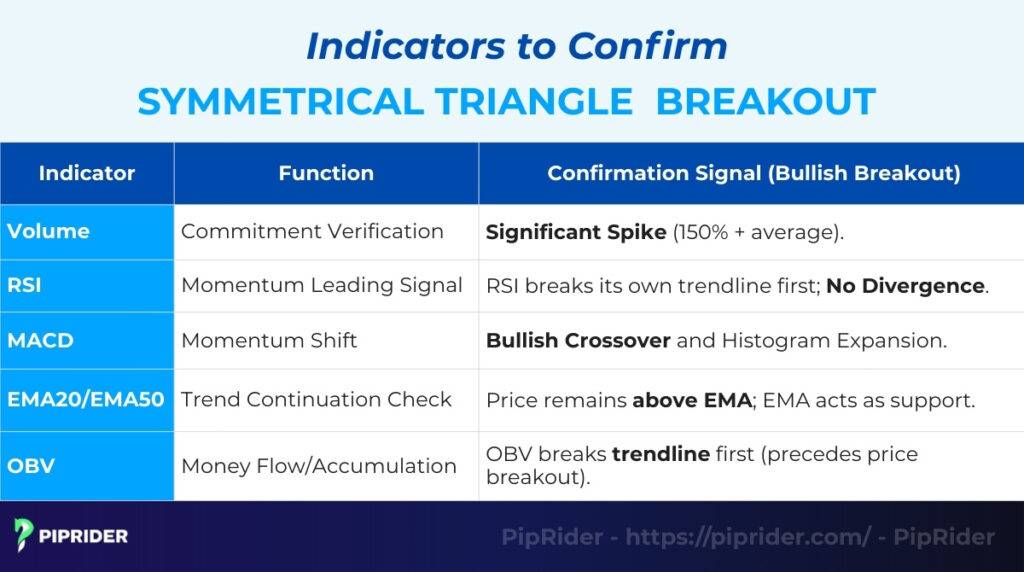
9.1. The Indicator Confirmation Matrix
Before committing capital to a breakout, use this matrix to verify if the technical “stars” are aligned. This systematic approach ensures you only trade when momentum, participation, and volatility are in your favor.
| Indicator | What it Confirms | What to Avoid |
|---|---|---|
| Volume | Real Participation: A breakout must be “funded” by large players. Look for a clear spike (150%+ above average). | Low-volume breakouts: If the price moves but volume stays flat, it’s likely a retail trap or a simple stop-run. |
| RSI (14) | Momentum Alignment: The RSI should break its own trendline or cross the 50 level in the direction of the price move. | Divergence: If price breaks higher but RSI makes a lower high, the move lacks the internal strength to continue. |
| MACD | Momentum Continuation: A bullish/bearish crossover that occurs in sync with the breakout candle. | Late/Lagging Crosses: Entering on a cross that happens too long after the price has already hit the first target. |
| ATR (14) | Target & Volatility Sizing: Helps you set realistic Stop-loss and Take-Profit levels based on the market’s “speed.” | Unrealistic Targets: Attempting a full “Measured Move” exit when the ATR is at multi-month lows (low energy). |
9.2. The “Dual-Confirmation” Rule
For an A+ Setup, Piprider recommends seeking at least two of these confirmations before pulling the trigger.
- The Gold Standard: Price Breakout + Volume Spike + RSI Momentum Alignment.
- The Caution Signal: If price breaks out but RSI shows divergence and Volume is declining, the probability of a “Fakeout” is over 80%. In this scenario, the only professional move is to wait for a successful Strategy 2 (Retest Entry) or stay on the sidelines.
10. Symmetrical Triangle Case Studies: From Theory to Execution
To master this pattern, you must see how it breathes in live markets. These three case studies demonstrate how to apply our entry and exit rules across Forex, Crypto, and Stocks based on historical market events.
10.1. Case Study 1: GBP/USD Intraday Breakout (The News Catalyst)
The pair entered a multi-hour “coil” on the 1-Hour chart immediately preceding a major Central Bank interest rate decision.
- Setup: A textbook symmetrical structure with 5 clear touchpoints and declining volume during the compression phase.
- Trigger: A massive bullish breakout candle closing above the upper trendline as the news was released.
- The Trade:
- Entry: Strategy 1 (Aggressive) — Buy at the close of the H1 breakout candle.
- Stop-Loss: Placed 5 pips below the breakout candle’s low.
- Target: The Measured Move (100% of the triangle’s base height).
- Key Lesson: A news-driven breakout is only worth trading if the technical structure was clean before the catalyst. The news simply provided the “fuel” for the existing technical setup.
10.2. Case Study 2: Bitcoin (BTC) Daily Accumulation (The Volume Filter)
Following a major crash (e.g., May 2021), Bitcoin entered a multi-month consolidation phase on the Daily chart.
- Setup: Volume dropped to multi-month lows as the price squeezed toward the Apex, signaling extreme indecision.
- Trigger: A daily close above the upper trendline accompanied by a massive spike in buy volume (150%+ above average).
- The Trade:
- Entry: Strategy 2 (Conservative) — Wait for a 4-hour retest of the broken trendline.
- Stop-Loss: Placed below the retest swing low (outside the pattern).
- Target: Measured Move + the next major Weekly resistance level.
- Key Lesson: In the Crypto market, volume is the ultimate lie detector. A breakout without a massive relative volume spike is likely a bull trap.
10.3. Case Study 3: Tesla (TSLA) Earnings Gap (The Context Play)
After a dominant 30% rally, TSLA paused to form a Symmetrical Triangle on the 4-Hour chart before its quarterly earnings report.
- Setup: Price stayed within the upper 2/3 of the triangle, showing bullish resilience and accumulation.
- Trigger: Positive earnings caused the price to “gap up” completely over the upper trendline at the market open.
- The Trade:
- Entry: Strategy 3 (HTF Filter) — Since the Daily trend was strongly bullish, the gap was treated as a continuation. Entry was taken on the first 15-minute bullish rejection wick.
- Stop-Loss: Below the gap’s opening price.
- Target: 3x ATR (adapting to the gap’s increased volatility).
- Key Lesson: Not every gap is a “chase.” Only trade gaps that occur in the direction of the dominant Higher Timeframe trend. Context always overrides geometry.
11. Which Tools Can Help You Spot Symmetrical Triangles?
Finding a symmetrical triangle across dozens of currency pairs or hundreds of stocks manually is exhausting. To trade at a professional level, you need a tech stack that handles the “heavy lifting” of scanning, allowing you to focus entirely on the Anti-Fakeout Checklist and execution.
11.1. For Manual Charting: TradingView
TradingView is the gold standard for pattern traders because of its geometric precision and cloud-based alert system. If you prefer drawing your own lines, these features are non-negotiable:
- Magnet Mode: This ensures your trendlines “snap” exactly to the highs and lows of the candle wicks. Accuracy is vital for defining the exact “Apex” and breakout points.
- Multi-Interval Alerts: Instead of staring at the screen, set price alerts slightly outside the trendlines. This prevents “Chart Fatigue” by notifying you only when the market is ready to move.
- Drawing Sync: If you identify a triangle on the 4-hour chart, TradingView automatically syncs those lines to your 15-minute chart, making Strategy 3 (HTF Filter) seamless to execute.
11.2. For Automated Scanning: TrendSpider and Finviz
If you are a swing trader or have a full-time job, you cannot scan 50 tickers every hour. Automated pattern recognition tools act as your “Digital Assistant.”
- TrendSpider: Features a specialized “Market Scanner” that uses AI to detect converging trendlines. It can scan thousands of stocks or crypto pairs and notify you the moment a triangle is forming.
- Finviz (Stock Screener): For stock traders, Finviz offers a high-speed “Pattern” filter. Simply select “Triangle (Symmetrical)” to generate a curated list of active setups in seconds.
- Pattern Detection Indicators: For MetaTrader users, look for dashboard indicators that scan all pairs simultaneously for price compression signals.
11.3. The Beginner’s Rule: Eye First, Algorithm Second
While tools are powerful multipliers, they should never replace your own analysis. Algorithms often “hallucinate” patterns in choppy markets or ignore the fundamental context.
Piprider Pro Tip: Use scanners to build your “Daily Watchlist,” but perform the final manual verification yourself. A tool can find a geometric shape, but only a human trader can use the Anti-Fakeout Checklist to judge if that shape is worth risking capital on.
12. Success Factors & The “Retail Traps”
Identifying a symmetrical triangle is the first step; judging its “health” is what determines your profitability. To maximize your win rate, you must distinguish between a “High-Energy” setup and a “Decaying” structure.
12.1. High-Probability Setup: When It Works Best
The Symmetrical Triangle is at its most potent when it acts as a “pressure cooker,” building up massive energy. A high-quality setup typically meets these criteria:
- Strong Prior Trend: The pattern is significantly more reliable when it functions as a continuation signal within a clear, established trend (Bullish or Bearish).
- Volume Contraction: You should see volume “drying up” as the price moves toward the apex.
- The “75% Rule” Timing: First introduced in the classic text Technical Analysis of Stock Trends, the most explosive and reliable breakouts occur when the price breaks out between 66% and 75% of the way to the apex.
- HTF Alignment: The setup works best when the lower-timeframe breakout is supported by the Higher Timeframe bias.
- Institutional Confirmation: The breakout is triggered by a high-momentum “Power Candle” accompanied by a clear volume spike (at least 150% of the average).
12.2. The “Retail Traps”: 6 Reasons You Keep Losing
Even with a solid strategy, traders often lose money by forcing trades or ignoring strict rules. Avoid these six common traps that cause Symmetrical Triangles to fail:
- Trading the “Late-Apex Drift”: If the price travels more than 80% to 100% of the way to the apex without breaking out, the pattern has decayed. Trading a breakout this late usually results in choppy, directionless price action.
- Predicting the Breakout Direction Too Early: Traders often try to be heroes and enter a trade based on a “gut feeling” before the actual breakout happens. “Front-running” leaves you completely exposed to “wick-and-reverse” traps.
- Ignoring Volume on Breakout: If the price breaks out but volume remains flat or decreases, it is just a “liquidity grab” by larger players. The move lacks institutional backing and is likely to reverse.
- Entering Before the Candle Close: Impatience is a portfolio killer. If you buy the moment price spikes above the trendline and the candle fades leaving a long wick, you are trapped. Always wait for the candle close.
- Trading Insufficient Touchpoints: A common error is trading a “triangle” that only has 3 touches. Always wait for at least 4 clear touchpoints (2 highs and 2 lows) to confirm the structure.
- Confusing Patterns or Trading “Ugly” Structures: It is easy to mistake this pattern for a wedge or pennant. Furthermore, if the trend lines are too steep or the triangle is too wide, the breakout becomes unpredictable. Only trade tight, clear coils.
13. Frequently asked questions about symmetrical triangle pattern
Traders often ask about the pattern’s directional bias, its reliability compared to other charts, and the best timeframes to trade it. Here are the answers to the most common questions.
14. Conclusion
The Symmetrical Triangle pattern stands as one of the most potent continuation patterns in technical analysis. Its success rate peaks when specific conditions align: a clear prior trend, a decisive volume spike upon breakout, and a successful retest of the broken trendline.
Reliability is further enhanced by combining the pattern with Price Action signals and confirming indicators, rather than trading the formation in isolation. To fully understand the dynamics of the breakout, it is essential to practice and backtest different scenarios.
Ready to master more trading patterns? Explore the comprehensive trading guides and strategies at Piprider today.


