
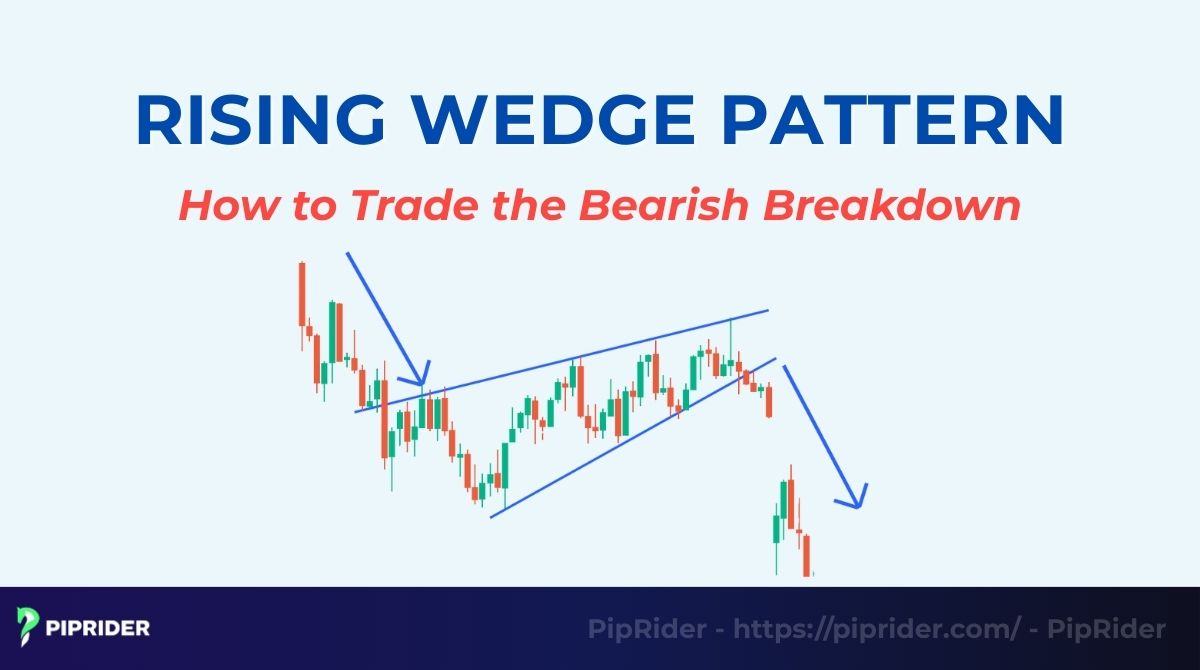
The rising wedge pattern is a significant bearish signal that often highlights a subtle shift in market momentum. While price continues to make higher highs and higher lows, the narrowing range suggests that prevailing buying interest is gradually diminishing (Thompson, 2025). Identifying this formation allows traders to recognize potential exhaustion in an uptrend or a temporary pause in a downtrend before the market resumes a downward trajectory.
In this guide, we will analyze the technical characteristics of the rising wedge, explore the psychological drivers behind the price action, and outline risk-managed strategies to identify valid breakdown points.
Key Takeaways
- Bearish Bias: A rising wedge is fundamentally a bearish formation, regardless of whether it appears in an uptrend or a downtrend.
- Structural Imbalance: The pattern consists of two upward-sloping trendlines, with the lower support line being steeper than the upper resistance line.
- Volume Dynamics: Trading volume typically contracts as the pattern matures, signaling a lack of conviction from buyers (Thompson, 2025).
- Breakdown Signal: A sell signal is historically confirmed when the price closes decisively below the lower support trendline.
1. What Is a Rising Wedge Pattern?
The rising wedge pattern (also known as an “ascending wedge”) is a technical analysis formation used to identify potential price breakdowns after a period of upward movement. This section defines the pattern’s core mechanics and the specific technical requirements needed to classify a formation as a valid wedge.
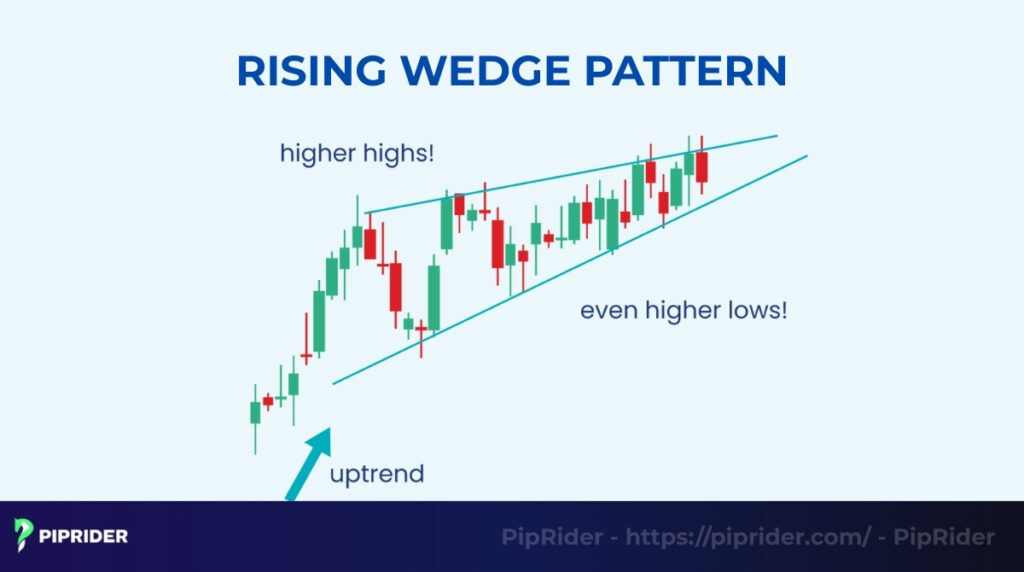
A rising wedge is characterized by price action that is “squeezed” between two converging, upward-sloping trendlines. It is considered a bearish pattern because the narrowing range indicates that bulls are struggling to maintain the same pace of growth as bears begin to exert more pressure at higher levels (StockCharts, n.d.). While the pattern is typically bearish, the market context determines whether it serves as a trend reversal or a trend continuation.
1.1. Technical Characteristics of a Valid Rising Wedge
To distinguish a rising wedge from a standard ascending channel or a bullish flag, the pattern must meet three primary criteria:
- Converging Upward Trendlines: Both the support line (connecting the lows) and the resistance line (connecting the highs) must slope upward and converge toward an apex.
- Steeper Support Line: The lower support line must rise at a steeper angle than the upper resistance line. This structural imbalance shows that buyers are being forced to step in earlier to defend price levels, while sellers are successfully capping the upside momentum.
- Decreasing Volume: As price nears the apex of the wedge, trading activity should generally decline. A lack of volume expansion on upward moves suggests the rally is being fueled by a lack of selling rather than strong, institutional buying (Thompson, 2025).
1.2. Why the Rising Wedge is Considered a Bearish Pattern
Understanding the bearish nature of the rising wedge requires looking beyond the upward movement to the underlying momentum. This section explains why this “bullish-looking” pattern often precedes a price drop.
According to Thompson (2025), the rising wedge is a major bearish signal because it represents failed momentum. Even though the price is technically making higher highs, the vertical distance between those highs is shrinking. This “wedge” shape is a visual representation of diminishing marginal gains; the effort required to push the price higher is increasing, while the actual results (the distance of the rally) are decreasing.
When the steeper support line is eventually breached, it often triggers a liquidation of “trapped” buyers who were betting on the continuation of the rally. This built-up selling pressure frequently leads to a sharp, decisive drop as the market seeks a new level of equilibrium.
1.3. Appearance in Uptrend vs. Downtrend
The rising wedge is versatile because it can signal different market transitions depending on the preceding trend. This section outlines how to interpret the pattern as either a reversal or a continuation signal.
The bias remains bearish in both scenarios, but the strategic application differs:
- In an Uptrend (Bearish Reversal): When a rising wedge forms after a sustained rally, it indicates that the buyers are becoming exhausted. It serves as a warning that the prevailing uptrend is losing steam and that a major reversal to the downside is likely.
- In a Downtrend (Bearish Continuation): If a rising wedge forms during a downtrend, it is often viewed as a temporary “correction” or a “bear market rally.” Once the support line breaks, it confirms that the recovery has failed and the broader bearish momentum is resuming (StockCharts, n.d.).
2. What Is the Structure of a Valid Rising Wedge?
The structural integrity of a rising wedge is defined by the relationship between its trendlines and the behavior of market participants as the pattern matures. This section outlines the four essential technical requirements that distinguish a valid rising wedge from other upward-sloping formations.
A valid rising wedge requires clear convergence, a specific slope imbalance, and a distinct shift in volatility. Without these elements, a chart formation may simply be a standard ascending channel, which carries significantly different market implications.
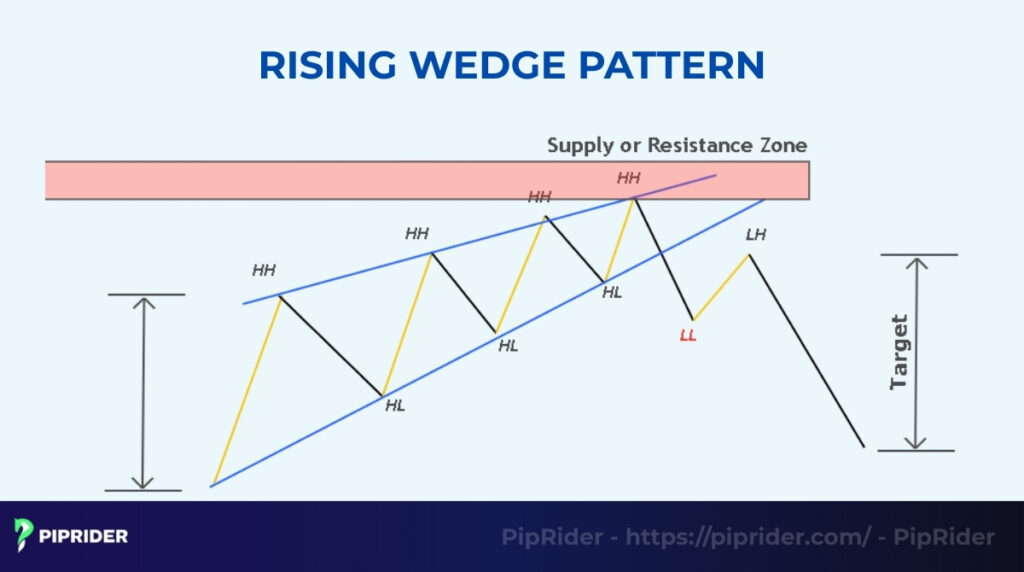
2.1. Converging Trendlines (Higher Highs + Higher Lows)
The formation is identified by connecting swing points with two upward-sloping trendlines. The upper resistance line must connect at least two higher highs, while the lower support line must connect at least two higher lows. For a wedge to be valid, these lines must be clearly heading toward an intersection point, known as the Apex. This convergence represents a narrowing price range, signaling that the market is entering a phase of consolidation.
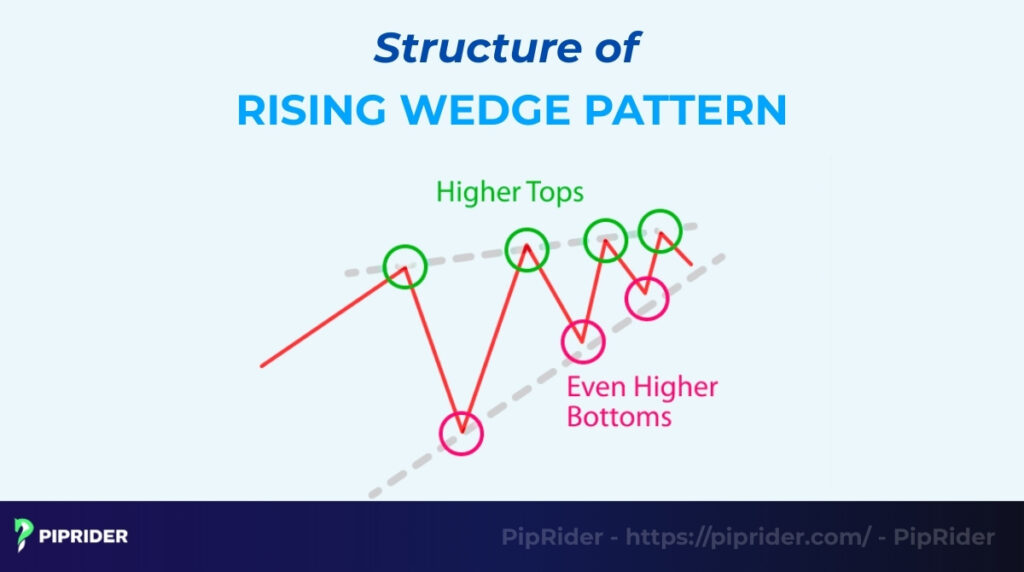
2.2. Steeper Lower Trendline: The Signal of Exhaustion
The most critical structural element of the rising wedge is the angle of the trendlines. In a valid wedge, the lower support trendline rises at a steeper angle than the upper resistance trendline. This imbalance indicates that while buyers are aggressively pushing the price up to prevent lower lows, they are failing to achieve significant new highs. This “squeeze” proves that despite the rising price, the bullish momentum is becoming increasingly unsustainable.
2.3. Volume Behavior During Formation and Breakout
Volume serves as a critical confirmation tool for the rising wedge pattern. Under standard technical guidelines, trading volume typically declines as price moves toward the apex of the wedge, suggesting that bullish conviction is fading (Thompson, 2025).
However, it is important to note two nuances:
- The Breakout Expansion: While volume often contracts during the formation phase, a valid bearish breakdown should ideally be accompanied by an expansion (spike) in volume (StockCharts, n.d.). This confirms that sellers have taken control and are aggressively pushing the price below support.
- Forex and Decentralized Markets: In markets like Forex, where centralized volume data is unavailable, traders should use “tick volume” as a proxy for participation. While not an absolute measure of dollar value, an increase in tick activity during a breakdown can still serve as a reliable signal of increased market engagement.
2.4. Tightening Price Action and the Compression Zone
As the trendlines converge, the price movements enter a compression zone characterized by decreasing volatility. This phase represents a buildup of potential energy; the market is being forced into a tighter and tighter space. Historically, this compression leads to a decisive breakout. Because the structural imbalance favors the bears, this breakout most frequently occurs to the downside, breaching the steeper lower support line.
3. What Is the Market Psychology Behind a rising wedge ?
The rising wedge is the visual representation of a shift in market sentiment where the effort exerted by buyers yields diminishing returns. This section explores the price-action logic that explains why this formation often leads to aggressive reversals.
Rather than looking at the pattern as a simple shape, traders should view it as a struggle between supply and demand where the “buy side” is losing its ability to drive the trend.
3.1. Diminishing Marginal Gains and Buyer Exhaustion
As the wedge progresses, the price continues to make higher highs, but the vertical distance between these peaks becomes smaller. This suggests that buyers are exhausting their resources. Each new high requires more effort to achieve less progress, signaling that the upward pressure is weakening. The narrowing price range is a clear indicator that the prevailing trend is losing the momentum required to maintain its trajectory.
3.2. Increasing Seller Aggression Near Resistance
While buyers struggle to push the price significantly higher, sellers begin to show increased aggression. They recognize the fading momentum and are willing to enter the market at slightly lower “higher highs” than they would in a healthy trend. This defensive behavior from sellers caps the upside potential, creating the upper resistance line that rises more slowly than the support line.
3.3. Breakout Dynamics and the Role of “Trapped” Liquidity
The aggressive nature of a rising wedge breakdown is largely driven by the location of stop-loss orders. Traders who entered long positions during the formation of the wedge typically place their protective stop-losses just below the lower support trendline.
When the price decisively breaks this support, it triggers a cascade of these stop-loss orders. Since a stop-loss for a long position is a market sell order, the simultaneous execution of these orders creates a surge in selling pressure. This “trap” dynamic explains why the initial drop following a wedge breakdown is often fast and volatile, as the market rapidly adjusts to the loss of bullish support.
4. Rising Wedge vs. Falling Wedge Comparison
To trade wedge formations effectively, it is essential to distinguish between the rising and falling variants. While both represent a contraction in price range and volatility, they signal fundamentally opposite market biases and requires different directional strategies.
This table provides a standardized comparison of the two patterns to help traders identify the correct bias based on structural characteristics:
| Feature | Rising Wedge | Falling Wedge |
|---|---|---|
| Structure | Higher Highs + Higher Lows | Lower Highs + Lower Lows |
| Trendline Slope | Both lines slope upward | Both lines slope downward |
| Primary Bias | Bearish | Bullish |
| Volume Behavior | Typically declining during formation | Typically declining during formation |
| Breakout Direction | Downward (through support) | Upward (through resistance) |
5. How Does the Rising Wedge Compare to Similar Patterns?
The rising wedge is frequently misidentified because it shares an upward slope with several other common chart formations. However, misidentifying a wedge can be a costly mistake, as patterns like the ascending triangle or channel often carry bullish continuation signals rather than bearish reversal ones.
The following table summarizes the key differences in shape, volatility, and signaling between the rising wedge and its closest technical relatives:
| Pattern | Shape (Slope) | Volatility | Primary Signal |
|---|---|---|---|
| Rising Wedge | Converging Upward | Decreasing (Compression) | Bearish Reversal/Continuation |
| Ascending Channel | Parallel Upward | Stable (Consistent Range) | Bullish Continuation |
| Bearish Flag | Parallel Upward (Short-term) | Stable (Pause) | Bearish Continuation |
| Ascending Triangle | Converging (Flat Top) | Decreasing (Targeted) | Bullish Continuation |
| Broadening Pattern | Diverging (Expanding) | Increasing (Chaos) | Bearish Reversal |
5.1. Rising Wedge vs. Ascending Channel
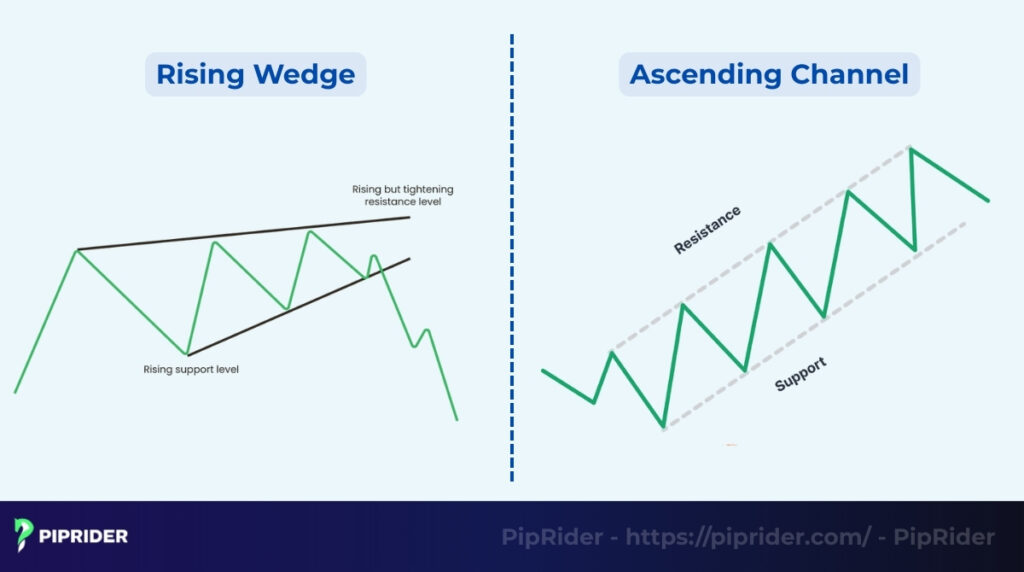
The primary differentiator between a rising wedge and an ascending channel is the sustainability of the trend. While both feature higher highs and higher lows, the rate of convergence reveals the strength of the underlying momentum.
- Rising Wedge: Features converging lines where the support rises faster than the resistance. This suggests the rally is losing strength and becoming unsustainable, as buyers are unable to push the price significantly higher despite maintaining higher lows.
- Ascending Channel: Consists of two parallel trendlines. This structure indicates a healthy, stable trend where both buyers and sellers are participating in a balanced, sustainable manner.
5.2. Rising Wedge vs. Ascending Triangle
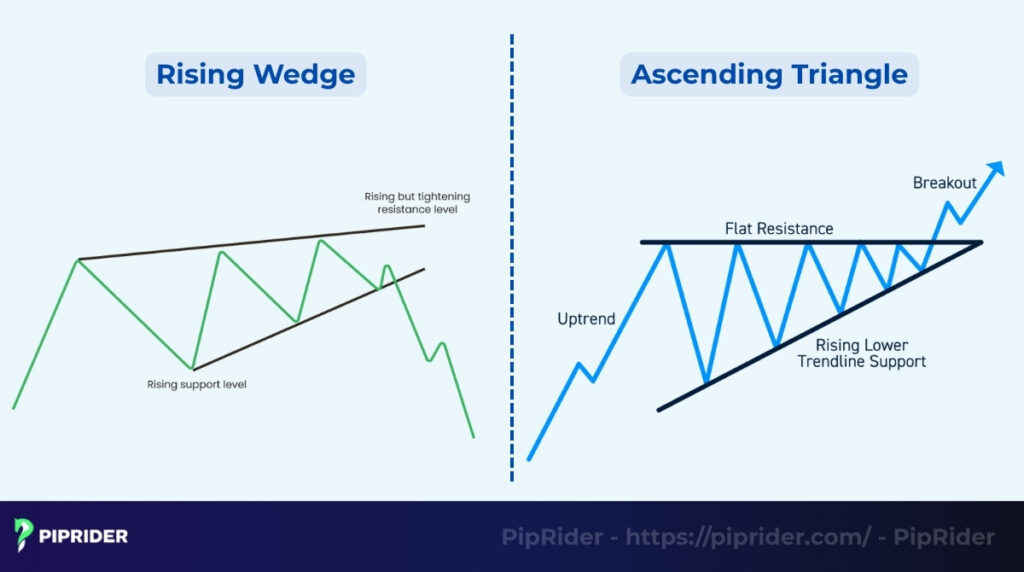
Both patterns involve price compression and decreasing volatility, but they differ in how the market handles resistance levels. This difference is critical for determining directional bias.
- Rising Wedge: Both lines slope upward, meaning there is no single horizontal target for buyers to focus on. This lack of a clear ceiling indicates an unstable, indecisive market where momentum is fading rather than building toward a breakout.
- Ascending Triangle: Features a clear, flat horizontal resistance line. This “ceiling” shows that buyers are persistently attacking a specific price level, which often leads to a bullish breakout once that level is breached.
5.3. Rising Wedge vs. Bearish Flag
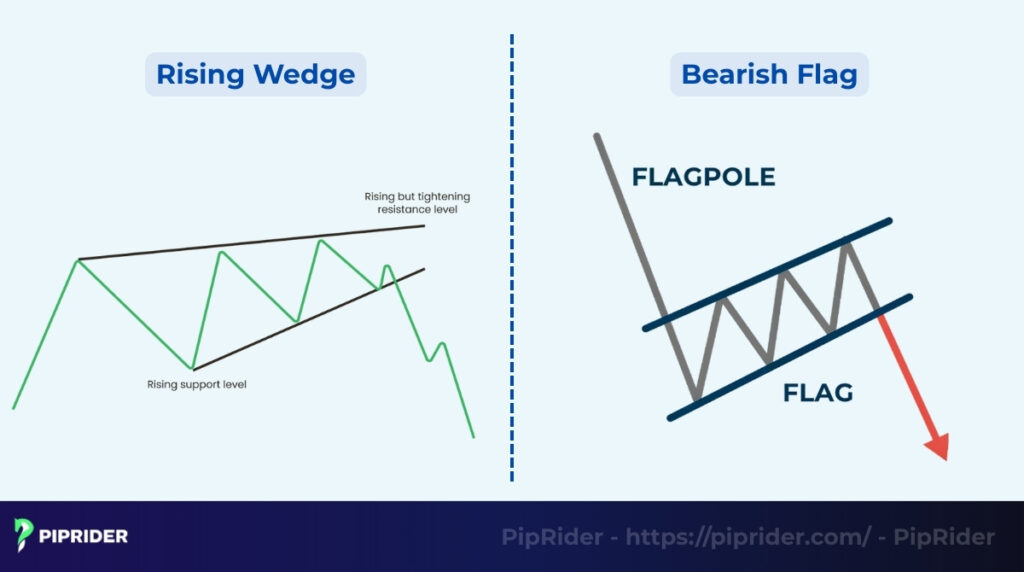
Both formations are often seen as continuation candlestick patterns within a downtrend, but they differ significantly in shape and psychological meaning. The bearish flag signals a brief, controlled rest, whereas the rising wedge implies genuine exhaustion.
- Rising Wedge: A medium-term, converging pattern. The “squeeze” in a wedge implies a more complex psychological breakdown; it suggests a genuine exhaustion of buyers during a brief recovery effort, rather than a simple pause.
- Bearish Flag: A short-term, tight, parallel structure that slopes against the main trend. It represents a brief, controlled “rest stop” for sellers before the primary downtrend resumes.
5.4. Rising Wedge vs. Broadening Pattern
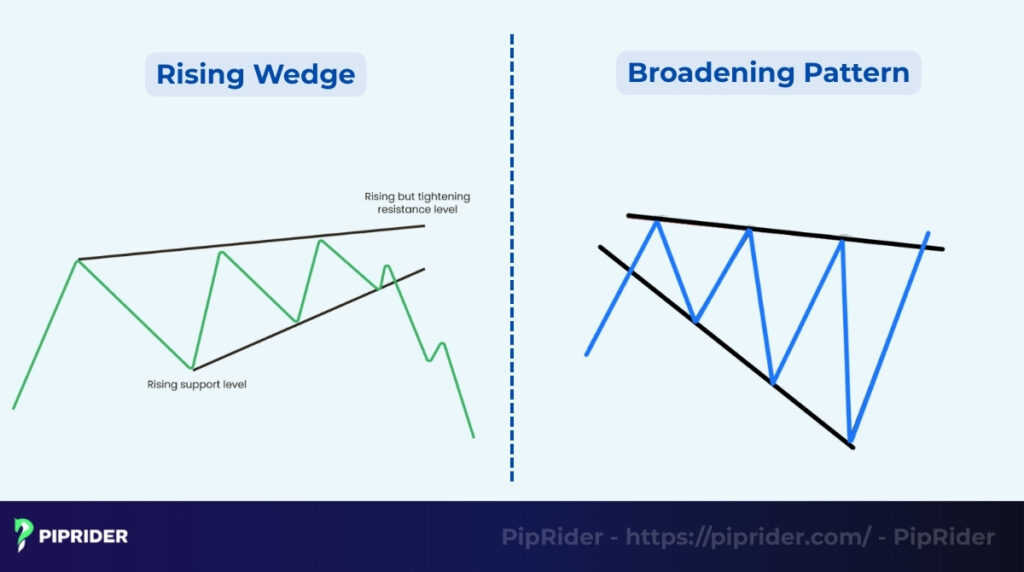
The rising wedge and the broadening pattern (often called a megaphone) are structural opposites based on volatility dynamics and participant psychology.
- Rising Wedge: The trendlines converge, meaning the price range gets smaller and volatility decreases. This represents a period of “calm” or compression before a breakout.
- Broadening Pattern: The trendlines diverge, meaning the price range expands and volatility increases. This represents market chaos and emotional trading, usually occurring at major market tops where fear and greed create unpredictable swings.
6. What Are the Different Types of Rising Wedge Breakdowns?
The rising wedge pattern does not exist in a vacuum; its effectiveness is heavily dictated by the preceding price action. This section examines how the pattern transitions from a consolidation phase into three distinct market outcomes: reversals, continuations, or deceptive traps.
6.1. Bearish Reversal Wedge (The Classic Top)
A bearish reversal occurs when a rising wedge forms at the peak of an extended uptrend. This scenario signals that the bulls, who have been in control for a significant period, are losing their ability to sustain higher prices. As the trendlines coil tightly at the highs, the breakdown below the lower support line serves as the primary confirmation that the uptrend has ended and a new bearish cycle has begun.
6.2. Bearish Continuation Wedge (The Bear Flag Variant)
When identified within an existing downtrend, the rising wedge acts as a temporary counter-trend rally or “correction.” In this context, the price grinds higher in a narrowing range, representing a period where sellers are taking profits and buyers are attempting a weak recovery. Because the primary trend is down, the subsequent breakdown below the wedge support confirms that the recovery has failed and the broader bearish momentum is resuming.
6.3. False Breakout (The Bull Trap)
The false breakout is a liquidity-seeking move designed to “trap” over-eager buyers before a major reversal. In this scenario, the price briefly pierces the upper resistance trendline, encouraging traders to enter long positions on a perceived bullish breakout. However, if the price immediately collapses back into the wedge and breaks the lower support, it indicates that the move was a bull trap. This result often leads to more aggressive selling as trapped buyers are forced to liquidate their positions simultaneously.
7. How to Trade the Rising Wedge Pattern (The Playbook)
Successfully trading the rising wedge requires a disciplined execution plan that accounts for entry triggers, risk placement, and logical exit targets. The following strategies provide a standardized “playbook” for different market environments, ensuring traders maintain a systematic approach to risk management.
7.1. Strategy 1: Breakdown Continuation (Most Common)
This strategy is applied when a rising wedge appears as a correction within a primary downtrend. It focuses on capturing the resumption of the macro bearish trend.
- Context: Rising wedge appearing after a significant price drop.
- Entry: Enter short on a decisive candle close below the lower support trendline. Professional traders often wait for a “break-and-retest” where the price returns to the broken support (now resistance) and shows a bearish rejection signal.
- Stop-Loss (SL): Place the stop-loss above the most recent swing high within the wedge or just above the upper wedge boundary.
- Take-Profit (TP): The primary target is the previous major support level. A secondary target can be set using the “measured move” (the height of the widest part of the wedge projected downward from the breakout point).
- Invalidation: A Daily candle close back inside the wedge boundaries suggests the breakdown was premature or false.
7.2. Strategy 2: Bearish Reversal Wedge (Uptrend Exhaustion)
This strategy targets the end of a long-term rally. It relies heavily on momentum oscillators to confirm that the price move is unsustainable.
- Context: Wedge formation after an extended move to the upside.
- Confirmation: Look for a bearish divergence on the RSI or MACD (where price makes higher highs but the indicator makes lower highs).
- Entry: Enter short upon a structure break (a close below the previous higher low) that coincides with the wedge breakdown.
- Stop-Loss (SL): Place the stop-loss above the final swing high of the wedge (the Apex area).
- Take-Profit (TP): Target the prior demand zones or the 61.8% Fibonacci retracement level of the entire preceding uptrend.
7.3. Strategy 3: The False Breakdown Filter (Professional Guardrail)
To avoid being caught in “whipsaw” price action, professional traders use specific filters to validate a breakdown before committing capital.
- Volume Filter: A high-probability breakdown should be accompanied by a visible spike in selling volume. If the price breaks support on low volume, the probability of a “fakeout” increases significantly.
- Time Filter: Avoid entering immediately on a “wick” (the candle shadow). Wait for a full candle body to close below the trendline on the timeframe you are trading (e.g., H4 or Daily).
- Action: If a breakdown lacks volume expansion or if the price returns inside the wedge within 1–2 candles, avoid the trade and wait for a more definitive signal.
7.4. Risk Management: Stop Loss Placement & Invalidation
Defining the point where your trade thesis is “proven wrong” is more important than the entry itself. For a rising wedge, invalidation occurs if the buyers regain enough strength to push the price back into the narrowing range or above the recent swing highs.
Traders should use technical invalidation points rather than arbitrary percentage stops. If the price achieves a Daily close back inside the wedge, the bearish logic is compromised, and the position should be reassessed or closed.
7.5. Profit Targets: Measured Move vs. Market Structure
While the “Measured Move” is the textbook target for a wedge, real-world market structure often provides more reliable exit points.
- Measured Move: Calculate the vertical height of the back (the widest part) of the wedge and project it down from the breakout.
- Structural Targets: Identify the “origin” of the wedge rally. Markets have a tendency to return to the level where the pattern first began forming. These are often major support or demand zones that offer high-probability areas for profit-taking.
8. Which Indicators Improve Rising Wedge Accuracy?
While the rising wedge is a distinct visual formation, its predictive power increases significantly when combined with technical indicators that measure momentum and participation. Using confluence allows traders to distinguish between a high-probability breakdown and a low-quality setup that may lead to a “whipsaw.”
To maintain a professional edge, traders should use a “confirmation checklist” to validate the structural weakness seen on the price chart:
| Indicator | What to Look For | Signal Meaning |
|---|---|---|
| Volume | Decline during wedge; Spike on break | Fading interest followed by aggressive selling |
| RSI | Bearish Divergence | Price rises while internal momentum weakens |
| MACD | Bearish Crossover / Histogram flip | Momentum shifts from positive to negative |
| EMA (20/50) | Price cross below the average | Loss of dynamic support and trend failure |
8.1. Volume Expansion as a “Truth Filter”
Volume is the most critical secondary indicator for a wedge. Under standard conditions, trading volume should visibly contract as the wedge reaches its apex, representing a lack of aggressive buying at higher prices. However, the breakdown itself must be accompanied by a volume expansion. A “low-volume” breakdown is often unreliable and may indicate a lack of institutional interest, whereas a sharp spike in selling volume confirms that the market has reached a tipping point.
8.2. Momentum Divergence (RSI/MACD)
Oscillators like the Relative Strength Index (RSI) provide insight into the “speed” of price movements. In a valid rising wedge, you will often see a bearish divergence: while the price is making higher highs, the RSI makes lower highs. This disagreement indicates that the underlying strength of the rally is exhausted, even if the price is still climbing. Similarly, a MACD crossover below the signal line or a histogram flip below zero can provide early warning of a trend shift before the support line is even touched.
8.3. Moving Average Confluence
Moving averages, such as the 20-period or 50-period Exponential Moving Average (EMA), act as dynamic support levels. A high-confidence short signal occurs when the price breaks below the wedge’s support line and a key moving average simultaneously. This “double failure” suggests that the short-term and medium-term trends have both turned bearish.
9. What Do Real Rising Wedge Examples Look Like?
Applying theoretical knowledge to live markets is essential for recognizing the subtle nuances of price action across different asset classes. These case studies illustrate how the rising wedge pattern functions as either a reversal or continuation signal in professional trading environments.
9.1. Forex Example: GBP/USD (H4 Chart)
In this scenario, the GBP/USD pair was in a sustained long-term downtrend. A multi-day relief rally formed a rising wedge, where the lows were climbing more aggressively than the highs, indicating a weak counter-trend move.
- The Setup: As price reached the apex, tick volume began to dry up.
- The Execution: A strong bearish engulfing candle closed below the support line on high tick volume. This confirmed the resumption of the primary downtrend, leading the pair toward new periodic lows.
9.2. Crypto Example: Bitcoin (Daily Chart)
During a major rally toward psychological resistance (e.g., $60,000), Bitcoin formed a large rising wedge. While the price reached new peaks, the RSI showed a clear downward slope (bearish divergence).
- The Setup: Buying volume was visibly lower on each subsequent higher high.
- The Execution: Once the lower trendline was breached at $58,000, it triggered a massive liquidation of long positions. This “stop-run” resulted in an aggressive price drop as the market rapidly revalued the asset based on the loss of momentum.
9.3. Stocks Example: Nvidia (Daily Chart)
After an overextended multi-month rally, Nvidia’s stock began to grind higher in a very tight range. The higher highs were barely exceeding the previous ones, showing that buyers were struggling to find value at record valuations.
- The Setup: A “gap down” occurred below the wedge’s support line following a catalyst (such as an earnings report).
- The Execution: This gap acted as a signal of institutional distribution. Traders used this as a trend-change indicator, often looking for put options or short entries as the stock entered a multi-week corrective phase.
10. What Are Common Mistakes Traders Make With Rising Wedges?
Trading the rising wedge successfully requires patience and strict adherence to structural rules. Most losses associated with this pattern result from psychological errors or a failure to consider the broader market environment.
10.1. Anticipating the Breakout (Impatience)
One of the most frequent errors is entering a short position while the price is still contained within the wedge. Because the pattern involves higher lows, the price can easily bounce off the support line one last time to hit a new high before finally breaking. A professional approach requires waiting for a decisive candle close below the support line to confirm the signal.
10.2. Disregarding the Macro Context
No pattern works in isolation. A rising wedge appearing in a strong, macro-bullish uptrend has a much lower probability of a full reversal compared to one appearing after a parabolic, overextended rally. If the broader market (e.g., S&P 500 or the primary currency trend) is extremely bullish, a small wedge may simply be a “bear trap” or a minor pause rather than a trend-killer.
10.3. Structural Confusion: Channels vs. Wedges
Traders often confuse an Ascending Channel with a Rising Wedge. The distinction is in the geometry: a wedge must have converging lines. If the support and resistance lines are parallel, the momentum is stable and the bullish trend is likely healthy. Shorting an ascending channel under the assumption that it is a wedge often leads to unnecessary losses.
10.4. Ignoring Volume and Divergence
Relying solely on the shape of the price action is a high-risk strategy. A valid rising wedge should be supported by evidence of dying momentum. If the price is forming a wedge but volume is increasing and momentum oscillators are making new highs, the pattern is likely to “fail” to the upside, continuing the bullish trend.
11. Which Tools Can Help You Spot Rising Wedges?
Identifying converging trendlines manually can be subjective and time-consuming, often leading to inconsistent results. Modern trading platforms offer automated tools and scanners that use mathematical algorithms to detect these formations with high precision.
- TradingView (Built-in Scanner): TradingView provides a sophisticated pattern recognition tool that does not require custom coding. By navigating to the “Indicators” tab and selecting “Technicals” > “Chart Patterns” > “Rising Wedge,” the platform will automatically highlight valid formations and potential breakdown targets on your active chart.
- TrendSpider (AI Recognition): Specifically designed for automated technical analysis, TrendSpider uses AI to scan thousands of securities instantly. Its “Market Scanner” identifies geometric shapes like the rising wedge across multiple timeframes, allowing traders to find opportunities without manual chart flipping.
- MT4/MT5 (Custom Indicators): The MetaTrader platforms do not include geometric pattern recognition by default. However, traders can access the MQL5 Market to download custom “Wedge Pattern Scanners.” These tools draw trendlines automatically and can be configured to send mobile or desktop alerts when the price nears a critical breakdown point.
- AI Detection Scripts (LuxAlgo & Finviz): LuxAlgo is a premium TradingView script that enhances visual clarity by projecting breakdown targets and institutional volume zones. For stock traders, Finviz offers a free web-based screener where users can filter the entire market for “Wedge” patterns under the Technical tab, providing a quick daily list of potential setups.
12. Frequently asked questions about the Rising Wedge Pattern
13. Conclusion
The rising wedge pattern serves as a critical warning sign that a prevailing upward move is losing its internal support. While the ascending price action may appear bullish to the untrained eye, the narrowing trendlines and contracting volume reveal a structural instability that often precedes a sharp bearish reversal or continuation.
To trade this formation successfully, a “risk-first” approach is essential. Never attempt to guess the top of the wedge; instead, wait for a confirmed breakdown of the lower support line supported by volume expansion. By combining visual pattern recognition with momentum indicators and macro context, you can transform this complex formation into a high-probability component of your trading strategy.
Ready to spot the next big reversal? Explore the comprehensive trading strategies at Piprider today.


