
Fibonacci retracement helps traders identify likely pullback zones inside a trend. However, the real edge does not come from drawing the levels alone; it comes from choosing the right swing points and combining the tool with confirmation signals such as price action, support/resistance, or momentum indicators. This guide covers how to draw levels accurately on platforms like MT4 and how to integrate them into a professional trading framework.
Key Takeaways
- Fibonacci Retracement is a tool used to identify potential support and resistance zones.
- It is a widely watched technical indicator for trend-based strategies.
- The tool uses Fibonacci ratios (e.g., 38.2%, 61.8%) to highlight likely reaction zones where a price correction may pause.
- This tool works most effectively in clear, trending markets.
- It should be combined with other technical tools (like RSI or Price Action) for increased accuracy.
- Common errors include selecting insignificant swing points or relying on Fibonacci as a standalone signal.
Quick Fibonacci Rules for Beginners
- Trend is key: Only use Fibonacci retracement in a clearly trending market.
- Correct direction: In an uptrend, draw from the main Swing Low to the Swing High. In a downtrend, draw from the High to the Low.
- Think in zones: Treat levels as areas of interest rather than exact, “magic” price lines.
- Wait for confirmation: Never enter a trade just because a level is hit; wait for a candlestick or indicator signal.
- Never trade alone: Always use Fibonacci in conjunction with other technical analysis tools.
1. What is Fibonacci retracement? Why does it matter in forex?
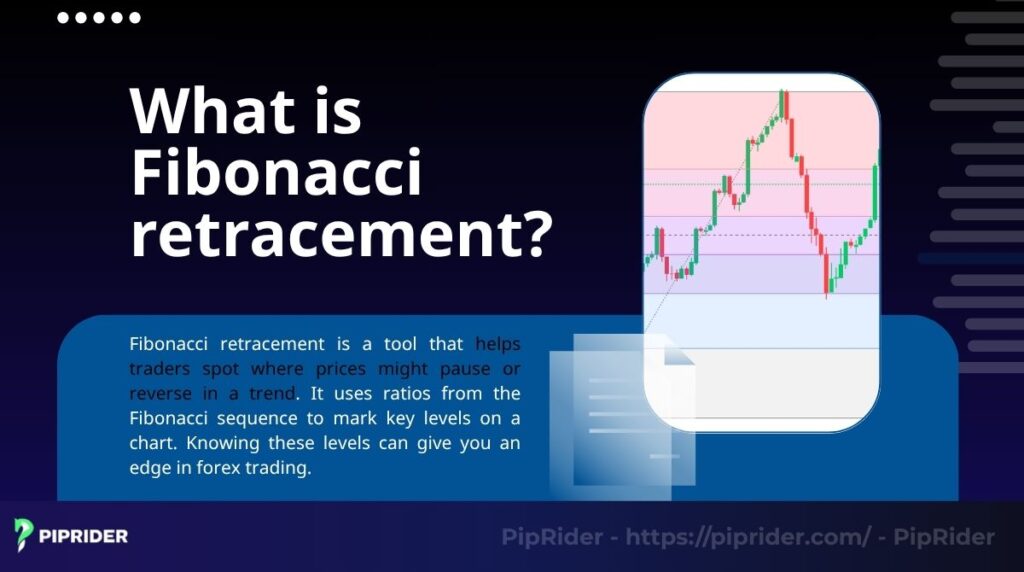
Fibonacci retracement is a technical analysis tool that helps traders identify areas where prices might pause or experience a temporary reversal within an established trend. It uses ratios derived from the Fibonacci sequence to mark key levels on a chart. Understanding how to interpret these zones can provide a structured framework for making informed trading decisions.
Traders use Fibonacci retracement levels to identify potential price points and areas where an asset may pause, reverse direction, or maintain its movement within an ongoing trend. These levels are derived from mathematical ratios found in the Fibonacci sequence.
1.1. Historical Background
The origins of the Fibonacci sequence trace back to ancient mathematics, documented in Indian and Arabic cultures before being introduced to Western Europe in the 13th century by Leonardo of Pisa, better known as Fibonacci (Fibonacci, 1202/2002).
In his work Liber Abaci, he introduced the sequence to a wider audience and championed the adoption of the Hindu-Arabic numeral system. Fibonacci’s contributions extend beyond mathematics, influencing science, nature, architecture, and finance. Its link to the “golden ratio” is observed in various natural patterns, making it a relevant concept for analyzing crowd behavior in financial markets.
1.2. Common reversal levels with Fibonacci retracement
Fibonacci retracement levels are typically drawn at specific percentages: 23.6%, 38.2%, 50%, 61.8%, and 78.6%. These levels originate from a number sequence discovered by Leonardo Pisano. It is notable how these mathematical concepts align with modern market behavior and trader psychology.
The sequence (0, 1, 1, 2, 3, 5, 8, 13…) involves each number being the sum of the two preceding it. Dividing these numbers results in specific ratios, such as 61.8% (the golden ratio) and 38.2%, which traders use to highlight likely reaction zones. These ratios often align with areas where market participants look for potential entries or exits.
1.3. Why Fibonacci matters in forex
In forex, Fibonacci tools help you identify potential support (where prices might stop falling) or resistance (where prices might stop rising). For example, in an uptrend, prices often pull back to a Fibonacci level before resuming the primary move. This is frequently observed in major pairs like EUR/USD, where a correction to the 61.8% level can precede the next leg of the trend.
These levels carry weight because they are widely watched reference levels, creating a psychological effect in the market. When a significant number of traders monitor the 61.8% level, the resulting concentration of orders can lead to observable price reactions. This tool is especially useful in trending markets, where clear highs and lows provide reliable anchors for the retracement levels.
Summary: Fibonacci retracement is a foundational tool for identifying key price zones in forex trading. Its mathematical roots and widespread use by market participants make it a valuable addition to a technical strategy. By understanding these basics, you are ready to learn how to correctly plot these levels on your charts.
2. How does Fibonacci retracement work in forex trading?
The functionality of Fibonacci retracement is based on a combination of mathematical ratios and collective market behavior. By identifying these levels, traders attempt to find logical entry points that align with the natural ebb and flow of a trending market.
2.1. Calculating Fibonacci levels
To calculate Fibonacci retracement levels, you must first identify the price range of a specific move, defined by a “Swing High” (the peak) and a “Swing Low” (the trough).
For example, if the EUR/USD moves in an uptrend from a low of 1.1000 to a high of 1.1500, the calculation for the 61.8% level is as follows:
- Calculate the price range: 1.1500 – 1.1000 = 0.0500
- Apply the ratio: 0.0500 × 0.618 = 0.0309
- Determine the level: 1.1500 – 0.0309 = 1.1191
In this scenario, 1.1191 becomes a potential support zone. While most modern platforms like TradingView or MT4 perform these calculations automatically, understanding the underlying math helps traders appreciate the relationship between price volatility and retracement depth.
2.2. Market psychology behind Fibonacci
The effectiveness of these levels is often attributed to crowd psychology rather than inherent mystical properties. Because these levels are standard features on almost every trading platform, thousands of traders monitor them simultaneously.

When a large number of market participants place buy or sell orders around the 50% or 61.8% thresholds, they create a self-fulfilling prophecy. This collective action is why Fibonacci levels often act as “sticky” zones where price action stalls or reverses. However, traders should be aware of confirmation bias—the tendency to notice only the instances where a level worked while ignoring the times it was breached without a reaction.
3. How to Choose the Right Swing High and Swing Low
Selecting the correct anchor points is the most critical step in using Fibonacci tools. Choosing insignificant “price wiggles” can result in messy, unreliable levels that do not align with the broader market trend.
Checklist for Selecting High-Probability Swings:
- Identify the primary impulse: Look for the most recent, clear, and aggressive move in the direction of the trend.
- Visual prominence: The Swing High and Swing Low should be “obvious” at a glance. If you have to zoom in significantly to find the point, it is likely not a major structural level.
- Avoid noise: Do not pick minor fluctuations within a consolidation zone. The swing should represent a distinct shift from one price point to another.
- Check the timeframe: Swings identified on higher timeframes (H4 or Daily) generally carry more weight than those on 1-minute or 5-minute charts.
4. Steps to use the Fibonacci retracement tool on trading platform
Once you have identified the appropriate swing points, applying the tool on platforms like MT4, MT5, or TradingView is a straightforward technical process.
4.1. Step-by-step guide to applying the tool
To plot the levels accurately, follow these logical steps:
- Step 1: Identify the trend: Determine if the market is making higher highs (uptrend) or lower lows (downtrend).
- Step 2: Select the tool: Find the “Fibonacci Retracement” icon in your platform’s object list or toolbar.
- Step 3: Drag and Drop:
- In an Uptrend: Click on the Swing Low and drag the cursor to the Swing High.
- In a Downtrend: Click on the Swing High and drag the cursor to the Swing Low.
- Step 4: Analyze the grid: The platform will project the key ratios (23.6%, 38.2%, 50%, 61.8%, 78.6%) between your selected points.
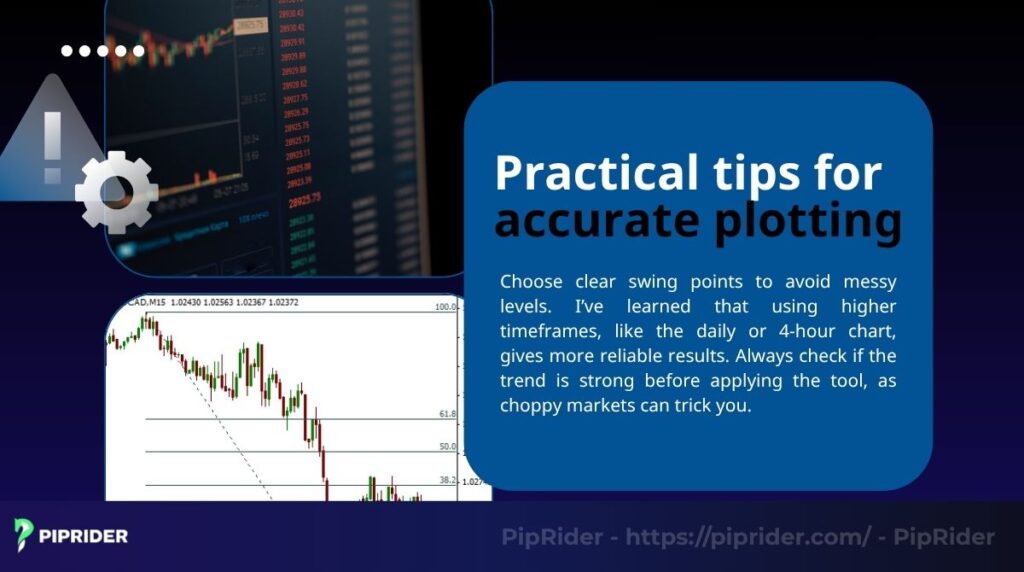
4.2. Practical tips for accurate plotting
- Use Wick-to-Wick: Most professional traders recommend drawing from the absolute tip of the upper wick to the absolute tip of the lower wick to capture the full range of market volatility.
- Verify the trend strength: Fibonacci tools are most reliable in strong trends. In “choppy” or range-bound markets, price may ignore these levels entirely.
- Confluence check: Once plotted, look to see if a Fibonacci level aligns with a previous horizontal support/resistance zone or a moving average. This “confluence” significantly increases the probability of a successful trade.
Summary: Mastering the application of Fibonacci levels requires more than just technical clicks; it requires the ability to identify significant market moves and understand the psychological pressure at key ratios. By following a disciplined approach to choosing swings, you can turn a simple mathematical tool into a powerful decision-making framework.
5. How to interpret Fibonacci retracement levels
Reading Fibonacci retracement levels is about identifying signals within a busy market. Each level represents a different degree of market correction and offers clues about whether the current trend is likely to continue or if a deeper reversal is underway.
5.1. The Key Fibonacci Levels and What They Mean
Rather than treating every level the same, professional traders categorize them based on the depth of the “pullback” they represent. The following table summarizes the most common levels and their typical applications:
| Level | Meaning | Best Use Case |
|---|---|---|
| 23.6% | Shallow Retracement | Indicates a very strong trend; price declines are minimal before continuation |
| 38.2% | Moderate Pullback | A common entry point in a healthy, fast-moving trend |
| 50.0% | Midpoint Rejection | Not a true Fibonacci ratio, but widely watched as a psychological “halfway” point |
| 61.8% | The Golden Ratio | The most critical level for deep but healthy pullbacks; high probability of reversal |
| 78.6% | Deep Retracement | Often the last line of defense for a trend; a break below this often suggests a trend change |
5.2. Watching price behavior for confirmation
To read these levels effectively, you must observe how price action reacts when it enters these zones. In an uptrend, for instance, you are not just looking for the price to “touch” the 50% level; you are looking for a sign that buyers are stepping back in.
Common signs of confirmation include:
- Candlestick Patterns: Look for bullish rejections (like a Pin Bar or Engulfing pattern) at a support level in an uptrend.
- Volume or Momentum: Check if selling pressure is fading as the price approaches a key Fibonacci zone.
- Confluence: The signal is much stronger if a Fibonacci level aligns with a previous peak or trough (horizontal support/resistance).
6. A Simple Fibonacci Retracement Trading Strategy
To use Fibonacci effectively, you need a repeatable framework. Below is a “Trend Continuation Pullback” strategy designed to help you enter trades with the prevailing market momentum.
The “Trend Pullback” Framework:
- Identify a Strong Trend: Ensure the market is making clear higher highs and higher lows (for a buy) or lower highs and lower lows (for a sell).
- Select your Swing: Locate the most recent major impulse move and draw your Fibonacci tool from Wick-to-Wick.
- Identify the “Kill Zone”: Focus your attention on the area between the 38.2% and 61.8% levels. This is where most high-probability pullbacks conclude.
- Wait for the Trigger: Do not set “blind” limit orders. Wait for the price to enter the zone and produce a reversal candlestick (e.g., a hammer or bullish engulfing).
- Set your Risk Management: * Stop-Loss: Place your stop-loss slightly beyond the next Fibonacci level (e.g., if entering at 50%, place the stop below the 61.8% or 78.6% level) to allow for “market breath.”
- Take-Profit: Target the previous Swing High (the 0% level) or use Fibonacci extensions for higher targets.
Summary: Knowing how to interpret levels and follow a structured strategy transforms Fibonacci from a collection of lines into a professional decision-making tool. By waiting for confirmation in the “Kill Zone,” you significantly improve the probability of your trades.
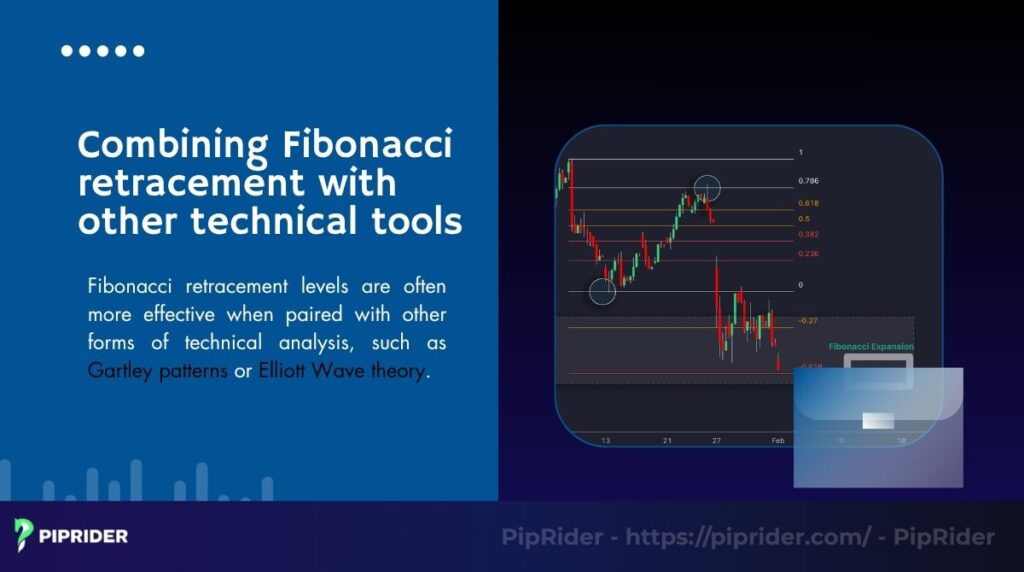
7. Best Ways to Combine Fibonacci With Other Tools
Fibonacci retracement levels are most effective when they align with other technical signals. This concept, known as “confluence”, increases the probability that a level will hold. By pairing Fibonacci with these core tools, you can build a more robust trading framework.
7.1. Fibonacci and Support/Resistance (The Power of Confluence)
The strongest Fibonacci setups occur when a retracement level aligns perfectly with a previous horizontal support or resistance zone. If the 61.8% level sits exactly where a previous price peak occurred, it becomes a “high-interest” zone for the entire market. This overlap often acts as a magnet for price and a launchpad for the next trend leg.
7.2. Combining with Trendlines and Moving Averages
- Trendlines: In a trending market, you can draw a trendline connecting the lows (in an uptrend). If the price pulls back to touch both the trendline and a Fibonacci level (like the 38.2% or 50%) at the same time, it provides dual confirmation for a potential entry.
- Moving Averages: Many traders use the 50-period or 200-period Simple Moving Average (SMA) as dynamic support/resistance. When a Fibonacci level “clusters” near a major moving average, it strengthens the validity of that price zone.
7.3. Using Oscillators (RSI and MACD)
Indicators like Moving Average Convergence Divergence (MACD) and Relative Strength Index (RSI) help confirm if a retracement has exhausted itself. For example, if the price hits the 61.8% Fibonacci level while the RSI shows “oversold” conditions (below 30), it provides a technical reason to expect a bullish reversal.
7.4. Advanced Use Cases: Harmonic Patterns and Elliott Wave
For more experienced traders, Fibonacci ratios are the building blocks for complex analysis:
- Harmonic Patterns: Formations like the Gartley or Bat pattern use specific Fibonacci measurements to define their structure. For instance, the “D” point of a Gartley pattern often completes near the 78.6% retracement level.
- Elliott Wave Theory: This theory relies on Fibonacci to project the depth of corrective waves. Typically, Wave 2 will retrace a significant portion of Wave 1 (often near 61.8%), while Wave 4 tends to be a shallower retracement of Wave 3 (often near 38.2%).
8. When Fibonacci Works Best (and When to Avoid It)
Fibonacci is not a “magic” tool that works in every market condition. Its reliability depends heavily on the environment in which it is applied.
| Market Condition | Fibonacci Reliability | Reasoning |
|---|---|---|
| Strong Trends | High | Clear “Impulse” moves provide reliable anchor points for the tool |
| Higher Timeframes (H4/Daily) | High | Reduces market “noise” and captures moves watched by institutional traders |
| Major Currency Pairs | Moderate to High | High liquidity ensures that technical levels are more likely to be respected |
| Sideways/Choppy Markets | Low | Price oscillates without direction, making Fibonacci levels irrelevant |
| High-Impact News Events | Very Low | Volatility during news often “slices” through technical levels regardless of their significance |
Key Takeaway on Market Context:
If you cannot identify a clear trend with rising highs or falling lows, it is usually best to keep the Fibonacci tool in your pocket. The most reliable “signals” occur when a Fibonacci level aligns with structural market history and is confirmed by higher timeframe price action.
9. Frequent errors to watch out for when applying Fibonacci retracement
Fibonacci is a powerful tool, but its effectiveness is often compromised by common user errors. Avoiding these pitfalls will help you maintain a objective view of the market.
9.1. Picking the wrong swing points
Choosing incorrect swing highs and lows is the most common mistake. If you anchor the tool to minor price fluctuations rather than major structural peaks and troughs, the resulting levels will likely be ignored by the broader market. Always look for the most prominent move on a higher timeframe (like H4 or Daily) to ensure your levels align with institutional interest.
9.2. Relying only on Fibonacci
Using Fibonacci retracement levels as a standalone signal is risky. Prices do not always respect these levels, especially if there is no other technical reason for them to do so. Combine Fibonacci with indicators such as RSI, moving averages, or specific candlestick patterns to create a more reliable “confluence” of evidence.
9.3. Ignoring market conditions
Fibonacci works best in trending markets. In a sideways or “choppy” market, price action tends to oscillate through levels without any clear reaction. If the market lacks a clear direction, the Fibonacci tool will likely produce false signals.
9.4. Expecting perfect reversals
Treating Fibonacci levels as exact lines rather than “zones” often leads to frustration. Price may briefly slice through a level before reversing, or it may turn just ahead of it. Always use a small buffer or “zone” of interest and manage your risk with stop-losses placed beyond the invalidation point.
Invalidation Checklist: When to Delete Your Fib
If any of the following occur, your current Fibonacci setup is likely no longer valid:
- Trend violation: The price breaks the original Swing Low (in an uptrend) or Swing High (in a downtrend).
- Extended consolidation: The price moves sideways for a long period without reacting to the levels.
- New impulse move: A new, stronger move has occurred that creates a more relevant Swing High/Low.
- Level overrun: Price “slices” through the 78.6% level with high momentum; the original trend is likely over.
10. Real-World Chart Examples
To see how these concepts translate to live markets, let’s look at two common scenarios where Fibonacci levels provided clear trading opportunities.
Example 1: EUR/USD Uptrend Pullback (50% Level)
- Context: EUR/USD was in a strong daily uptrend. A sharp impulse move pushed the price from 1.0800 to 1.1200.
- Setup: The price began to correct. Traders plotted the Fibonacci from the 1.0800 low to the 1.1200 high.
- The reaction: The pair dropped to the 1.1000 zone (the 50% retracement level), which also aligned with a previous resistance-turned-support area.
- Trigger & result: A bullish engulfing candle formed at the 50% level. Traders who entered here saw the trend resume, eventually reaching new highs above 1.1200.
Example 2: GBP/USD Downtrend Rally (61.8% Level)
- Context: GBP/USD moved from 1.3000 down to 1.2400.
- Setup: Following the move, the price began a “relief rally” (a pullback in a downtrend). The Fibonacci tool was drawn from the 1.3000 high to the 1.2400 low.
- The reaction: Price rallied toward 1.2770, which sat exactly at the 61.8% “Golden Ratio”.
- Trigger & result: A bearish pin bar formed at the 61.8% level. This served as a signal that the correction was over, and the price subsequently fell back toward the 1.2400 support.
11. FAQs: Your questions about Fibonacci retracement answered
12. Conclusion
Fibonacci retracement is one of the most versatile tools in a forex trader’s arsenal, particularly for identifying high-probability entry and exit zones during market trends. However, its true value is unlocked only when you choose the correct swing points and wait for confirmation.
By treating these levels as “interest zones” rather than exact lines, and by combining them with tools like moving averages or candlestick patterns, you can develop a disciplined, rule-based approach to the markets. Remember to practice identifying significant swings on a demo account before applying these techniques to live capital.
At PipRider, we are committed to helping you master the technical tools needed for trading success. Our blog is packed with resources to support your journey, whether you’re exploring our “Beginner” section.


