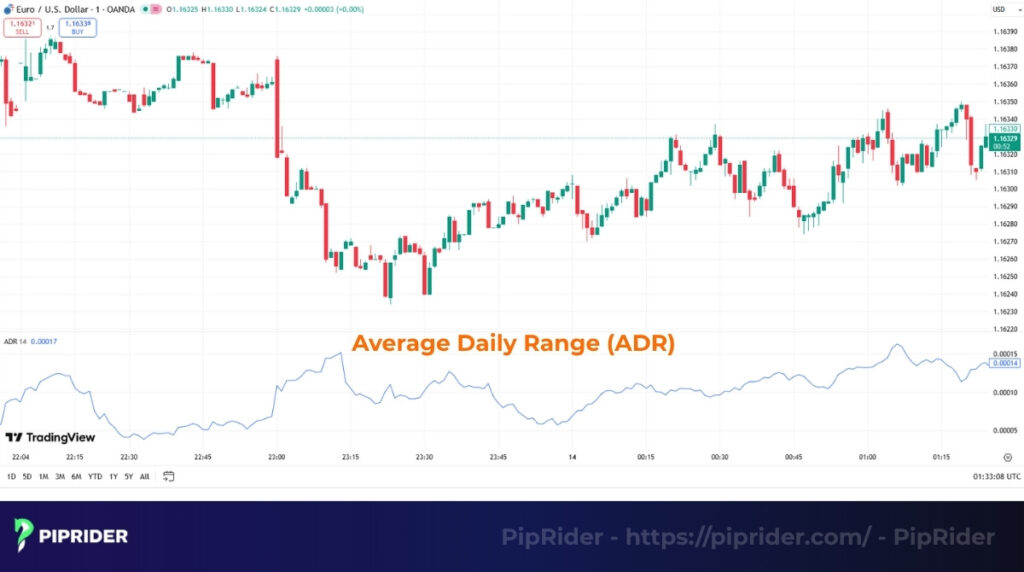
To calculate the Average Daily Range (ADR), you find the average of the simple (High – Low) range of an asset over a set period, like 14 days. Unlike the ATR, the ADR ignores overnight gaps, making it a popular volatility tool for day traders.
This guide explains how to calculate the ADR indicator with a simple formula and details the critical differences between ADR vs. ATR. Piprider also shows how to use this metric to set daily profit targets and stop-loss levels.
Key Takeaways
- The Average Daily Range (ADR) is an indicator that shows an asset’s average (High-Low) price movement for one day.
- It is calculated by averaging the daily price range(Daily High – Daily Low) over a set period (e.g., 5-14 days).
- ADR vs. ATR: The key difference is that ADR ignores overnight gaps, while the ATR indicator (Average True Range) includes gaps.
- Day traders use the ADR to set realistic daily profit targets (e.g., 80% of the ADR) and to place stop-loss orders outside of the normal “noise.”
- A common trading strategy is to identify “overextended” moves. If the price has already moved 100% of its ADR, it is less likely to continue in that direction.
1. What Is the Average Daily Range (ADR)?
The Average Daily Range (ADR) is a simple indicator that measures the average distance an asset’s price moves between its high and low on a typical day. It is usually calculated over the last 5 to 14 days.
For traders, the ADR indicator is a powerful volatility tool. It helps them set realistic expectations for how far the price might move in a single day. This information is crucial for:
- Setting logical take-profit targets.
- Placing stop-loss orders outside of the expected daily “noise.”
- Identifying if a market is in a low-volatility (sideways) or high-volatility (trending) state.
The ADR is often confused with the ATR indicator (Average True Range), but there is one critical difference: the ADR ignores overnight gaps and only measures the (High – Low) of the day. The ATR, however, includes gaps in its calculation.
2. Why Does the ADR Matter in Trading?
The ADR matters because it gives you a data-driven map of a normal trading day, especially in the Forex market. Instead of guessing, you get a clear statistical average for how far a price is likely to move, which is critical for making good decisions.
- Measuring the natural daily price range of a stock or forex pair helps you understand its unique personality.
- The ADR indicator helps you avoid “chasing” a trade. If the price has already moved beyond its average daily range, entering a new trade in that same direction is very high-risk.
- Providing a logical basis for setting Stop-Loss (SL) and Take-Profit (TP) levels is the ADR’s most popular use.
- This tool also helps traders identify market conditions. A very low ADR signals a quiet, “sideways” market, while a rising ADR signals a “trending” market with high volatility.
3. How to Calculate the ADR Indicator? (Formula and Example)
Learning how to calculate the ADR indicator involves taking a simple average of the daily (High – Low) range over a set number of days. Unlike the ATR, this formula ignores overnight gaps, making it a “cleaner” measure of a single day’s expected volatility for technical analysis.
Note on data consistency: ADR is calculated from daily candles. Your daily candle boundaries depend on your broker’s server time. Many professional FX traders prefer using “New York Close” candles to ensure consistency in their ADR calculations across different platforms.
3.1. The ADR Formula
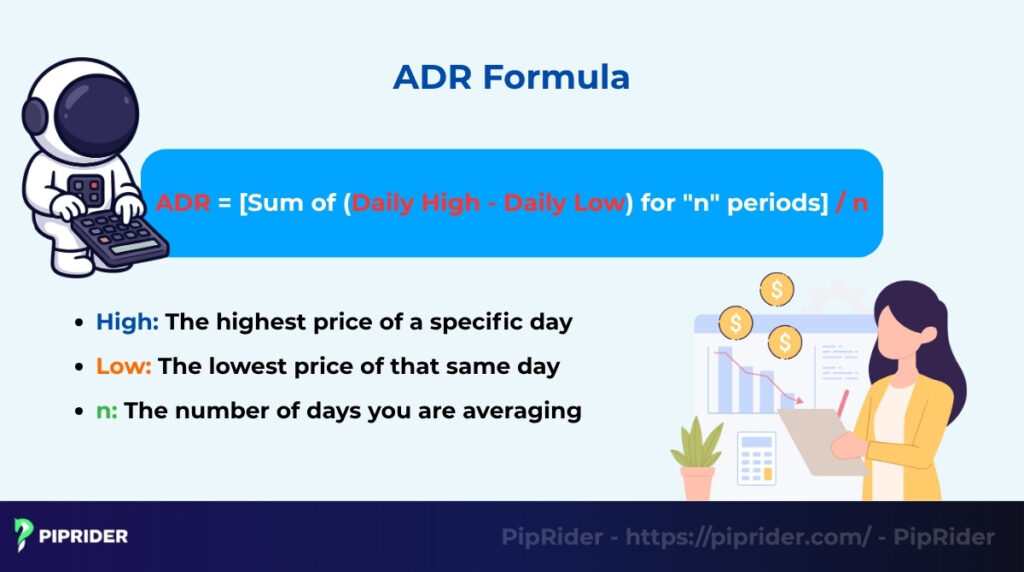
The formula for the Average Daily Range in plain text is:
ADR = [Sum of (Daily High – Daily Low) for “n” periods] / n
- High: The highest price reached during a specific trading day.
- Low: The lowest price reached during that same day.
- n: The number of days being averaged (a 14-day period is standard, but 5 or 10 days are used for more recent volatility).
3.2. Comparing Volatility with ADR%
While ADR in pips works well for Forex pairs like EUR/USD, it is difficult to use when comparing different asset classes (like Gold vs. Stocks) or instruments with vastly different price scales. To solve this, traders use ADR%.
The ADR% Formula:
ADR% = (ADR / Current Price) x 100
Pro tip: Use ADR% when comparing instruments with different price scales. For example, a 100-pip move on EUR/USD represents a different percentage of volatility than a $10 move on Gold. Many screeners, such as those on TradingView, allow you to filter assets based on the ADR% indicator to find the most volatile setups (TradingView, n.d.).
3.3. Step-by-Step Example
You don’t need to do this math manually (the ADR indicator does it for you), but here is how the calculation works for a 14-day period on EUR/USD.
- Gather data: Get the High and Low price for each of the last 14 trading days.
- Find daily ranges: For each day, calculate: $(High – Low)$.
- Sum the ranges: Add up the ranges for all 14 days.
- Average: Divide that total by 14.
Example (EUR/USD):
- Total of the last 14 daily ranges = 1,260 pips
- $ADR(14) = 1,260 \text{ pips} / 14$
- ADR = 90 pips
This 90-pip value tells you that over the last 14 days, EUR/USD has moved an average of 90 pips between its high and low.
3.4. ADR vs. ATR: The Key Differences
The most important question traders ask is how the ADR compares to the ATR indicator (Average True Range). The key difference is that ADR ignores price gaps, whereas ATR includes these gaps to measure total market volatility (Fidelity Investments, n.d.).
| Factor | Average Daily Range (ADR) | Average True Range (ATR) |
| Gaps included? | No | Yes |
| Primary use case | Measures a single session’s average range | Measures overall volatility, including gaps |
| Common period | 5–14 days | 14 days |
| Best for | Intraday (day) traders | All traders, including swing/position |
4. How Do You Use the ADR in Trading?
The Average Daily Range’s real value is in its application for day trading. You can use it to identify overextended moves, set logical profit targets and stop-losses, filter low-volatility markets, and confirm signals with other indicators.
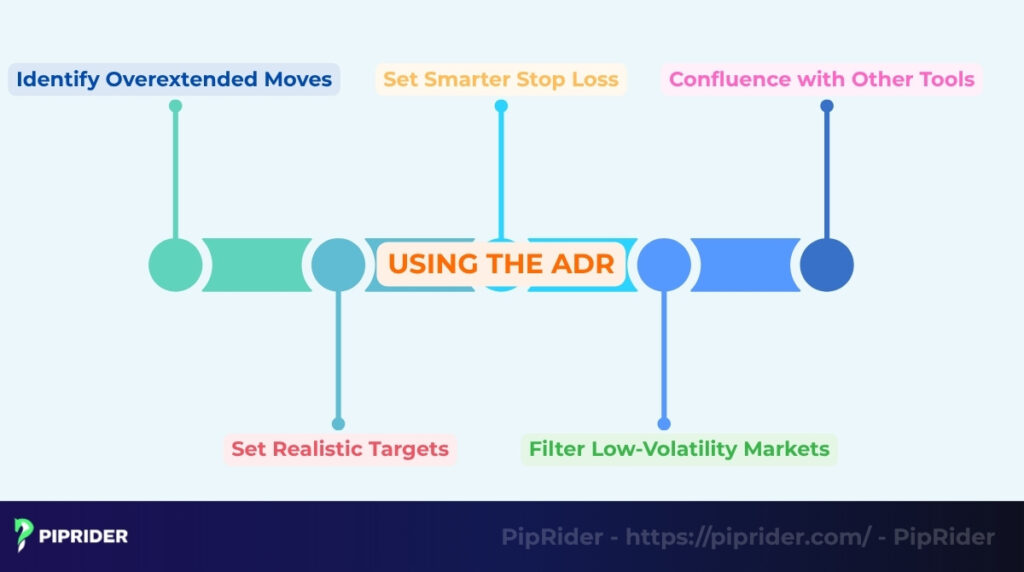
4.1. Identify Overextended Moves
A primary use of the ADR is to identify “overextended” moves. If an asset’s price has already moved the full 100% of its ADR for the day, the tank is likely “empty.” Chasing a trade in that same direction is high-risk because the probability of a reversal or a stall is much higher.
4.2. Set Realistic Targets
The ADR is excellent for setting realistic take-profit (TP) targets. For FX pairs, if the 14-day ADR is 100 pips, expecting a 200-pip move in one day is unrealistic.
However, for assets like Gold, Indices, or Stocks, you should use ADR% to set these targets. This allows you to compare volatility across different instruments regardless of their price scale. TradingView users can often find an “ADR%” filter in the stock/crypto screener to identify high-probability assets.
4.3. Standardized ADR Projection Levels
To set your levels immediately after the daily open, use the following standardized projection formulas:
- Long target (0.8 ADR): Daily Open + (ADR x 0.8)
- Short target (0.8 ADR): Daily Open – (ADR x 0.8)
Many day traders look for major resistance or supply/demand levels that align with these “projected levels” (typically 70% to 90% of the ADR) to set their final TP.
4.4. Set Smarter Stop Loss
Instead of using a fixed 20-pip stop on every trade, you can set a “smarter” stop-loss based on current volatility. A common practice is to set a stop-loss between 25-30% of the total ADR value.
Example: If the ADR is 100 pips, your SL would be 25-30 pips. This ensures your stop is placed outside of the “normal noise” of that specific asset’s typical daily movement.
4.5. Filter Low-Volatility Markets
The ADR helps you filter which markets are worth your time. If a pair’s ADR is significantly lower than its historical average (e.g., under 50 pips for a major pair), the market is likely in a tight, “sideways” range. This is a poor environment for breakout strategies, and you should consider avoiding that asset until volatility returns.
4.6. Confluence with Other Tools
The ADR works best when used in confluence (combination) with other technical indicators. If the price hits the 100% ADR level at the same time it reaches a major resistance zone, the reversal signal is significantly stronger.
Common confluence tools include:
- Support and resistance levels
- Moving Averages (EMA50, EMA200)
- Volatility tools like Bollinger Bands
5. What Are Some ADR Trading Strategies?
You can build specific Forex trading strategies around the Average Daily Range value. Most strategies focus on either the price breaking its daily price range on a strong trend day or reversing from the edge of its average limits.
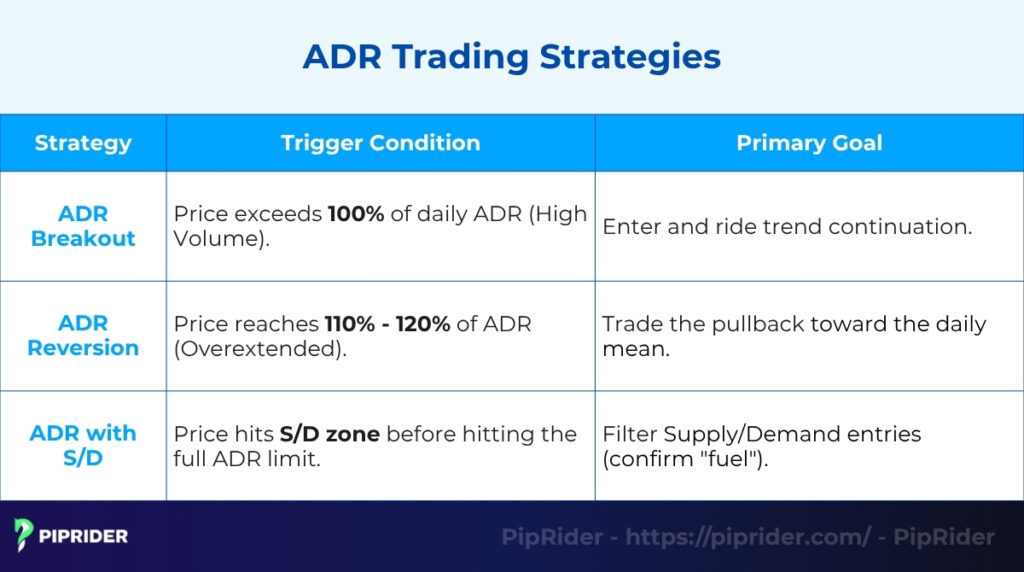
5.1. The ADR Breakout Strategy
A breakout strategy assumes the day will be a “range expansion” or a strong trend day. The entry signal occurs when the price breaks beyond 100% of the ADR range, typically during high-volatility periods like the London or New York session opens.
- Confirmation: In the Forex market, this move is best confirmed by a clear Market Structure Shift (MSS) or strong session momentum. While an increase in trading volume can be helpful, it is considered an optional factor for FX traders due to the decentralized nature of this market, where actual volume is often difficult to determine accurately (BabyPips.com, n.d.).
- SL/TP: A common setup involves setting a Take Profit (TP) at 1.2 x ADR
and a Stop-Loss (SL) at 0.5 x ADR, betting on the continuation of the trend once the daily average is breached.
5.2. The ADR Reversion Strategy
A mean-reversion strategy works on the opposite premise. It assumes the price is “overextended” and due for a pullback toward the daily mean.
- The setup: When the price stretches to 110% or 120% of the ADR, trend traders stop looking for entries in that direction as the move is likely exhausted.
- The entry: Reversion traders look for price action reversal signals, such as a pin bar, engulfing candle, or a failure to close above the ADR level to trade against the move, back toward the daily open. This is a popular approach for scalping setups.
5.3. ADR with Supply and Demand
Combining the ADR indicator with Supply and Demand zones uses the ADR as a “fuel gauge” to determine the probability of a zone holding or breaking.
- The setup: Imagine the price pulls back to a strong demand zone where you are looking to buy.
- The entry: Before entering, check the current daily progress. If the price has not yet reached its full ADR limit for the day, it signals there is still “room to move up,” making the buy trade a high-probability setup. Conversely, if price reaches a supply zone but has already moved 100% of its ADR, the likelihood of a reversal from that zone increases significantly.
6. What Tools and Indicators Calculate the ADR?
You do not need to calculate the ADR manually. Most traders use an indicator on their trading platform (like MT4, MT5, or TradingView) or a simple spreadsheet.
6.1. ADR Indicator for MT4/MT5
Since the ADR is not a default indicator in MetaTrader, you will need to find a custom ADR indicator for MT4 or MT5. These are widely available online. A high-quality indicator will automatically:
- Display multiple ADR values: Show ADR(5), ADR(10), and ADR(14) simultaneously.
- Plot projected levels: Draw the projected daily high and low levels based on the day’s open.
- Alert features: Notify you via desktop or mobile when the price hits 100% of the ADR range. This allows you to test your strategies in MT4 more effectively by observing how price reacts to these levels over time.
6.2. TradingView ADR Tools
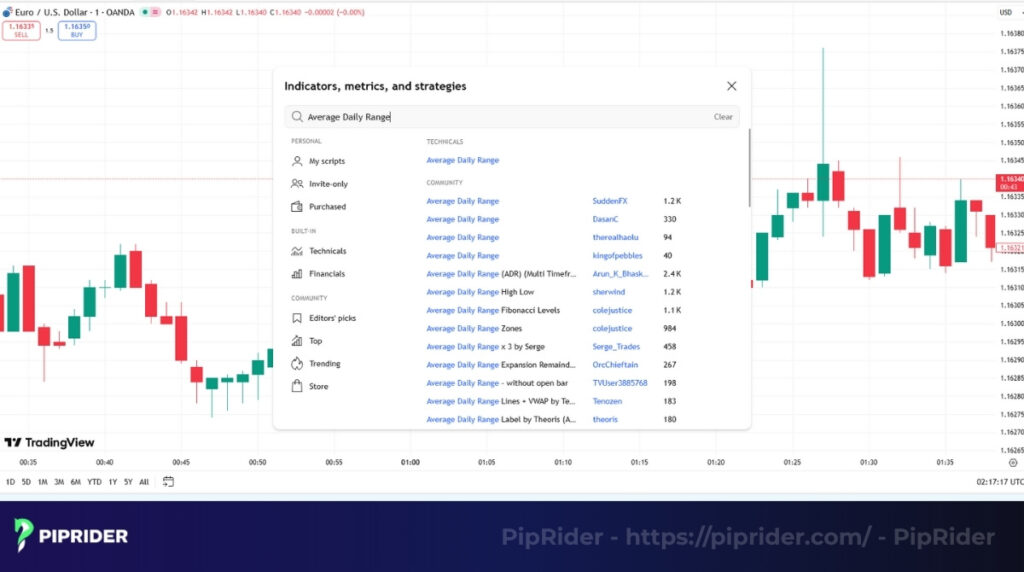
TradingView has many ADR tools available in its public “Community Scripts” library. You can search for “Average Daily Range” to find them. Many of these Pine Script indicators will overlay the ADR range directly onto your chart, showing you the projected daily high and low as colored lines.
Important: ADR formula depends on the tool. Not all ADR indicators are coded the same way. For example, some TradingView scripts might calculate the range based on the current symbol’s timeframe settings, while others specifically pull data from the Daily (D1) timeframe. Always verify if your tool calculates ADR strictly from Daily High/Low prices to ensure it is ignoring overnight gaps as intended.
6.3. Manual Calculation via Excel
If you prefer to learn how to calculate the ADR indicator manually or maintain a trading journal, you can easily do it in Excel:
- Download data: Export the daily OHLC (Open, High, Low, Close) data from your platform.
- Calculate range: Create a new column for “range” using the formula: (High – Low).
- Apply average: Use the AVERAGE(Range_Column) function over your chosen period (e.g., the last 14 cells).
7. What Is an Example of Using ADR on EUR/USD?
Here is a simplified example of how the $ADR(14)$ for EUR/USD is calculated and then applied to a trading decision. First, a trader looks at the last 14 days of data to find the daily range.
| Day | High | Low | Range (pips) |
| 1 | 1.0940 | 1.0850 | 90 |
| 2 | 1.0965 | 1.0875 | 90 |
| 3 | 1.0980 | 1.0890 | 90 |
| … | … | … | … |
| 14 | … | … | … |
| 14-Day Total | — | — | 1260 pips |
| ADR(14) | — | — | 90 pips (1260 / 14) |
The resulting ADR(14) value is 90 pips. A day trader will now use this value to manage their trades for the current session.
Example Application:
- Market context: A strong uptrend is visible on the M15 chart.
- Check ADR progress: Before placing a buy order, the trader checks how far the price has already moved today (measuring from the current daily low to the current high).
- Observation: The price has already moved 85 pips.
- Decision: Since 85 pips is extremely close to the 90-pip average, the market is statistically “overextended.” A new buy trade should be avoided because the probability of a reversal or a stall is high. This demonstrates the practical “fuel gauge” utility of the ADR indicator.
8. What Are the Common Mistakes When Using ADR?
The most common mistake is using the ADR mechanically without understanding the broader market context. Traders often confuse the ADR with other volatility tools, use incorrect timeframes, or fail to combine it with price action signals.
- Using the wrong timeframe: The Average Daily Range (ADR) measures the range for the entire day. Applying a daily 90-pip range as a target for a 1-minute “scalping” trade is inappropriate and can lead to overstaying a position that should have been closed much earlier.
- Not updating data: Market volatility is dynamic. A 90-pip ADR from a low-volatility summer month might not be accurate during a high-volatility earnings season or after major central bank news. If your data isn’t fresh, your projected levels won’t reflect the current environment.
- Confusing ADR with ATR: This is a frequent error. If your trading strategy requires accounting for overnight price gaps (common in stocks and some indices), you must use the Average True Range (ATR). Using ADR in gap-prone markets may cause you to set stop-losses that are too tight, leading to premature exits.
- Not combining with other factors: The ADR is a volatility gauge, not a complete trading system. A major mistake is relying solely on the ADR value without considering volume, market structure shifts, or session-specific volatility. It should always be used as a “confluence” tool rather than a standalone entry signal.
9. Frequently asked questions about Calculating the ADR Indicator
10. Conclusion
The Average Daily Range (ADR) is a simple but powerful tool. Learning how to calculate the ADR indicator helps a trader measure the average volatility. This metric is essential for setting logical stop-loss and take-profit levels and filtering trading signals.
Understanding the ADR means you understand the market’s “rhythm”, a vital skill for any professional trader. For maximum effectiveness, always use the ADR indicator in combination with market structure, price action, volume, and session timing.
To learn more expert trading strategies and improve your analysis, explore the free guides at Piprider.