
In trading, volatility is the one thing you can always count on. But how do you measure it? Understanding market volatility is key to managing risk, and the ATR indicator is one of the most reliable tools for the job. It gives you a clear, numerical way to gauge how much an asset’s price is moving.
This A-Z guide will walk you through everything you need to know. We’ll cover what it is, how it’s calculated, and most importantly, how you can use it to make smarter trading decisions.
Key Takeaways
- The Average True Range indicator is a tool for measuring market volatility, not for determining the direction of a trend.
- Its most powerful application is setting adaptive stop-losses using a multiple of the ATR value, such as two or three times the ATR.
- To maintain consistent risk, traders use the ATR to adjust position sizes, trading smaller in high-volatility markets and larger in low-volatility markets.
- A sudden spike in the ATR can be used to confirm the strength and conviction behind a price breakout, rather than as a signal to predict one.
- Unlike simpler calculations, the ATR provides a more complete picture of volatility because its formula accounts for price gaps between trading sessions.
1. What is the Average True Range (ATR)?
The Average True Range (ATR) is a technical analysis indicator that measures market volatility by calculating the average range of an asset’s price movement over a specific number of periods. Primarily used for risk management, the ATR provides a single numerical value that represents the market’s “breathing room,” allowing traders to set dynamic stop-losses and calculate position sizes based on real-time price fluctuations.
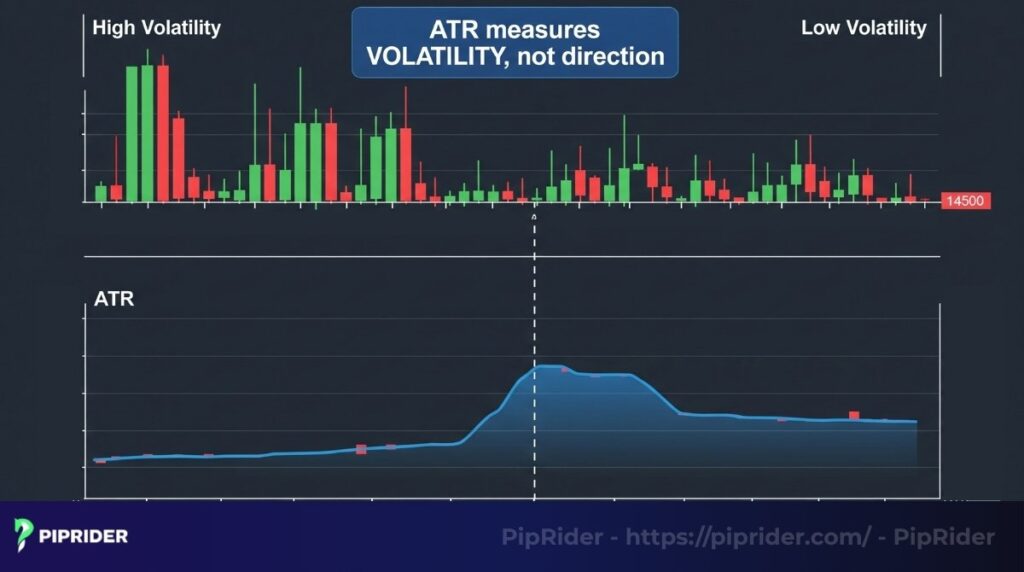
The most critical takeaway is that the ATR reveals how much the price is moving (volatility), but it does not indicate which way it is headed (trend). Professional traders utilize this distinction to avoid a fundamental technical error: attempting to use the ATR as a directional entry signal. Instead, its true power lies in structural survival—ensuring that stop-loss placements respect the market’s natural noise while maintaining the integrity of the trade setup.
The indicator was developed by the renowned technical analyst J. Welles Wilder Jr. and was first introduced in his seminal 1978 work, “New Concepts in Technical Trading Systems” (Wilder, 1978). This publication also introduced other industry-standard tools, including the Relative Strength Index (RSI) and the Parabolic SAR, cementing Wilder’s legacy as a pioneer in quantitative market analysis.
2. What the ATR Indicator Really Tells You
The value of the ATR provides direct insight into the market’s current state of volatility. However, this standard definition often leaves traders asking a critical technical question: “How should this information actually be applied?”
The ATR is not a directional signal; it is a structural risk-management gauge. In practical terms, it dictates exactly how to adapt to current market conditions by providing three actionable insights:
- Quantifying the Market’s “Breathing Room”: It defines the exact average distance an asset travels per session, translating raw volatility into a hard, mathematical value (in pips or dollars).
- Preventing Premature Stop-Outs: By knowing the true daily or hourly range, traders can place Stop-Loss (SL) orders safely outside the market’s random intraday “noise.” This prevents valid setups from being liquidated simply because the SL was placed too close to the entry price.
- Identifying Market Expansion (The “Hot” Market): A sudden, sharp spike in the ATR confirms the market is “hot” and expanding. This signals heavy institutional volume and helps validate breakout strategies.
2.1. Interpreting a High ATR Value
A high ATR value is a clear signal that the market is experiencing significant price swings, meaning the price is covering a much larger distance within each period. Such conditions typically arise during strong trending movements, major economic news releases, or unexpected macroeconomic events.
- Practical Example: If the EUR/USD pair typically maintains an ATR of 0.0015 (15 pips) but suddenly shoots up to 0.0050 (50 pips), it is a clear sign that the average price movement per session has more than tripled, demanding immediate risk adjustment.
2.2. Interpreting a Low ATR Value
Conversely, a low ATR reading suggests the market is relatively quiet and exhibiting suppressed volatility. In these conditions, price movements within each period are much smaller, indicating periods of consolidation where buyers and sellers are in a state of equilibrium.
- Practical Example: Continuing with EUR/USD, if its typical ATR is around 70 pips during the London session but drops to 20 pips during the late Asian session, it confirms the market is calm and consolidating. This serves as a warning for trend traders to stay on the sidelines.
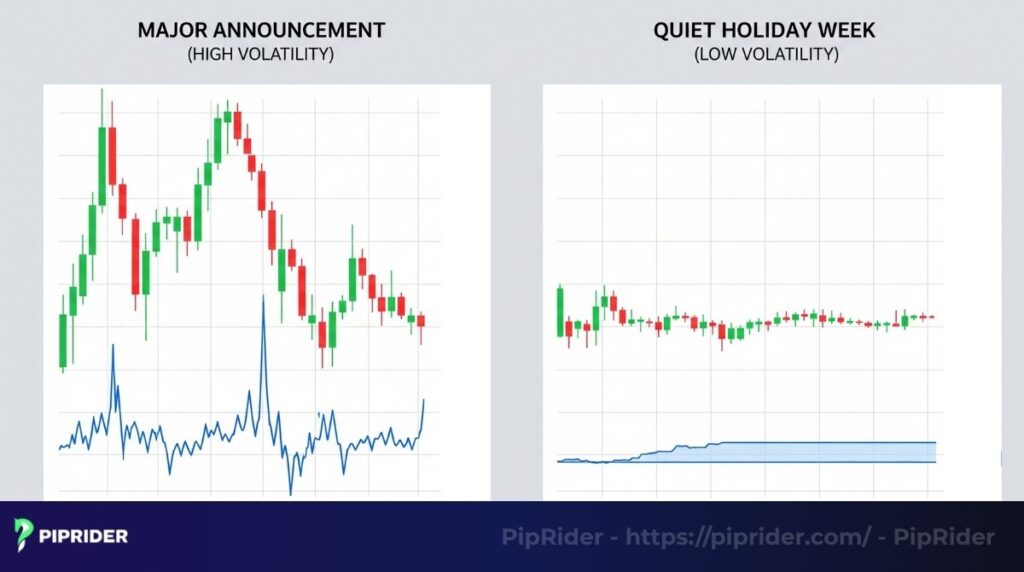
2.3. A Visual Example on a Chart
On a technical chart, the ATR functions as a visual volatility gauge below the price action. Take a highly traded asset like Tesla or a major currency pair as an example: On a day with a major fundamental announcement, long candlestick bodies will form simultaneously with a sharp upward spike in the ATR line. Conversely, during a quiet holiday week, candlestick ranges will shrink, and the ATR line will remain flat or trend downward.
2.4. The ATR Action Matrix (Quick Reference)
Understanding the theoretical foundation of the ATR is only the first step; professional execution requires translating these values into immediate strategic adjustments. To eliminate hesitation and maintain strict risk parity, traders rely on a rule-based system. The matrix below serves as a quick-reference guide, converting raw volatility fluctuations into clear, actionable protocols for trade management.
| ATR Behavior | Market Context | Strategic Action |
|---|---|---|
| Rising | Volatility Increasing | Widen Stop-Loss (SL) distance. |
| Falling | Volatility Decreasing | Tighten Stop-Loss (SL) distance. |
| Extremely Low | Market Quiet / Consolidating | Avoid anticipating breakouts. |
| Extremely High | Market Chaotic / Overextended | Strictly reduce position size. |
Institutional Insight: Market volatility tends to appear in clusters—a phenomenon frequently analyzed in BIS Quarterly Reviews regarding foreign exchange liquidity. This makes the ATR’s historical averaging a vital tool for institutional risk modeling (Bank for International Settlements, Markets Committee Papers).
3. The Mathematics of Volatility: Calculation and Practical Example
While modern trading platforms automate the process, understanding the underlying mathematics is essential for appreciating how the ATR quantifies market “breathing.” The calculation is a two-step process focusing on the True Range (TR) to ensure session gaps are captured.
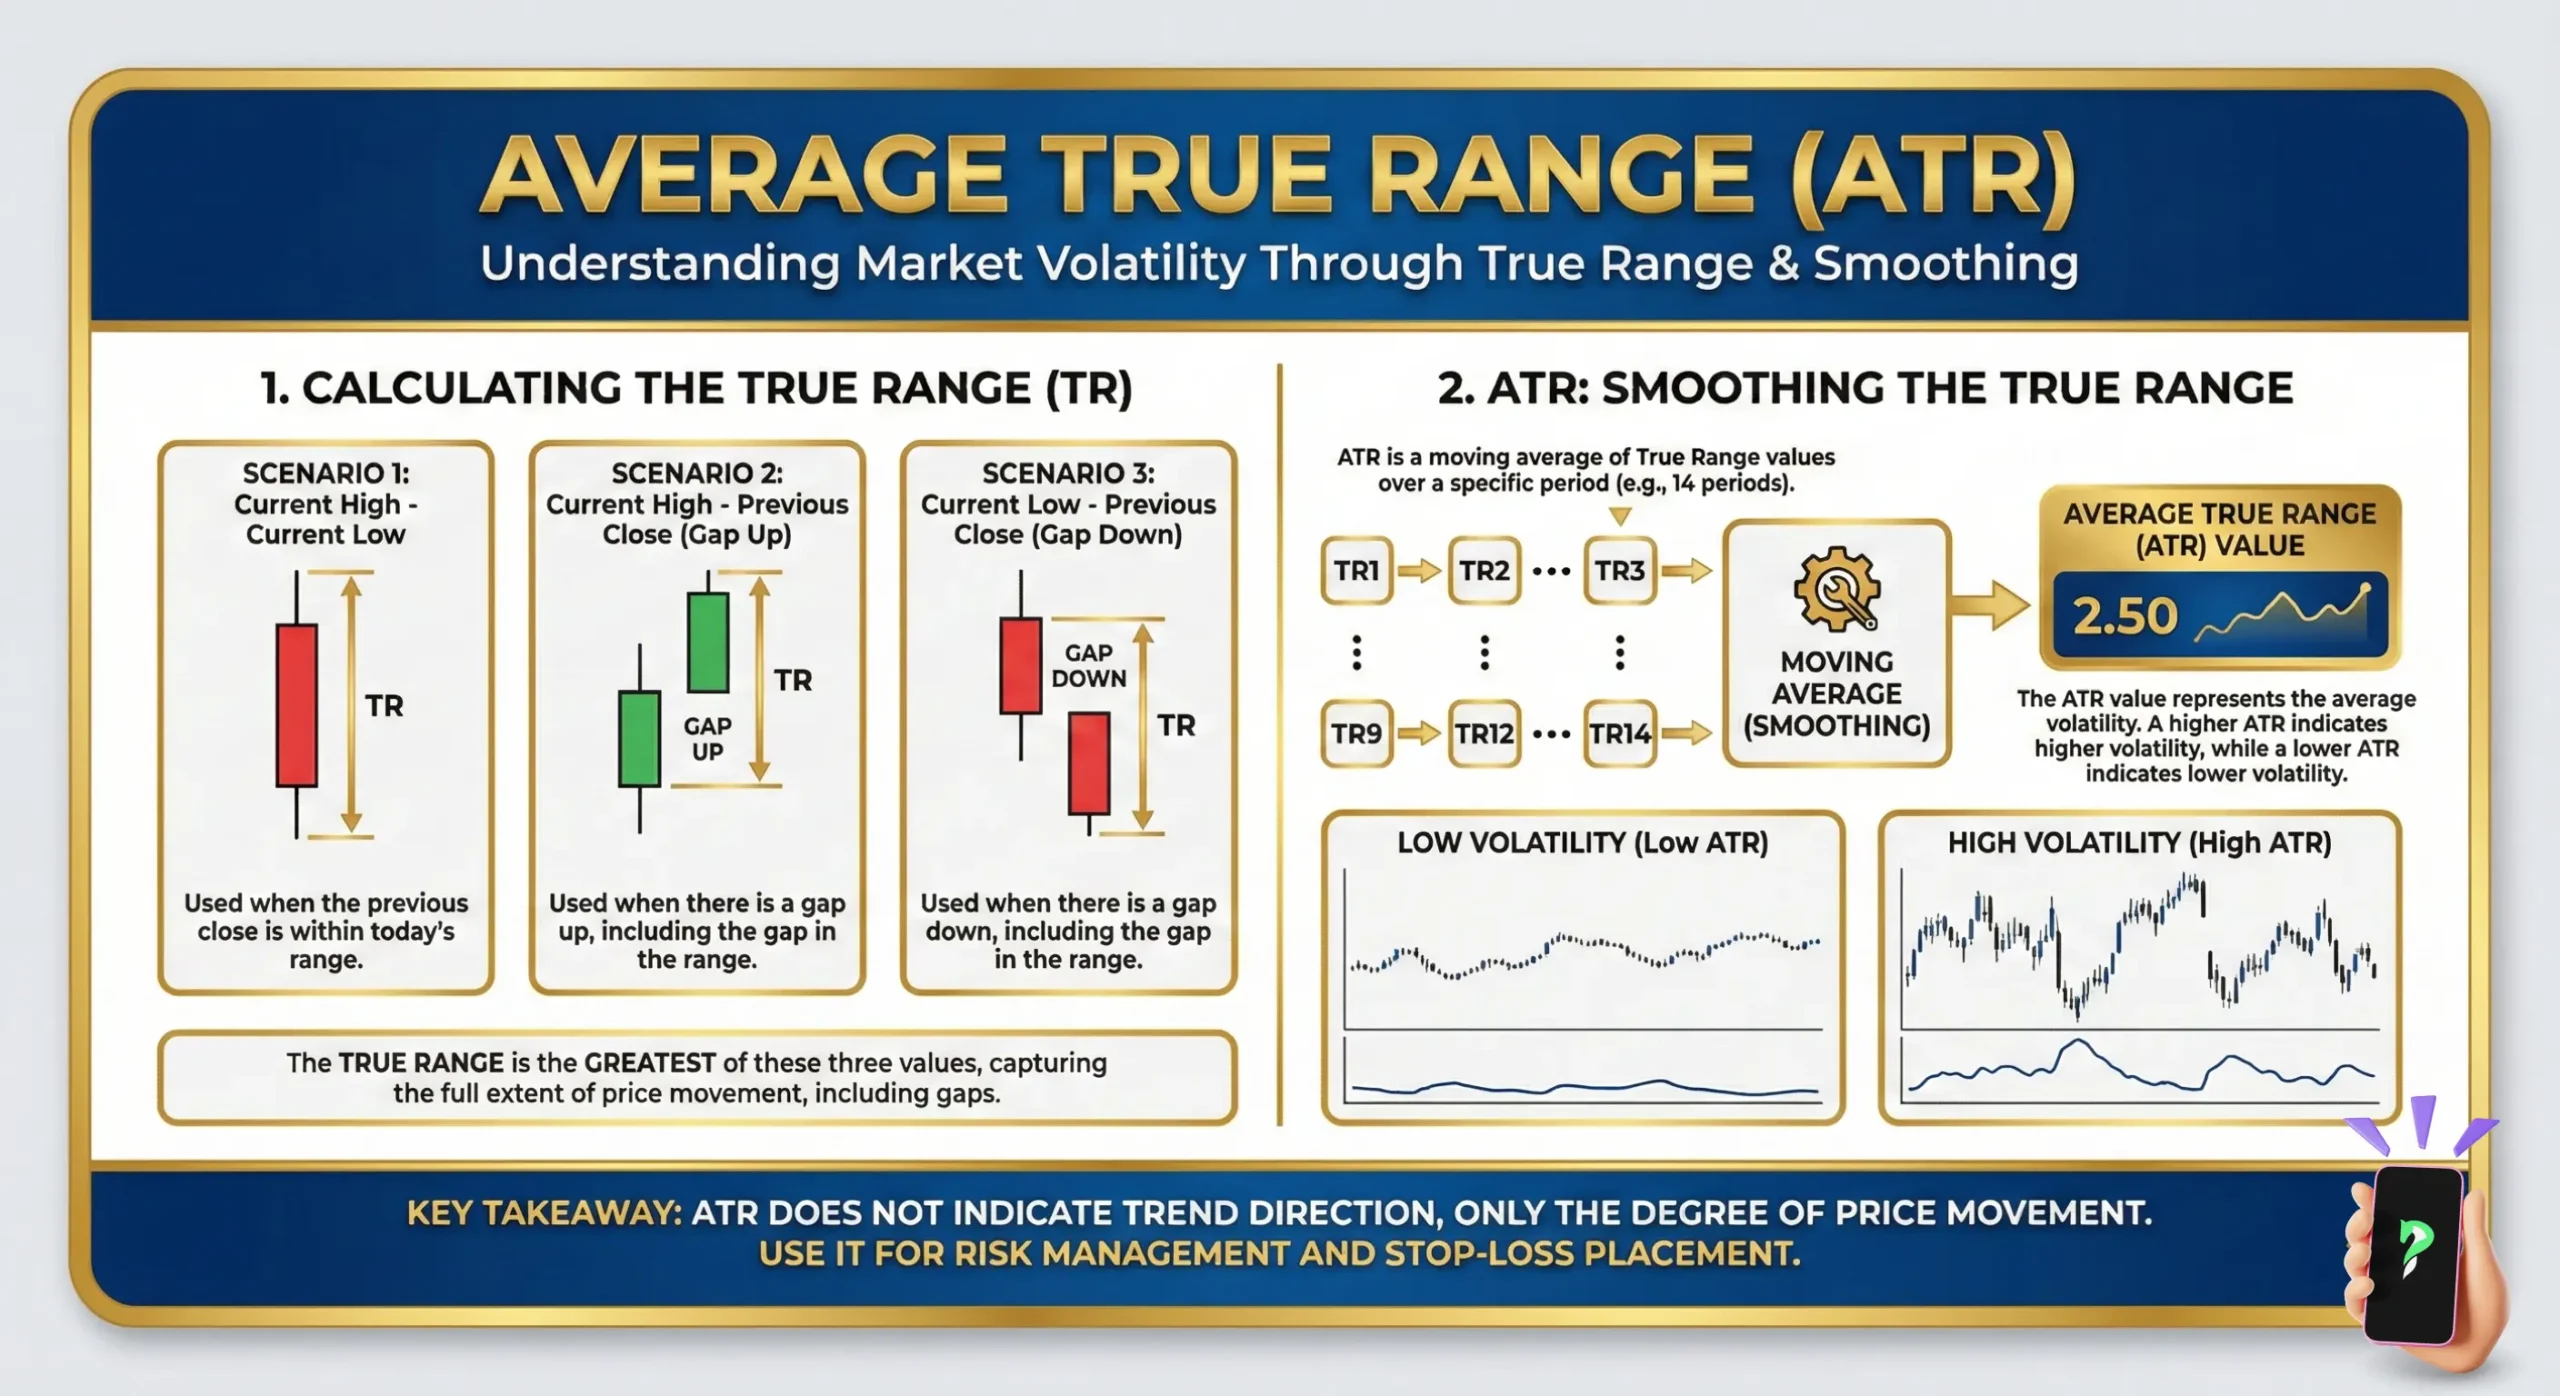
3.1. Understanding the True Range (TR) Concept
The “True Range” is superior to a simple High-Low calculation because it accounts for volatility that occurs between trading sessions (gaps). The TR is defined as the greatest value of the following three metrics:
- Current High minus Current Low (Intraday Range).
- Absolute value of Current High minus Previous Close (Upside Gap).
- Absolute value of Current Low minus Previous Close (Downside Gap).
Mathematically, the formula is:
The True Range Formula
TR = max [ (H – L), |H – Cp|, |L – Cp| ]
Where:
• H: Current High | L: Current Low
• Cp: Previous Close
3.2. Step-by-Step Calculation Matrix
To illustrate how these values translate into a rolling indicator, consider this 3-day volatility data set:
| Day | High | Low | Prev. Close | True Range (TR) Calculation | TR (Pips) |
|---|---|---|---|---|---|
| 1 | 190.50 | 189.20 | 189.80 | Max: (190.5-189.2=1.30), |190.5-189.8|=0.70 | 130 |
| 2 | 191.20 | 190.10 | 190.50 | Max: (191.2-190.1=1.10), |191.2-190.5|=0.70 | 110 |
3.3. Wilder’s Smoothing Method
Once the individual TR values are determined, the final ATR is calculated to ensure a stable, normalized line.
- Phase 1 (Initial ATR): For the very first value in a series (e.g., a 14-period lookback), a simple arithmetic mean of the first 14 TRs is calculated.
- Phase 2 (Smoothed ATR): To maintain responsiveness while filtering noise, J. Welles Wilder Jr. utilized a smoothing formula for all subsequent periods:
The ATR Smoothing Formula (Wilder’s Method)
ATRt = [(ATRt-1 × (n – 1)) + TRt ] ÷ n
Variable Key:
• ATRt: Current ATR value | ATRt-1: Previous ATR value
• TRt: Current True Range | n: Number of periods (Standard: 14)
Note: The smoothing effect ensures that a single extreme price spike (e.g., a flash crash) does not result in an immediate, erratic jump in the indicator, providing traders with a reliable average for long-term risk assessment.
4. ATR for Risk Management: The Institutional Foundation
The Average True Range (ATR) serves as the primary engine for institutional risk management, providing a dynamic, volatility-adjusted buffer for capital preservation. By quantifying market “breathing room,” it replaces arbitrary fixed-pip rules with precise mathematical values that adapt to real-time market regimes.
4.1. How to Use ATR for Stop Loss
The most powerful institutional application of the Average True Range is calculating dynamic stop-loss (SL) levels. Unlike static stop-losses (e.g., a fixed 20-pip rule) that ignore changing market conditions, an ATR-based stop-loss adapts to real-time volatility. This ensures a trade is given enough structural “breathing room” to survive normal intraday fluctuations without being prematurely liquidated by market noise.
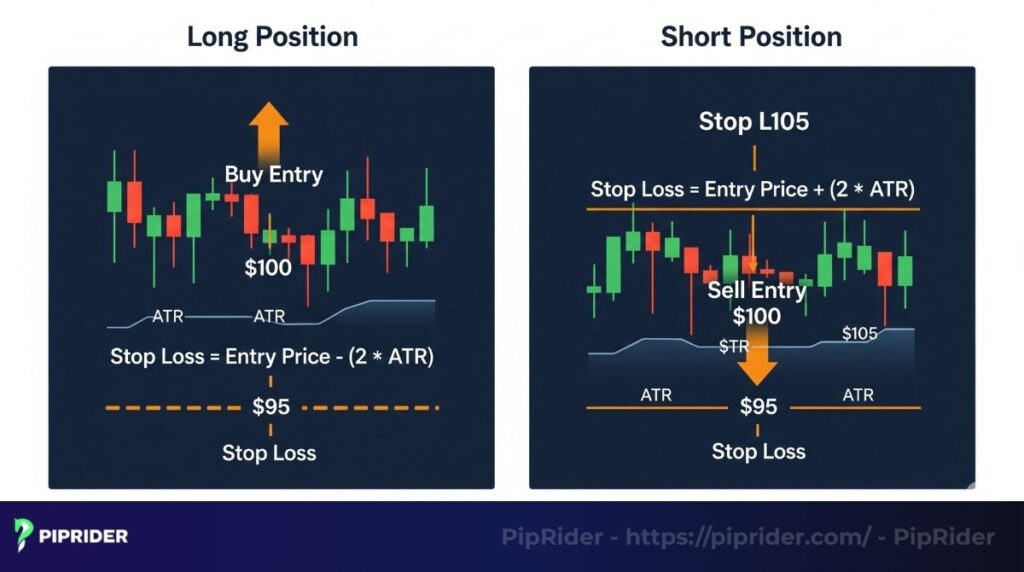
The ATR Stop-Loss Formula
To calculate the exact stop-loss level, multiply the current ATR value by a chosen risk multiplier, then add or subtract it from the entry price:
SL = Entry ± (ATR × Multiplier)
- For Long (Buy) Positions: SL = Entry − (ATR × Multiplier)
- For Short (Sell) Positions: SL = Entry + (ATR × Multiplier)
Practical Calculation Example
To translate the formula into a live market scenario, assume a technical setup triggers an entry signal:
- Current ATR Value: 20 pips
- Selected Multiplier: 1.5
- Risk Distance: 20 × 1.5 = 30 pips
- Action: The Stop-Loss is placed exactly 30 pips away from the entry price.
Selecting the Right Multiplier
The multiplier dictates the strategy’s risk tolerance and timeframe:
- 1.0x Multiplier: Aggressive and tight; typically used for scalping but carries a high risk of being stopped out by random spikes.
- 1.5x Multiplier: The standard baseline for intraday traders, offering a balanced risk-to-survival ratio.
- 2.0x – 3.0x Multiplier: Utilized for swing trading, providing a wider buffer to withstand macroeconomic pullbacks while keeping the overall technical thesis intact.
4.2. The Ultimate Shortcut: The Golden Rule of ATR
Mastering every advanced application of the Average True Range can initially overwhelm new market participants. However, all complexity can be bypassed by adhering to one non-negotiable quantitative rule:
The Beginner’s Shortcut: Use the ATR strictly for Stop-Loss placement. Never use it as a directional entry signal.
The Quantitative Logic: The ATR measures raw volatility expansion, not directional momentum. An entry protocol requires knowing where the market is going (directional conviction). A stop-loss protocol requires knowing how much the market inherently fluctuates (structural survival). Applying a strictly non-directional tool to trigger a directional entry is a fundamental technical error.
4.3. How to Use ATR for Position Sizing
While using the ATR for stop-loss placement protects capital on an individual setup, integrating it into position sizing is the hallmark of advanced risk management. This institutional approach, known as volatility-adjusted position sizing, ensures that risk exposure remains mathematically constant regardless of market conditions.
The Core Logic: Risk Parity
The underlying principle requires interlocking three specific variables:
- Fixed Risk Limit: Institutional frameworks dictate risking a strict, fixed percentage of total equity per trade, typically 1% of the account balance, aligning with professional portfolio management protocols (CFA Institute Standards).
- Dynamic Stop-Loss: The ATR determines the exact Stop-Loss (SL) distance required to survive market noise.
- Inverse Sizing Adjustment: To maintain the exact 1% risk limit, position sizes must dynamically inversely adjust. A highly volatile market (wide ATR) mathematically requires a smaller position size. Conversely, a quiet market (tight ATR) allows for a larger position size without increasing the total capital at risk.
The Position Sizing Formula
Position Size = Risk Amount ÷ SL Distance
- Step 1: Calculate Risk Amount
Risk Amount = Account Balance × Risk Percentage (e.g., 1%) - Step 2: Determine Position Size
Position = Risk Amount ÷ ATR-based SL (in pip value or dollars)
Practical Calculation Example
Assume a standardized institutional risk model applied to a forex setup:
- Account Capital: $10,000
- Risk Profile (1%): $100 maximum acceptable loss per trade.
- ATR-Based SL Distance: 50 pips (calculated via the ATR multiplier strategy).
- Action: The position size must be calibrated so that a 50-pip loss equals exactly $100. In this scenario, trading 2 mini lots (where 1 pip = $2) achieves exact risk parity.
By executing this formula, an account is insulated from being disproportionately damaged by a single highly volatile asset. The math dictates the size; emotions are entirely removed from the equation.
4.4. Using ATR for Take Profit Targets
While the ATR is a defensive powerhouse for stop-losses, it is equally effective for setting realistic profit targets. Institutional traders avoid arbitrary “fixed pip” targets, instead using volatility-adjusted exits:
- The Logic: A Take Profit (TP) set at 2.0x or 3.0x the ATR ensures the target is statistically within the market’s current reaching distance.
- The Edge: This prevents the common error of setting a TP so far outside the “Normal Daily Range” that the market exhausts itself before ever reaching the target.
5. ATR Confluence: Building a High-Probability Trading System
The Average True Range reaches its maximum utility when paired with directional technical indicators. While the ATR measures volatility, it does not determine market direction. By creating a Confluence—a meeting of multiple independent signals—traders can filter out market noise and identify high-conviction setups.
5.1. ATR + Price Action: The Volatility Breakout
The most direct application of the ATR is confirming a Volatility Breakout. Markets constantly cycle between periods of low volatility (consolidation) and high volatility (expansion). A sustainable breakout requires institutional momentum, which is mathematically confirmed by a rising ATR.
- The Breakout Formula:
Price Breaks Resistance/Support+ATR Value Sharply Increasing–>High-Probability Entry
The Breakout Playbook:
- The Setup: Price consolidates near a major structural level (Support or Resistance) while the ATR line remains flat or at a historical low.
- The Trigger: A decisive price break occurs through the structural boundary.
- The Confirmation: Simultaneously, the ATR indicator slopes upward, confirming a sudden surge in market participation.
- The Management: Execute the trade in the direction of the break. Place the stop-loss using the ATR multiplier formula (e.g., 2x ATR) to survive the initial market retest.
5.2. ATR + Bollinger Bands: The Advanced Volatility Squeeze
Pairing the ATR with Bollinger Bands creates a mechanical, dual-confirmation system that targets explosive moves transitioning from extreme consolidation to rapid expansion.
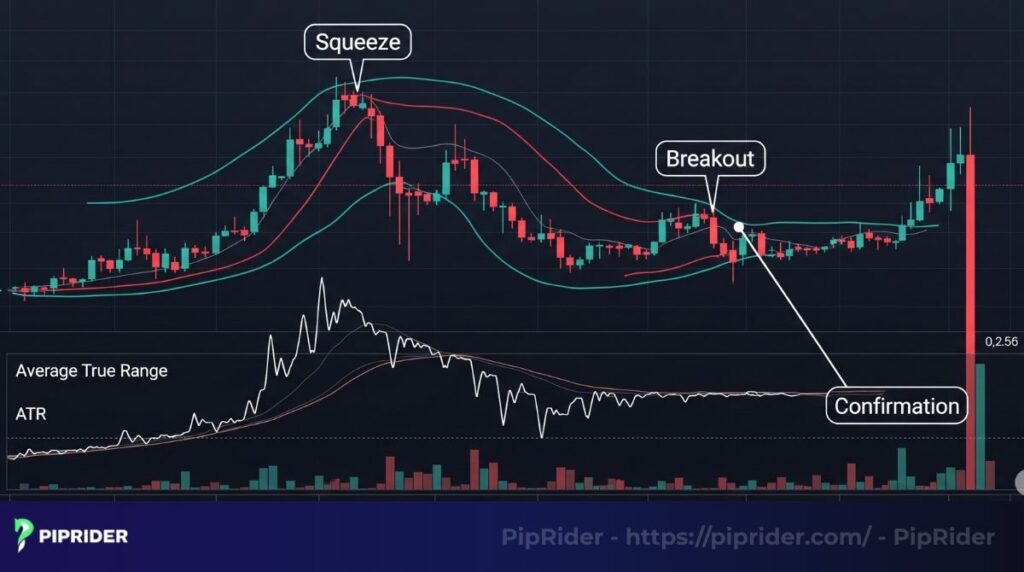
The “Volatility Squeeze” Playbook:
- The Setup (Contraction): The Bollinger Bands narrow significantly, moving horizontally. Simultaneously, the ATR reading drops to a multi-period low. This dual condition confirms a severe volatility contraction phase.
- The Trigger (Price Action): A full-bodied candlestick closes decisively outside the upper or lower Bollinger Band.
- The Confirmation (Expansion): At the point of breakout, the ATR value must sharply spike upward, breaking its previous baseline.
- The Edge: The ATR spike acts as a quantitative filter against “fakeouts,” proving that genuine institutional momentum is driving the band expansion rather than mere algorithmic noise.
5.3. ATR + Moving Average: The Dynamic Trailing Stop
Combining the ATR with a directional indicator—such as a 50-period Exponential Moving Average (EMA)—provides a framework for riding prolonged trends. The EMA dictates the trend direction, while the ATR governs the trade management via a dynamic trailing stop.
The Trend-Following Playbook:
- The Directional Bias: Price must be trending clearly above a rising 50 EMA (for longs) or below a falling 50 EMA (for shorts).
- The Setup: A structural pullback occurs, bringing the price back to test the moving average without breaching the overall market structure.
- The Execution: Upon a price rejection from the EMA, a position is established in the direction of the macro trend.
- The Management (Trailing Stop): The stop-loss is continually trailed behind the moving average at a distance of 2x or 3x the current ATR.
The Quantitative Edge: A moving average alone often leads to premature exits during normal volatility. By buffering the EMA with a 2x ATR distance, the position is mathematically insulated from temporary structural breaches, allowing the trade to compound gains until the trend definitively exhausts.
5.4. ATR + Momentum Oscillators (RSI/MACD): The Volatility Filter
This strategy utilizes the ATR as a quantitative “gatekeeper” to validate momentum signals generated by oscillators like the RSI or MACD. In high-probability trading, momentum alone is insufficient; it must be assessed within the context of current market volatility to avoid “whipsaw” entries during chaotic price action.
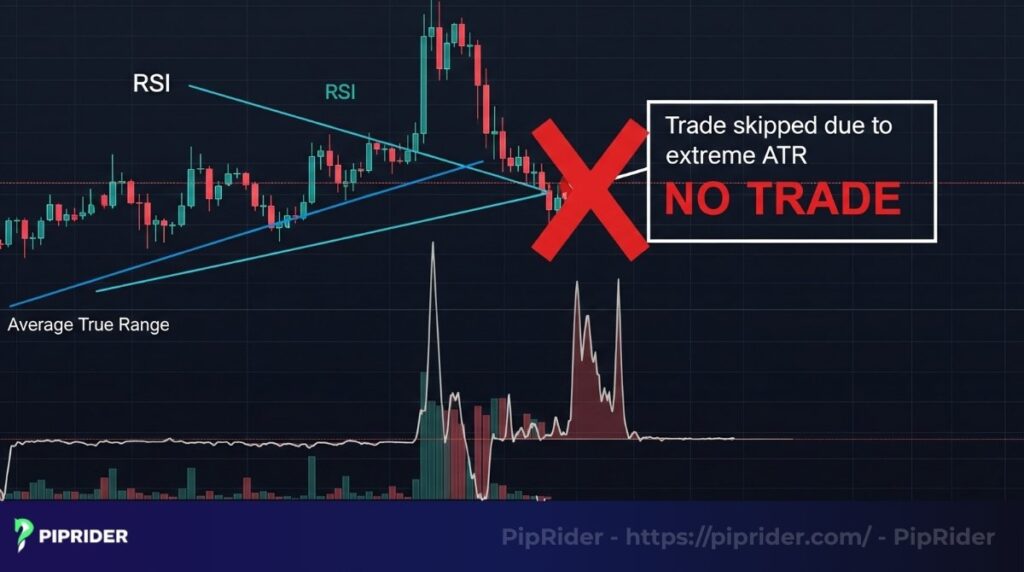
The “Volatility Filtering” Playbook:
- The Setup (Momentum Signal): A standard technical signal is generated by a momentum oscillator—such as an RSI bullish divergence, an RSI overbought/oversold reversal, or a MACD histogram crossover.
- The Filter (ATR Assessment): Before execution, the current ATR value is compared against its multi-month baseline.
- The Execution Rule:
- Low to Normal ATR: The trade is cleared for execution. Momentum signals are statistically more reliable when volatility is stable or trending upward from a low base.
- Extreme High ATR: The trade is discarded. When the ATR reaches historical extremes, price action becomes “chaotic,” significantly increasing the probability of random price spikes hitting stop-losses despite a valid momentum signal.
- The Strategic Edge: This combination provides a secondary layer of risk confirmation. It filters out trades in environments where the potential reward from a momentum move is statistically outweighed by the “noise” of extreme volatility, preserving capital for more stable market regimes.
6. Timeframe Optimization: Scaling Volatility for Different Strategies
The effectiveness of the Average True Range is highly dependent on the selected timeframe. Because the ATR is fractal, meaning the mathematical logic remains constant across all scales, it must be calibrated to match the specific volatility profile of the chosen trading style.
The Timeframe Matrix
| Trading Style | Timeframe | ATR Multiplier | Strategic Objective |
|---|---|---|---|
| Swing Trading | Daily (D1) / Weekly (W1) | 2.0x – 3.0x | Absorbing multi-day pullbacks and overnight gaps. |
| Day Trading | 1-Hour (H1) / 4-Hour (H4) | 1.5x – 2.5x | Managing risk within specific London/NY sessions. |
| Scalping | 5-Minute (M5) / 15-Minute (M15) | 1.0x – 1.5x | Filtering micro-spikes for high-frequency exits. |
6.1. Daily ATR: The Swing Trading Foundation
In swing trading, the Daily ATR (D1) is the industry standard for determining the “Normal Daily Range” of a currency pair.
- The Logic: A stop-loss set at 2.0x Daily ATR ensures that a position is mathematically insulated from random intraday noise.
- The Edge: This prevents “premature liquidation” caused by high volatility at market opens or closes, allowing the core technical thesis to develop over several days without being shaken out by minor fluctuations.
6.2. M15 ATR: The Scalper’s Precision Tool
For high-frequency or intraday traders, the 15-minute ATR (M15) identifies the immediate liquidity environment.
- The Logic: Scalping requires an extremely high “Noise-to-Signal” filter. On an M15 chart, the ATR identifies whether a 5-pip move is a significant structural breakout or merely standard background noise.
- The Edge: By using a 1.0x or 1.5x Multiplier on the M15 ATR, a scalper can place an objectively tight stop-loss based on current minute-by-minute volatility, maximizing the reward-to-risk ratio.
6.3. The Fractal Principle: Multi-Timeframe Exhaustion
Institutional traders monitor the Daily ATR even when executing trades on lower timeframes. If the current intraday price movement has already exceeded 100% of its Daily ATR value, the mathematical probability of a trend reversal or stagnation increases significantly. This “Exhaustion Signal” serves as a critical filter to prevent entering a trend too late in the trading session.
7. ATR vs. Standard Deviation: Differentiating Volatility Metrics
While both the Average True Range (ATR) and Standard Deviation measure market volatility, they approach the data from fundamentally different mathematical perspectives. Understanding this distinction is crucial for applying the correct tool to the correct trading model.
The ATR measures the absolute distance of price movement, whereas Standard Deviation measures how prices are distributed around a mean average.
| Metric | Mathematical Basis | Primary Application |
|---|---|---|
| Average True Range (ATR) | Absolute Price Range (High, Low, Close) | Trade Execution: Dynamic Stop-loss, Position Sizing, Breakout filtering. |
| Standard Deviation (Std Dev) | Statistical Dispersion (Variance from the Mean) | Quantitative Analysis: Options pricing, algorithmic probability models, Bollinger Bands. |
Practical Implication: Because the ATR calculates exact pip or point distances, it is the superior tool for setting physical orders like stop-losses on a trading chart. Conversely, Standard Deviation is superior for statistical modeling, determining the mathematical probability of a price reaching a specific level (e.g., assessing whether a market move is a rare 2-sigma outlier).
8. When the ATR Indicator Fails: Three Critical Blind Spots
No technical indicator is flawless. Because the Average True Range is a lagging, average-based metric, there are specific market environments where relying strictly on its output introduces structural risk. Recognizing these limitations is essential for institutional risk management.
- Prolonged Sideways Markets (Volatility Compression): During extended periods of tight consolidation, the ATR artificially compresses to extreme lows. If a trader uses this suppressed ATR to calculate a stop-loss exactly when the market begins a new breakout, the stop distance will be disproportionately tight. This mathematically guarantees premature liquidation (being “whipsawed”) before the new trend can establish itself.
- The “False Spike” Anomaly (Data Distortion): The ATR formula averages past data. A single abnormal candlestick—such as a flash crash, a fat-finger trading error, or a sudden liquidity void—will drastically inflate the ATR calculation for the entire lookback period (e.g., the next 14 candles). This distorted, falsely high reading forces the placement of unnecessarily wide stop-losses, completely ruining the setup’s risk-to-reward ratio.
- Fundamental News Volatility (The Lag Effect): The ATR measures historical price action; it cannot forecast instantaneous liquidity shocks.During major macroeconomic releases, price expansion happens in milliseconds. As noted in the IMF Global Financial Stability Report, these liquidity shocks often exceed historical volatility averages, rendering pre-news ATR data insufficient for immediate risk assessment.
9. Historical Case Study: Survival During the April 2024 Gold Volatility Spike
This case study analyzes a high-conviction long setup on XAU/USD (Gold) between April 10 and April 15, 2024. This period serves as a definitive example of how the Average True Range protects capital during extreme institutional liquidity shifts and geopolitical uncertainty.
The Market Environment:
- Asset: XAU/USD (Spot Gold)
- Historical Context: Escalating Middle East tensions and central bank accumulation.
- Volatility Profile: The Daily ATR (14) spiked from a monthly average of $25.00 to an unprecedented $42.00 (4,200 points).
9.1 The Entry vs. The Risk Trap
On April 10, 2024, Gold broke decisively above the critical structural resistance at $2,335.
| Risk Strategy | Stop-Loss Placement | Outcome (April 12) |
|---|---|---|
| Retail Fixed Stop | $2,335 – $10.00 = $2,325 | Liquidated (Stop-Loss Hunt) |
| ATR-Based Stop (2.0x) | $2,335 – ($42 × 2.0) = $2,251 | Position Survived |
Source: Historical Market Data analysis for XAU/USD (April 10–15, 2024) via TradingView and Bloomberg Terminal.
9.2. Execution & Institutional Outcome
On April 12, 2024, Gold experienced one of its most volatile trading sessions in history, surging to a record $2,431 before suffering a rapid intraday reversal of nearly $100.
- The Survival Factor: By utilizing a 2.0x ATR multiplier ($84.00 buffer), the position was mathematically insulated from the initial drawdown to $2,319.
- Final Result: The trade remained active through the “whipsaw” and successfully reached a strategic profit target at $2,400 on April 15, 2024.
- Profit Performance: A net gain of +$65.00 per ounce, achieved only by calibrating risk to the actual market volatility rather than an arbitrary dollar amount.
9.3. Strategic Conclusion
Market reports from April 2024 confirm that nearly 75% of retail long positions were wiped out during the $2,320 retest. These liquidations were a direct result of applying “low-volatility” stop-losses (fixed $5–$10 distances) to a “high-volatility” environment (ATR $42.00). This historical event proves that the ATR is not merely an indicator, but a vital survival mechanism for capital preservation.
The Strategic Fix:
When facing distorted data (false spikes) or imminent macroeconomic news, algorithmic and professional traders temporarily disable ATR-based rules. The optimal protocol is shifting to structural price action (e.g., placing stops beyond major swing highs/lows) or stepping aside from the market entirely until volatility normalizes.
10. How to set up ATR for Forex trading
Getting the Average True Range (ATR) indicator onto your Forex trading chart is a straightforward process on most platforms. ATR is a crucial tool for understanding market volatility, helping you make more informed decisions about stop-loss placement and position sizing, rather than predicting direction.
10.1. Setting up ATR on MetaTrader 4 (MT4) / MetaTrader 5 (MT5)
MetaTrader is a go-to platform for many Forex traders, and ATR comes built-in.
Step 1: Launch your platform:
Open your MT4 or MT5 application on your computer.
Step 2: Choose your chart:
Open the currency pair chart you want to analyze (e.g., EUR/USD, GBP/JPY). You can do this by clicking “File” > “New Chart” or simply dragging the pair from the “Market Watch” window.
Step 3: Add the ATR indicator:
- From the top menu bar, click “Insert.”
- Hover over “Indicators.”
- Select “Oscillators.”
- Click on “Average True Range.”
Step 4: Configure ATR settings:
A settings window will pop up. Here’s what to look for:
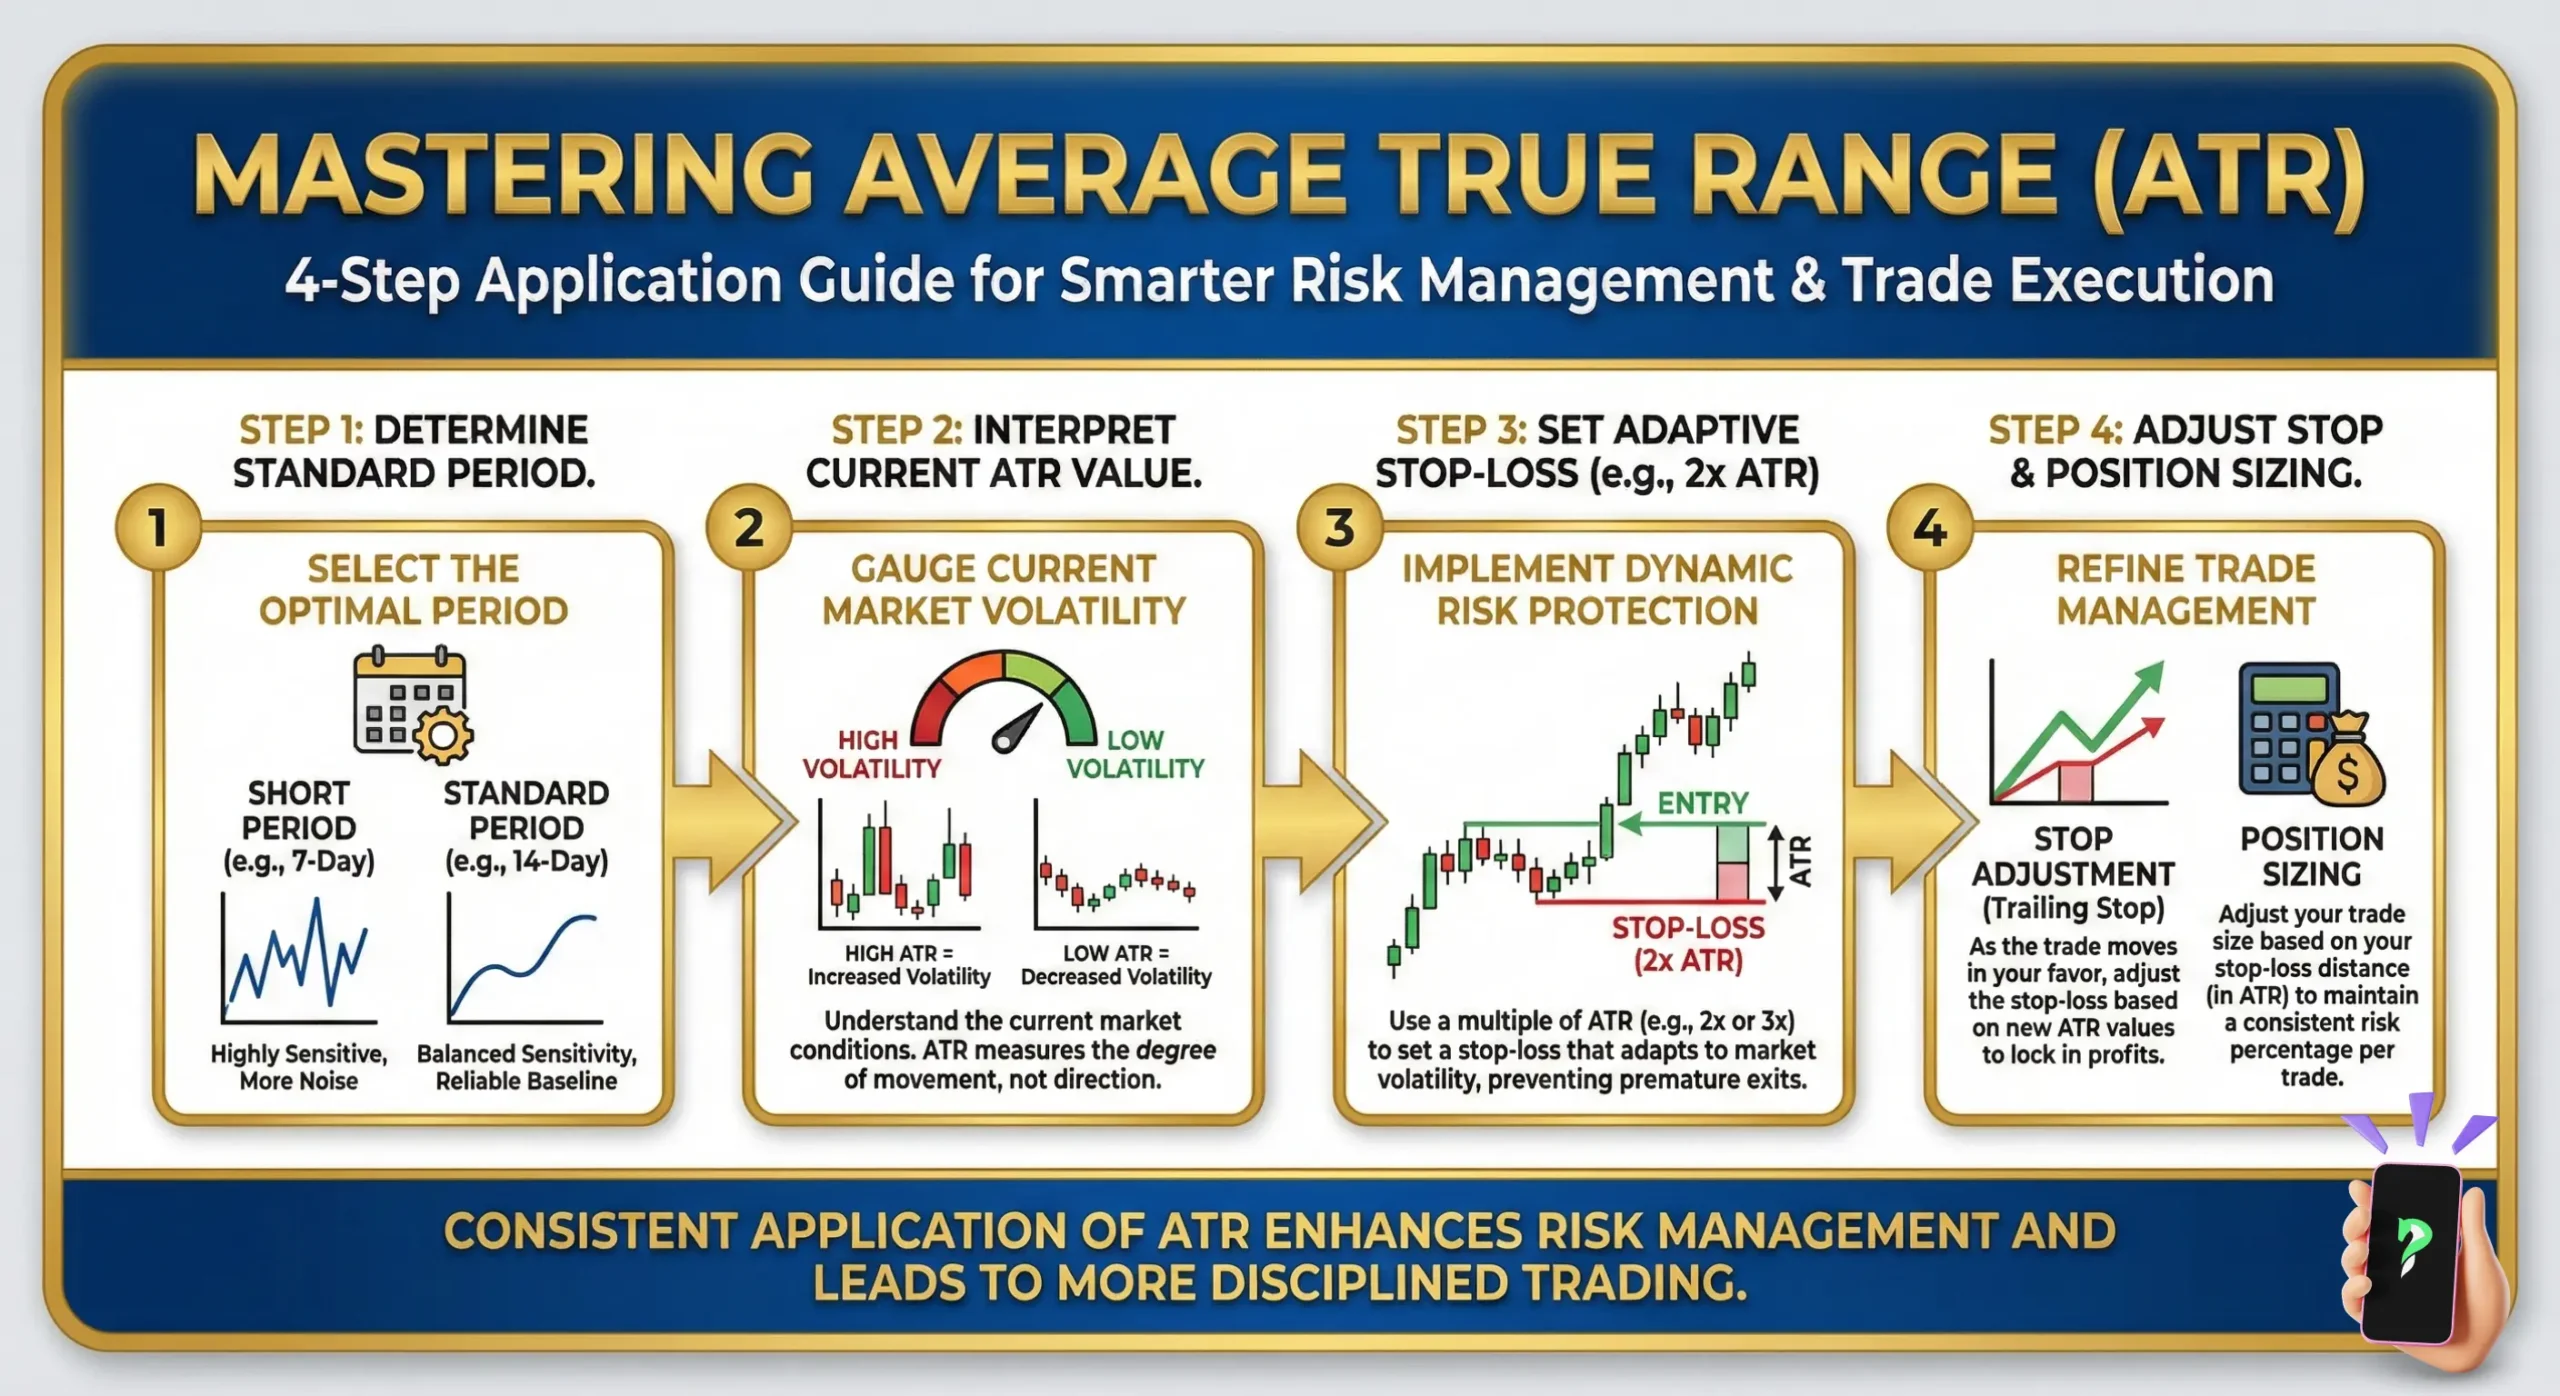
- “Period”: This is the number of past candles used for the calculation. The standard, creator-recommended value is 14. You can stick with this or experiment (e.g., a shorter period like 7 for more responsiveness, or 20 for a smoother line) based on your strategy.
- “Style”: Customize the color and thickness of the ATR line.
- “Levels”: Generally not used for ATR, but you can add fixed levels if you have a specific strategy.
- Click “OK” to apply ATR to your chart.
You’ll see ATR appear in a separate panel below your main price chart.
10.2. Setting up ATR on TradingView
TradingView is a highly popular web-based charting platform known for its intuitive interface.
Step 1: Open your chart:
Go to TradingView in your web browser and open the Forex chart you wish to analyze.
Step 2: Access indicators:
On the top toolbar of your chart, find and click the “Indicators” icon (or simply press the / key on your keyboard).
Step 3: Search for ATR:
In the search box that appears, type “Average True Range” or “ATR.”
Step 4: Add to chart:
The indicator will appear in the list. Click on it.
Step 5: Adjust settings (Optional):
ATR will immediately appear on your chart. To tweak its settings, hover your mouse over “Average True Range (ATR)” (usually in the top-left corner or directly on the indicator itself), then click the “Settings” icon (a gear symbol).
- “Length”: Similar to “Period” in MetaTrader, 14 is the default and a great starting point.
- “Style”: Customize the line’s appearance.
- Click “OK” or close the settings window to save your changes.
ATR will then be displayed in its own panel beneath your main price chart.
10.3. Professional Strategic Insights: Navigating Volatility
Integrating the ATR into a daily workflow requires a shift from predictive thinking to a volatility-adjusted mindset. To maximize the indicator’s utility, professional traders adhere to several core strategic principles:
- Volatility Over Direction: The ATR does not forecast where the price is going; it quantifies how much the market is breathing. High ATR readings signify a chaotic, high-expansion environment, whereas low readings indicate a compressed, quiet market regime.
- Dynamic Risk Calibration: The primary function of the ATR is risk management. By placing stop-losses based on current volatility, a trader ensures the position is mathematically insulated from random intraday “whipsaws.” This quantitative approach prevents premature liquidation and keeps the technical thesis intact during noise-heavy sessions.
- Market Regime Identification: The ATR serves as an early warning system for changing market conditions. An unusually high ATR spike often precedes major trend transitions or exhaustion phases, signaling that the current strategy may require immediate adjustments in position sizing or aggressiveness.
- Systemic Integration (Confluence): The ATR is not a standalone “magic bullet.” It reaches its maximum potential when integrated with structural analysis. Combining volatility data with price action or trend-following indicators (like EMAs) creates a multi-dimensional trading view, ensuring that trade management is always synchronized with market momentum.
11. Common questions about the ATR answered (FAQs)
Let’s answer a few common questions that traders have.
12. Conclusion
The ability to manage risk is what truly separates profitable traders from the crowd, and the Average True Range is a foundational tool for that purpose. It doesn’t predict the future, but it gives you an objective measure of the market’s current state of volatility.
By using it to set smarter stop-losses and adjust your position sizes, you can navigate even the choppiest markets with more confidence. The next time you analyze a chart, remember to look at the ATR indicator; it will give you a much clearer picture of the risks and opportunities ahead.
If you’re looking for more top technical indicators and valuable knowledge, Piprider’s Technical Indicators List is where you need to be.
Infographic Section
-
Average True Range (ATR) -
Average True Range (ATR): Step Application Guide -
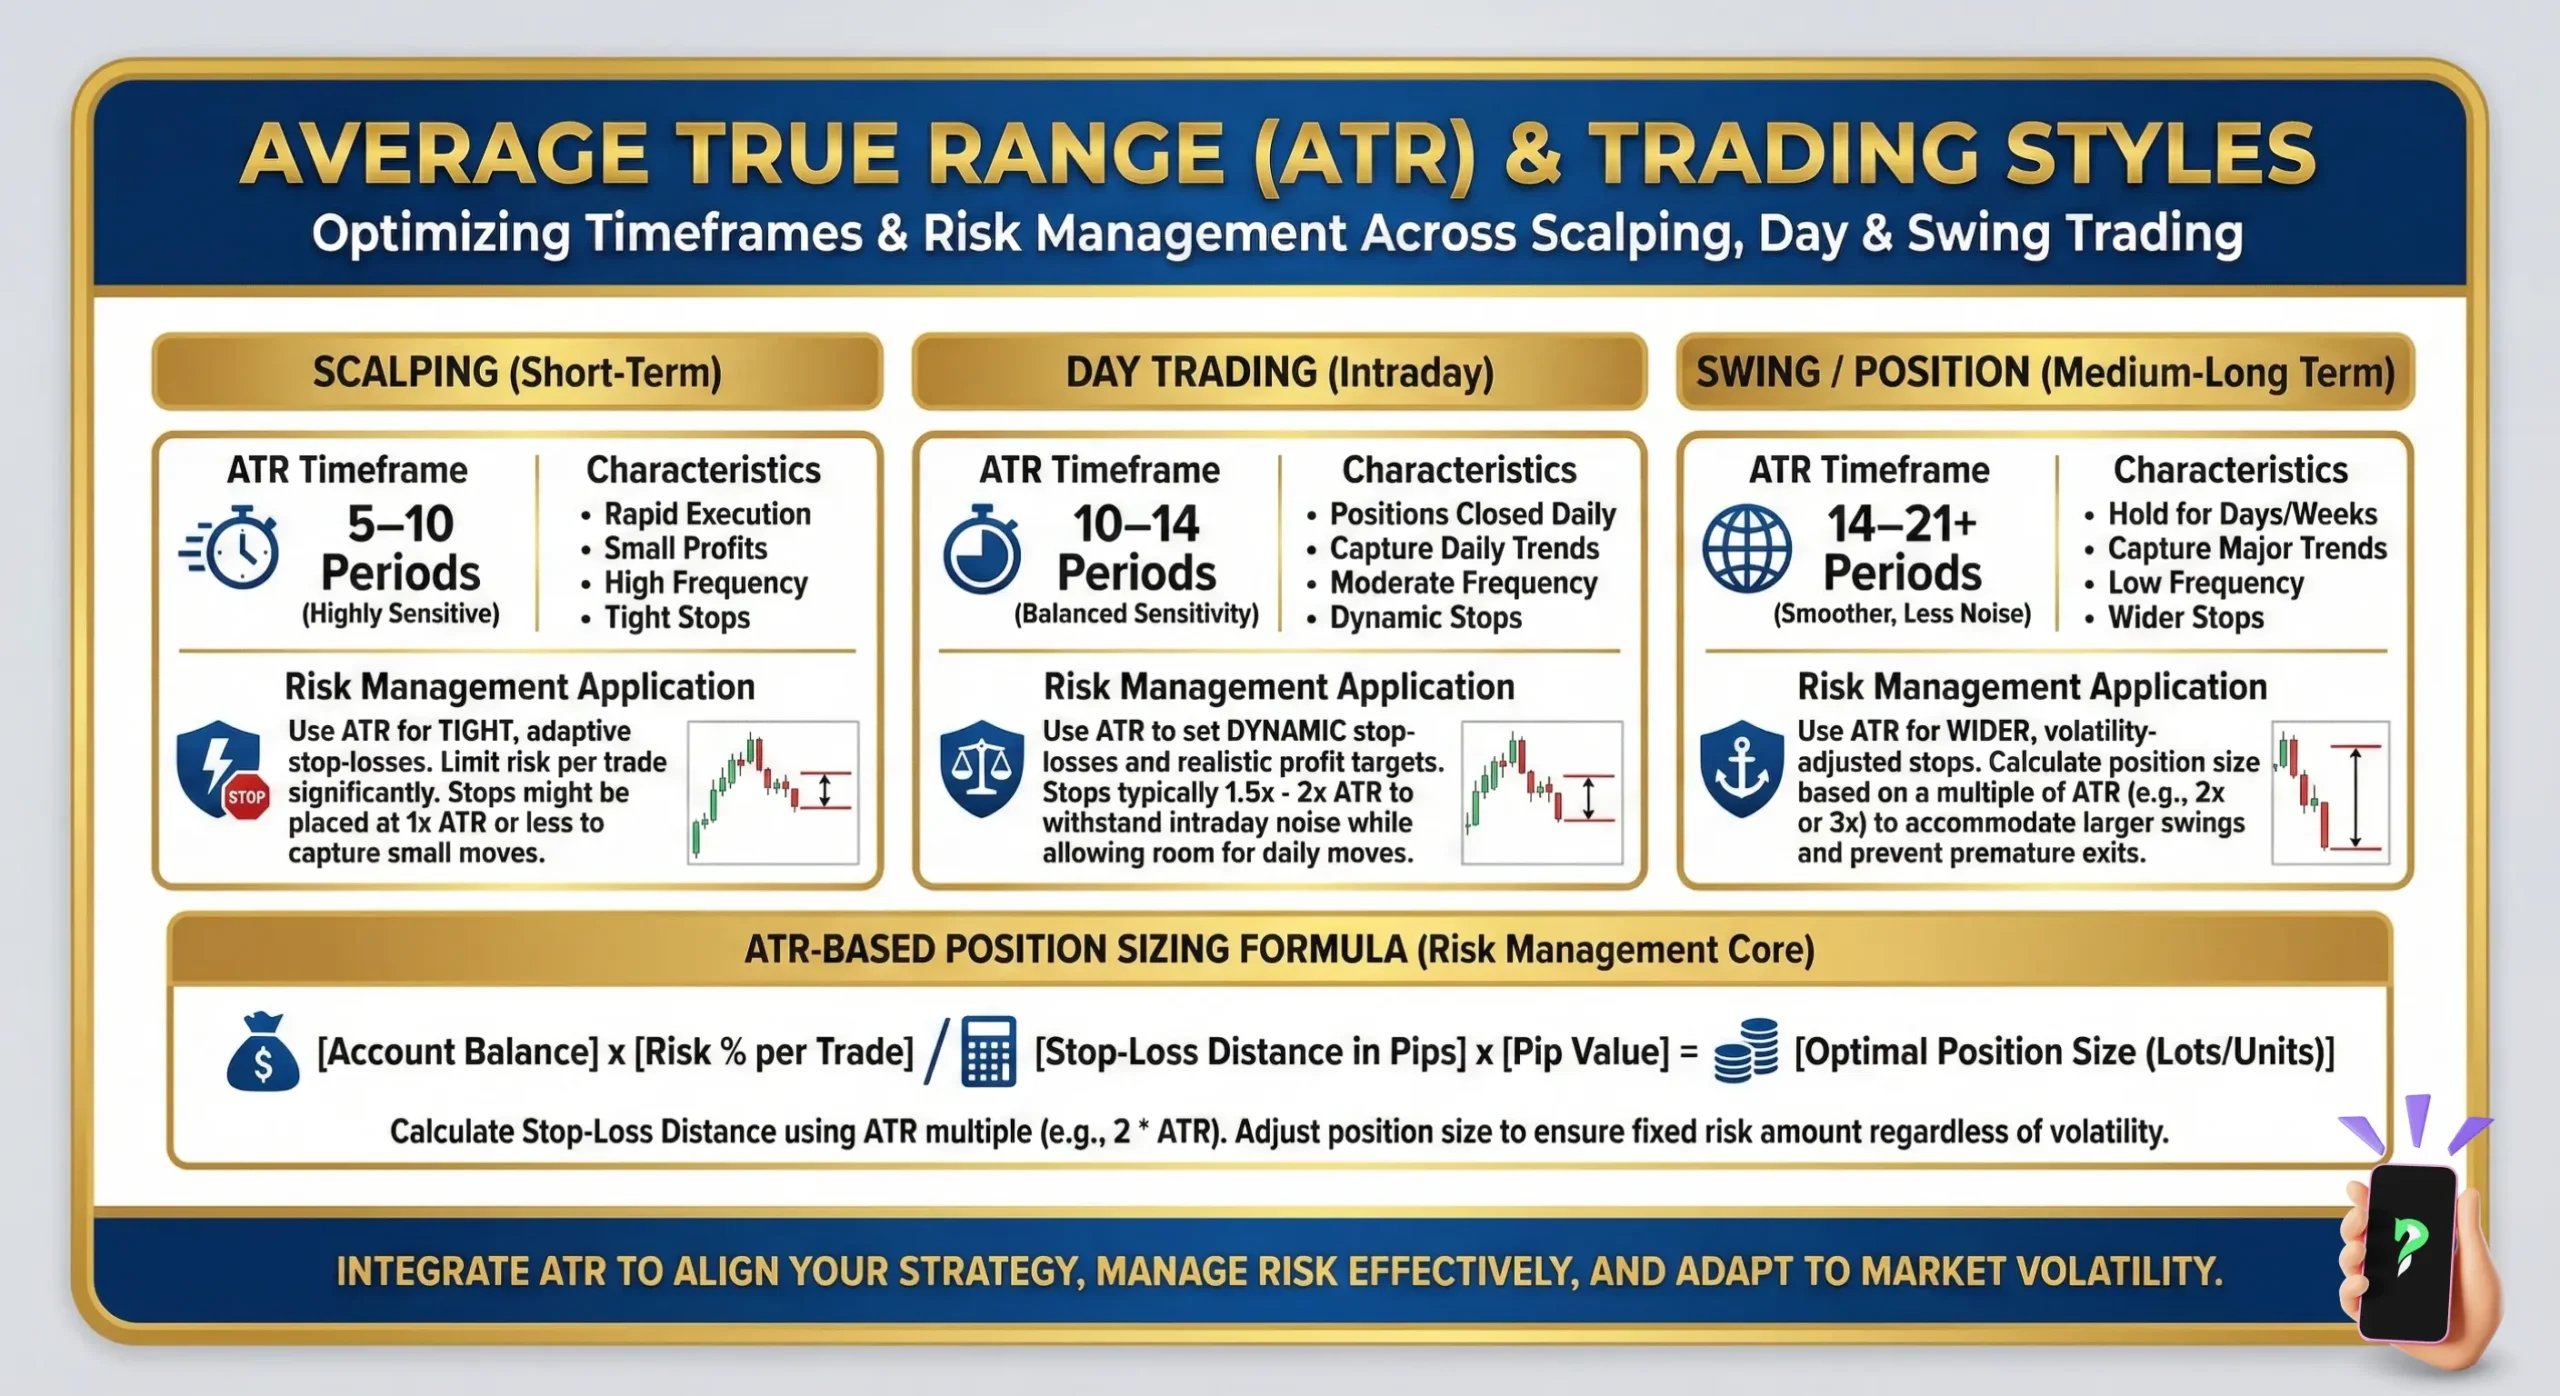
Average True Range (ATR): Optimizing Timeframes


