
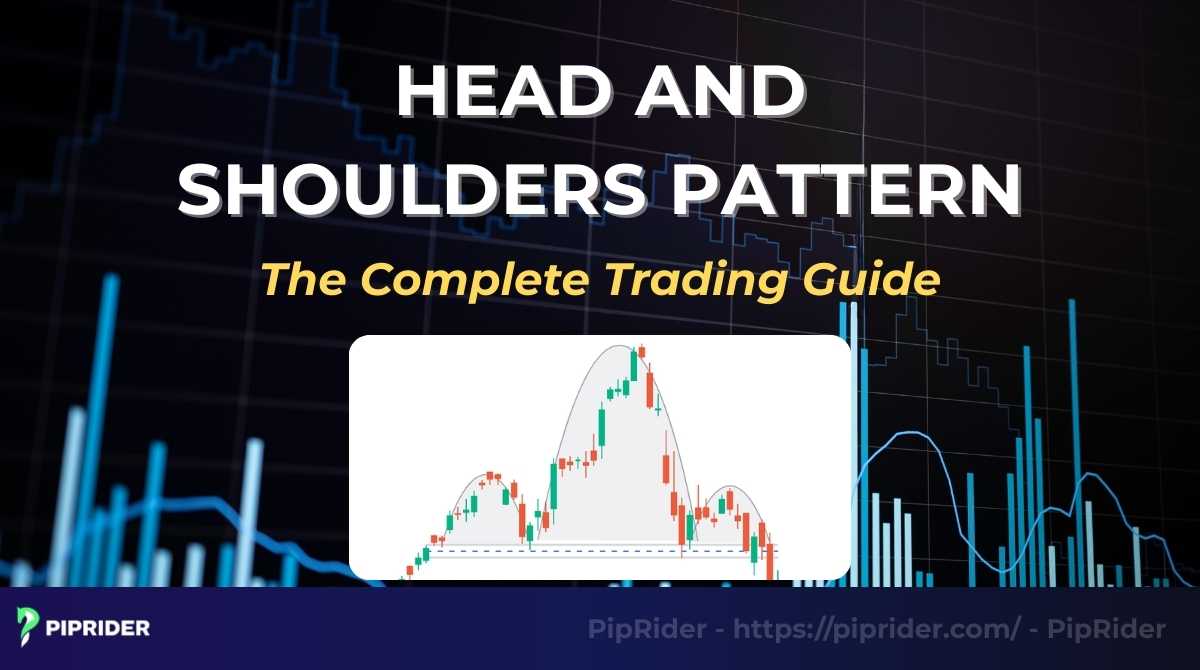
The Head and Shoulders pattern is one of the more respected classical reversal patterns in technical analysis. While no setup is guaranteed, mastering this formation helps you identify potential trend exhaustion, allowing you to exit winning trades before a crash and enter new positions with calculated risk. This guide teaches you to identify valid structures, filter out false signals, and set accurate profit targets for consistent results.
Key Takeaways
- The Head and Shoulders is a bearish reversal pattern that forms after an uptrend.
- It consists of a left shoulder, a higher head, a lower right shoulder, and a neckline.
- The signal is strongest when accompanied by decreasing volume and a confirmed breakout below the neckline.
- The profit target is equal to the vertical distance from the head to the neckline.
- The Inverse Head and Shoulders is the bullish variation used to trade bottoms.
1. What Is the Head and Shoulders Pattern?
The Head and Shoulders is a technical chart pattern that appears at the end of an uptrend. It signals that the bullish trend is over and a bearish reversal is starting.
Quick Head & Shoulders Rules
- Prior Trend: Must form after a clear uptrend.
- Structure: The Head must be the highest peak.
- Exhaustion: The Right Shoulder must stay below the Head (creating a lower high).
- The Golden Rule: The pattern is NOT valid until the price officially closes below the neckline.
- Confirmation: A volume spike on the breakout makes the setup significantly stronger.
1.1. Basic Definition in Technical Analysis
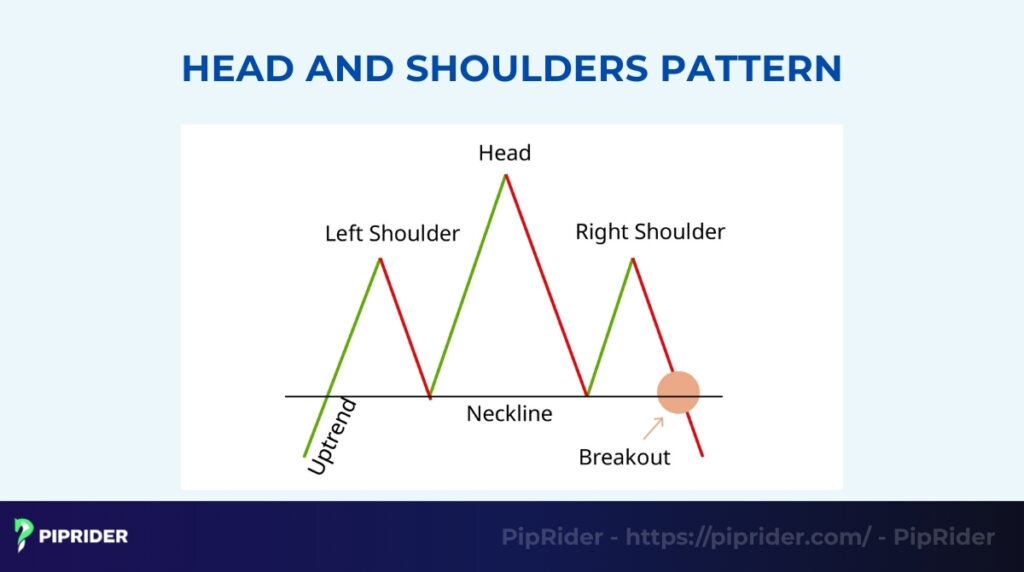
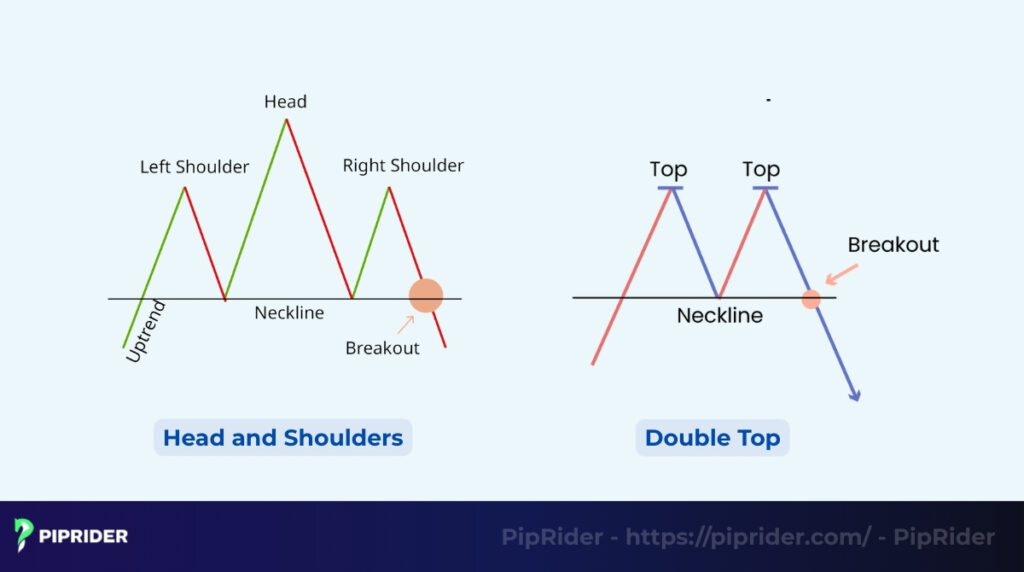
The Head and Shoulders pattern is a specific formation on a price chart used to predict a trend reversal. As the name suggests, the pattern looks like a human head with two shoulders. It consists of three distinct components:
- Left Shoulder: A peak formed after a strong price rise.
- Head: A higher peak situated between the two shoulders.
- Right Shoulder: A lower peak that fails to reach the height of the head.
- Neckline: A support line connecting the lows of the two shoulders.
When the price breaks below the neckline, the pattern is complete. This confirms that the uptrend has officially reversed into a bearish trend.
1.2. Why It Is a Respected Reversal Pattern
While no chart pattern works 100% of the time, the Head and Shoulders can be reliable when structure, volume, and neckline confirmation align. Financial educators like Investopedia highlight it as a key indicator for signaling potential trend changes (Mitchell, 2024).
Furthermore, historical pattern studies suggest relatively favorable failure rates under specific market conditions. For instance, research by Thomas Bulkowski (2021) in the Encyclopedia of Chart Patterns indicates that the Head and Shoulders Top has a break-even failure rate of less than 10% in bull markets. However, professional traders treat this as a statistical edge, not a guarantee.
This reliability comes from the underlying mechanics. The pattern shows a visible, step-by-step transition in power:
- The head shows buyers can still push prices higher, but with struggle.
- The right shoulder shows buyers are exhausted and cannot push the price back to the previous high.
- The break of the neckline confirms that sellers have officially taken control.
1.3. Master Identification Table: Anatomy & Validation Rules
To trade this pattern like a pro, you must look beyond the visual shape. The following table breaks down the Anatomy of the formation alongside the Validation Rules (Volume and Price action) required for a high-probability setup.
| Stage | Component | Appearance & Symmetry | Volume & Market Signal | Strategic Validation (The Rule) |
| 0. Context | Prior Trend | A clear series of Higher Highs and Higher Lows leading into the pattern. | Steady Volume: Reflects a healthy, trending market. | Mandatory: Without a prior uptrend, the pattern has no reversal value. |
| 1. Start | Left Shoulder | A peak followed by a minor retracement to a support level. | High Volume: Strong buying pressure confirms the trend is still active. | Establishment: Defines the first “anchor point” of the future Neckline. |
| 2. Peak | The Head | The highest peak, standing clearly above both shoulders. | Decreasing Volume: Price reaches a new high on lower participation (Bearish Divergence). | Exhaustion: Signals that buyers are struggling to maintain control. |
| 3. Warning | Right Shoulder | A lower peak. Symmetry: Ideally matches the height and width of the left shoulder. | Low Volume: Buying interest evaporates. Buyers fail to create a new high. | Structural Break: Formation of a Lower High confirms the uptrend is dying. |
| 4. Trigger | The Neckline | The support line connecting the two troughs (lows) of the pattern. | The Breakout: Requires a decisive candle body close with a Volume Spike. | The Signal: Pattern is NOT valid until the price closes below this line. |
| 5. Entry | The Retest | Price rallies back to “kiss” the broken neckline from below. | Low Volume Retest: Price should struggle to move back up, followed by a rejection candle. | Safety Filter: Confirms support has flipped to resistance. Offers the highest win rate. |
2. Market Psychology: Why Does This Pattern Work?
The Head and Shoulders isn’t just a shape; it tells a story of mass panic. It reveals the exact moment market sentiment shifts from greed to fear.
- Momentum dies (the right shoulder): In a bull market, traders expect higher highs. The right shoulder is the first time buyers fail to push the price back to the peak. These market movements signal that the “easy money” phase is over and “Smart Money” has stopped buying.
- The “bull trap” at the head: Traders who bought at the absolute top (Head) are now trapped in losing positions. As the price rallies slightly to form the right shoulder, these trapped buyers panic and sell to “get out alive.” This selling pressure stops the rally dead in its tracks.
- Panic selling at the neckline: The neckline is the last line of defense. When it breaks, two things happen instantly: old buyers give up (Stop Losses hit), and new bears jump in. This “double dose” of selling creates the violent drop that follows.
3. Types of Head and Shoulders Patterns
While the classic shape is famous, the pattern has key variations depending on the market trend. Use this quick comparison table to identify exactly which setup you are trading.
| Pattern Type | Trend Context | Signal | Key Feature |
| Standard H&S | Uptrend | Sell (Bearish) | Head is highest peak |
| Inverse H&S | Downtrend | Buy (Bullish) | Head is lowest trough |
| Complex H&S | Any reversal zone | Weaker / needs care | Multiple shoulders |
| Sloping Neckline H&S | Uptrend | Sell (Bearish) | Neckline angle affects aggressiveness |
3.1. Standard Head and Shoulders (Bearish)
The Standard Head and Shoulders pattern is the most widely recognized variation in technical analysis. It typically appears at the exhaustion point of a strong bull market, signaling that the upward momentum is finally over and sellers are taking control.
- Context: Forms exclusively at the peak of an uptrend.
- Appearance: Three peaks (High → Higher High → Lower High).
- The Signal: Traders look to SELL (Short) when the price closes below the neckline support.
3.2. Inverse Head and Shoulders (Bullish Reversal)
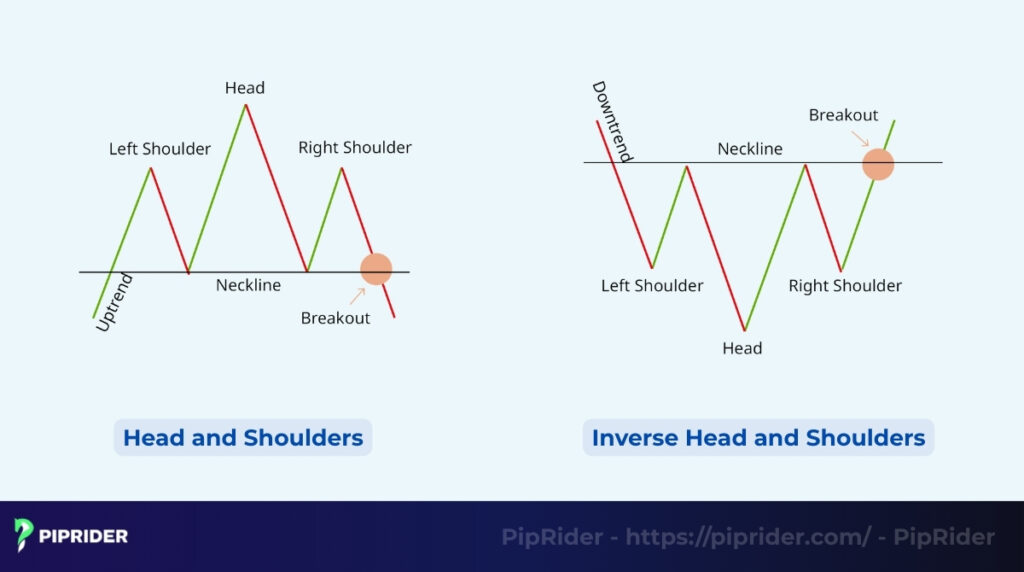
The Inverse Head and Shoulders (or “Head and Shoulders Bottom”) is the mirror image of the standard pattern. Instead of marking a top, this formation helps traders identify the exact moment a downtrend is reversing into a new rally.
- Context: Forms exclusively at the bottom of a downtrend.
- Appearance: Three troughs (Low → Lower Low → Higher Low).
- The Signal: Traders look to BUY (Long) when the price breaks above the neckline resistance.
3.3. Complex Head and Shoulders (Multiple Shoulders)
Real markets are rarely perfect. Sometimes you will see a “messy” pattern with, for example, two left shoulders and one right shoulder.
- Trade with caution: These patterns are harder to identify. Symmetry is key. If the pattern looks too chaotic, it is often safer to wait for a clearer setup to avoid false signals.
3.4. Sloping Neckline Variations
The neckline is rarely perfectly horizontal. The angle provides a hidden clue about the strength of the move:
- Upward Slope: In a bearish pattern, this acts as rising support, making it harder for sellers to break through.
- Downward Slope: This is the ideal scenario for bears. A downward slope shows sellers are aggressive even before the breakdown, increasing the probability of a successful crash.
4. How to Trade the Standard Head and Shoulders (Bearish Setup)
Identifying the pattern is only the first step. To make money, you need a precise execution plan. Instead of guessing, align your entry and stop-loss choices with your personal experience level and the asset’s volatility.
4.1. Entry Strategy 1: Neckline Breakout Entry (Aggressive)
Traders fearful of missing a sharp drop often choose the instant breakout entry. It secures a position early but carries a higher risk of entering a false breakdown.
- Best For: Aggressive momentum traders who want to catch the move early and are completely comfortable accepting the risk of “fakeouts.”
- The Trigger: Open a short (sell) position immediately when a candle closes decisively below the neckline.
- The Rule: Avoid entering while the candle is still moving. A long wick rejection could turn the breakdown into a bear trap.
4.2. Entry Strategy 2: Retest Neckline (Conservative & More Reliable)
Waiting for a pullback provides a second chance to enter at a better price. It confirms the neckline has officially flipped from support to resistance.
- Best For: Beginners, conservative traders, and swing traders prioritizing capital preservation. This strategy offers a much higher win rate by demanding strict confirmation.
- The Process: Allow the initial breakout to happen, then wait for the price to rally back up to the neckline.
- The Trigger: Enter short only when a bearish rejection candle (like a Pin Bar or Bearish Engulfing pattern) forms precisely at the retest level.
4.3. Stop Loss Placement (Head, Shoulder, ATR)
Risk management determines long-term survival. Choose your stop-loss location based on your risk profile and the market you are trading:
- Aggressive (Above Right Shoulder): Place the Stop Loss slightly above the high of the Right Shoulder. Best for traders looking for a tight risk-to-reward ratio who will quickly cut losses if the setup fails.
- Conservative (Above Head): Place the Stop Loss above the absolute top of the Head. Best for traders who want maximum safety from institutional “stop hunts,” though it requires a smaller position size to maintain proper risk control.
- Dynamic (ATR): Using the Average True Range (ATR) indicator. Best for highly volatile assets like Crypto or low-cap stocks. Setting a stop at 1.5x ATR above the breakout candle accounts for erratic market noise and prevents premature exits.
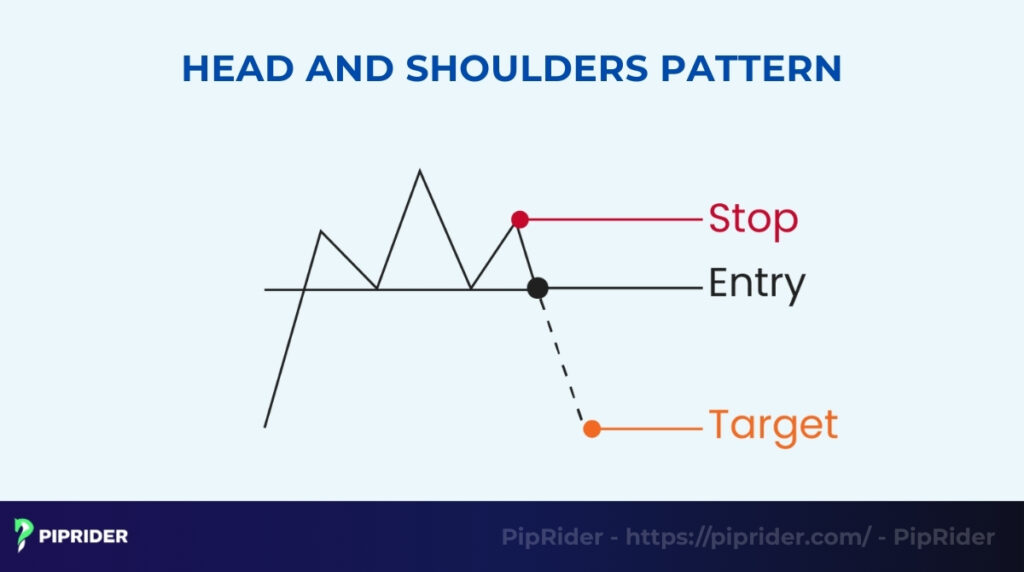
4.4. Take Profit Target Using Measured Move Technique
The Head and Shoulders pattern structure offers a precise mathematical target. Traders project the pattern’s height downward to define exact exit points.
- Measurement: Calculate the vertical distance (pips or points) from the peak of the Head down to the Neckline.
- Projection: Subtract this distance from the breakout point.
- Formula: Take Profit = Neckline Price – (Head High – Neckline Low)
5. How to Trade the Inverse Head and Shoulders Pattern
While the standard pattern helps you short the market top, the Inverse Head and Shoulders (often called a Head and Shoulders Bottom) is your playbook for catching major market bottoms.
Trading this bullish reversal follows a similar logical framework, but the underlying psychology is entirely different. An Inverse setup is essentially a massive Short Squeeze. Short sellers who pushed the price down to the absolute low (the Head) are now trapped as the Right Shoulder forms a higher low. When the neckline breaks, their forced “buy-to-cover” orders provide the rocket fuel for the new uptrend.
5.1. The Breakout Entry (Aggressive)
This approach aims to capture the explosive surge of buying momentum the exact second the bearish market structure is broken.
- The Trigger: Open a Buy (Long) position the moment a strong bullish “Power Candle” closes decisively above the neckline resistance.
- The Volume Imperative: Markets can fall under their own weight, but they require aggressive buying to rise. If the price breaks the neckline but volume is flat, do not enter. A valid bullish breakout demands a massive volume spike to prove that institutional buyers have stepped in.
5.2. The Neckline Retest (Conservative)
Market bottoms are notoriously choppy and prone to “Wick-and-Reverse” traps. Waiting for a retest is the favored strategy for professionals who prioritize capital preservation over FOMO (Fear Of Missing Out).
- The Process: Allow the initial breakout to clear the neckline, then wait patiently for the price to pull back and touch the broken line from above (proving that Resistance has successfully flipped to Support).
- The Trigger: Enter Long only when a strong bullish rejection candle (such as a Bullish Engulfing or a long-tailed Pin Bar) forms precisely at this new support level.
5.3. Stop-Loss Placement (The Defensive Shield)
Your stop-loss location defines your risk profile. Use these three methods based on market volatility:
- Aggressive (Tighter Risk): Place the Stop Loss just below the lowest point of the Right Shoulder. This keeps your risk-to-reward ratio high and relies on the premise that a true new uptrend should not break its higher lows.
- Conservative (Maximum Safety): Place the Stop Loss below the absolute bottom of the Head. This protects you from deep institutional “stop hunts,” but you must reduce your lot size to account for the wider distance.
- Dynamic (ATR Filter): Place your stop 1.5x the Average True Range (ATR) below the entry point to give the trade enough “breathing room” to survive normal intraday noise.
5.4. Setting the Upward Take-Profit Target
The Inverse Head and Shoulders uses the standard “Measured Move” technique, but a professional trader always checks the broader context before setting a rigid limit order.
- Measurement: Calculate the vertical distance (in pips or dollars) from the absolute low of the Head straight up to the Neckline.
- Projection: Add this exact height to the breakout point above the neckline. (Formula: Take Profit = Breakout Price + Pattern Height).
- Piprider Pro Tip (Context Overrides Math): If a major Weekly or Daily supply zone sits before your Measured Move target, take partial profits at that structural wall. Never let a rigid mathematical formula override obvious market barriers.
6. Invalid Setups & Common Retail Traps
Even experienced traders lose money when they force a trade on a bad setup. Combining structural validation with disciplined execution is the only way to avoid costly “bear traps” and improve your overall strike rate.
6.1. Structural Flaws: When the Pattern is Invalid
If a setup exhibits any of the following geometric flaws, the pattern has no predictive power. Do not force the trade.
- No Clear Prior Uptrend: The human brain loves to find patterns in random noise, hallucinating a Head and Shoulders in a choppy, sideways market.
- The Reality: Without a prior trend to reverse, the formation has no predictive power.
- The Fix: Zoom out. If you cannot see a clear uptrend on the left side of the chart, delete the drawing and move on.
- The Head is Not Prominent: The middle peak (Head) must clearly stand out above both shoulders. If all three peaks are relatively flat or equal in height, you are likely looking at a Triple Top or a messy consolidation block, not a Head and Shoulders.
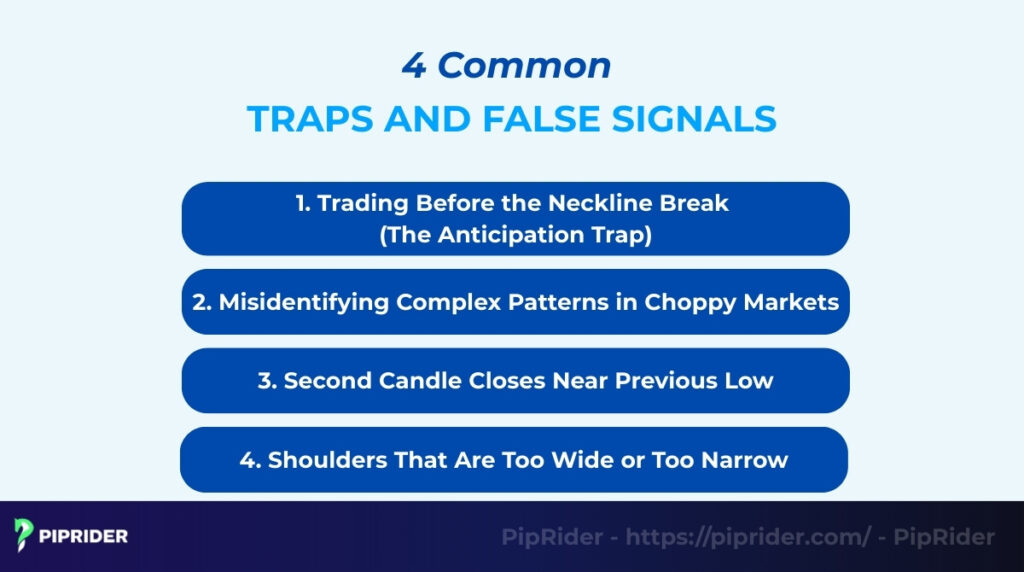
- Shoulders That Are Too Wide or Narrow: Proportionality affects the pattern’s reliability.
- The Problem: If the Right Shoulder takes three times longer to form than the Left Shoulder, the bearish momentum has likely dissipated, making a reversal less likely.
- The Fix: Look for symmetry. The time duration and height of the Left and Right Shoulders should be roughly similar.
- A “Messy” Neckline: A valid neckline should neatly connect the two swing lows. If you have to force your trendline to cut through the bodies of multiple overlapping candles just to “make it fit,” the support level is invalid.
6.2. Execution Traps: Why Traders Still Lose
Even when the structure is perfect, impatience can quickly ruin your win rate. Avoid these three common pitfalls:
- Trading Before the Neckline Break (The Anticipation Trap): Novice traders often enter a short position while the Right Shoulder is still forming, hoping to catch the exact top.
- The Danger: The price often hits the neckline and bounces strongly, morphing into a continuation pattern.
- Smart Approach: Exercise patience. Never pull the trigger until a daily or 4-hour candle closes decisively below the neckline.
- False Breakout When Volume Is Weak: A breakdown without momentum is a major red flag. If the price slips below the neckline but volume remains low, it suggests “Smart Money” is not participating.
- The Trap: Institutional buyers absorb the weak selling pressure and push the price aggressively higher to hunt stop losses.
- Confirmation Rule: Look for a noticeable volume spike on the breakout candle. No volume, no trade.
- The “Wick-Only” Breakdown: A long wick that pierces the neckline and immediately pulls back up is not a breakout; it is a liquidity grab. The pattern remains completely unconfirmed until the candle body strictly closes below the line.
7. Which Head and Shoulders Setup Is Best for Beginners?
For novice traders, the primary goal isn’t to catch every single market reversal; it is to protect capital while learning to read market structure. The financial markets are unforgiving, so your best defense is to eliminate ambiguity.
If you are a beginner, you should ignore 80% of the formations you see and wait patiently for the absolute clearest, most objective setup.
7.1. The “Green Light” Setup (What to Trade)
To build consistency and confidence, your trading plan should focus exclusively on “textbook” formations. Here is the exact blueprint of a high-probability, low-risk setup you should look for:
- The Standard H&S: Stick to the classic three-peak formation with clear visual symmetry between the Left and Right Shoulders.
- A Perfectly Horizontal Neckline: Sloping necklines require subjective drawing and dynamic calculations. A flat, horizontal support line is objective, easy to spot, and respected by the masses.
- The Retest Entry: Never chase the initial breakout. Beginners should strictly use the “Conservative Strategy”—wait for the price to break the neckline, pull back to retest it, and form a rejection candle. This drastically reduces the risk of getting caught in a fakeout.
- Higher Timeframes (H4 or Daily): These timeframes filter out intraday noise and represent true institutional money flows.
7.2. The “Red Light” Setups (What to Avoid)
On the flip side, protecting your capital means knowing when to stay on the sidelines. If you spot any of these messy configurations, consider them a strict “do not trade” signal:
- The Complex H&S: If the chart shows two left shoulders or a mutated, lopsided head, skip the trade. Complexity breeds confusion and lowers your statistical edge.
- Low-Timeframe (LTF), Wick-Heavy Charts: Crypto and low-cap stocks are notoriously volatile. Trying to trade an H&S pattern on a 5-minute or 15-minute chart will subject you to endless “wick-heavy” stop hunts and algorithm-driven fakeouts. Leave the lower timeframes to experienced day traders.
8. Execution Examples: Trading the Pattern in Real Markets
To truly master the Head and Shoulders, you must see how it “breathes” in different asset classes. Below are three execution blueprints based on real-world market behavior.
8.1. Forex Example: EUR/USD (The Classic Swing)
Forex is the most liquid market in the world, making it the ideal environment for “textbook” break-and-retest entries.
- Context: EUR/USD has been in a sustained 3-week bull run, hitting a major psychological resistance zone at 1.1000.
- Pattern: A symmetrical Standard H&S forms on the 4-Hour (H4) chart with a perfectly horizontal neckline.
- Trigger: Wait for an H4 candle to close below the neckline. Enter Short (Sell) only when a bearish rejection candle (like a Pin Bar) forms during the retest of the broken neckline.
- Stop Loss: 10–15 pips above the high of the Right Shoulder.
- Target: The measured move (distance from Head peak to Neckline) projected downward from the breakout point.
- Why it worked: The high liquidity allowed for an orderly transition of power. The retest confirmed that the previous support had successfully flipped into new resistance.
8.2. Stock Example: AAPL – Apple Inc. (The Institutional Gap)
In the stock market, price “gaps” and volume spikes are the primary “smoking guns” of institutional selling.
- Context: AAPL hits an all-time high, but the Daily volume has been steadily decreasing while price rose—a classic Bearish Volume Divergence.
- Pattern: A Standard H&S with a slightly downward-sloping neckline (showing aggressive sellers).
- Trigger: Enter Short at the market open if the price “Gaps Down” below the neckline on significantly higher-than-average volume.
- Stop Loss: Placed at the midpoint of the gap or slightly above the Right Shoulder.
- Target: The measured move height, adjusted for the nearest major Daily support level (demand zone).
- Why it worked: The gap-down showed that big banks and hedge funds were dumping positions before retail traders could even react, confirming a massive shift in sentiment.
8.3. Crypto Example: BTC/USD (The Volatility Filter)
Crypto markets are famous for “fakeouts” and “stop hunts.” Success here requires ignoring intraday noise.
- Context: Bitcoin pumps to a new local high, but the RSI (14) shows a massive Bearish Divergence at the Head.
- Pattern: A “messy” H&S with long wicks on both shoulders, reflecting high volatility.
- Trigger: The Strict Rule: Ignore all intraday wicks. Enter Short only after a Daily (D1) candle body closes decisively below the neckline.
- Stop Loss: Placed above the Head (Conservative) to survive high-volatility spikes.
- Target: Measured move target + the nearest major moving average (e.g., 200-day EMA).
- Why it could fail: Trading the “wick” on a lower timeframe (H1 or M15) would have resulted in a stop-out due to a 3% “liquidity grab” bounce before the actual 20% crash occurred.
9. Best Timeframes for the Head and Shoulders Pattern
Because financial markets are fractal, you will find the Head and Shoulders pattern on a 1-minute chart just as you would on a Monthly chart. However, its reliability scales directly with the timeframe you choose.
The longer it takes for a pattern to form, the more institutional money is trapped, making the eventual breakout much more powerful. Here is how you should approach different timeframes:
9.1. Daily (D1) and 4-Hour (H4): The Institutional Standard
If you want the highest probability of success, these are the timeframes to master.
- The Advantage: They offer a much cleaner structure. The D1 and H4 charts naturally filter out the random “noise” and algorithmic spikes that plague lower timeframes.
- The Logic: A pattern that takes weeks or months to build on a Daily chart represents a massive shift in macroeconomic sentiment. When the neckline breaks here, it triggers major institutional rebalancing, leading to long, sustained trends.
9.2. 1-Hour (H1): The Day Trader’s Sweet Spot
The H1 chart is the lowest timeframe professional swing traders usually consider for this setup.
- The Advantage: It provides more frequent trading opportunities while still maintaining a reasonable level of structural integrity.
- The Catch: It requires strict filters. Because the H1 timeframe is subject to session-specific volatility (e.g., the London or New York open), you must use confirmation tools like volume spikes, RSI divergence, or the 50-EMA before entering a trade.
9.3. 15-Minute (M15) and 5-Minute (M5): The Danger Zone
While impatient day traders often hunt for patterns here, it is a highly treacherous environment.
- The Reality: These charts are incredibly noisy. What looks like a valid Head and Shoulders on an M5 chart is often just a random 30-minute consolidation block on the H1 chart.
- The Trap: Lower timeframes are heavily manipulated by algorithms and “stop hunts.” You will frequently see long wicks piercing the neckline—triggering your entry—only to immediately reverse and hit your stop loss. Beginners should avoid trading this pattern on anything lower than the H1 chart.
10. Which Indicators Best Confirm the Head and Shoulders Pattern?
Never rely on price action alone. Use this checklist to filter out false signals by combining the Head and Shoulders pattern with technical indicators.
| Indicator | What to look for | Signal |
| RSI | Lower high while price makes higher high | Bearish divergence |
| MACD | Histogram fading / cross below zero | Momentum shift |
| Volume | Spike on neckline break | Valid sell-off |
| EMA | Close below 20/50 EMA | Structural weakness |
To increase your win rate, look for at least two of the following confirmations before pulling the trigger:
- RSI divergence at the head: As the price pushes up to make the highest peak (Head), look at your RSI. If the RSI makes a lower high, it creates a “Bearish Divergence.” This proves the trend is running on fumes.
- MACD momentum shift: Watch the MACD histogram as the Right Shoulder forms. It should be shrinking or flipping below zero. A bearish crossover (Signal line crossing below MACD line) is a strong confirmation.
- Volume spike confirmation: Treat volume as a strict filter. If the price breaks the neckline but volume is low, stay out. You need to see a significant spike in sell volume to confirm that institutions are dumping positions to validate the new bearish trend.
- EMA breakdown: Exponential Moving Averages (like the 50-EMA) often act as dynamic support. A high-probability trade usually sees the neckline break coinciding with a candle closing below the 50-EMA.
11. Head and Shoulders vs. Other Reversal Patterns
Confusion leads to bad trades. While many patterns signal a reversal, they have different structures and reliability levels. Use the guide below to ensure you are trading the correct setup—and more importantly—the one that fits your skill level.
| Pattern | Structure | Key Difference | Reliability |
| Head & Shoulders | 3 Peaks (Middle is highest) | Right Shoulder is a Lower High (Structural break). | High |
| Double Top | 2 Peaks (Equal height) | Looks like the letter “M”; tests resistance twice. | Moderate |
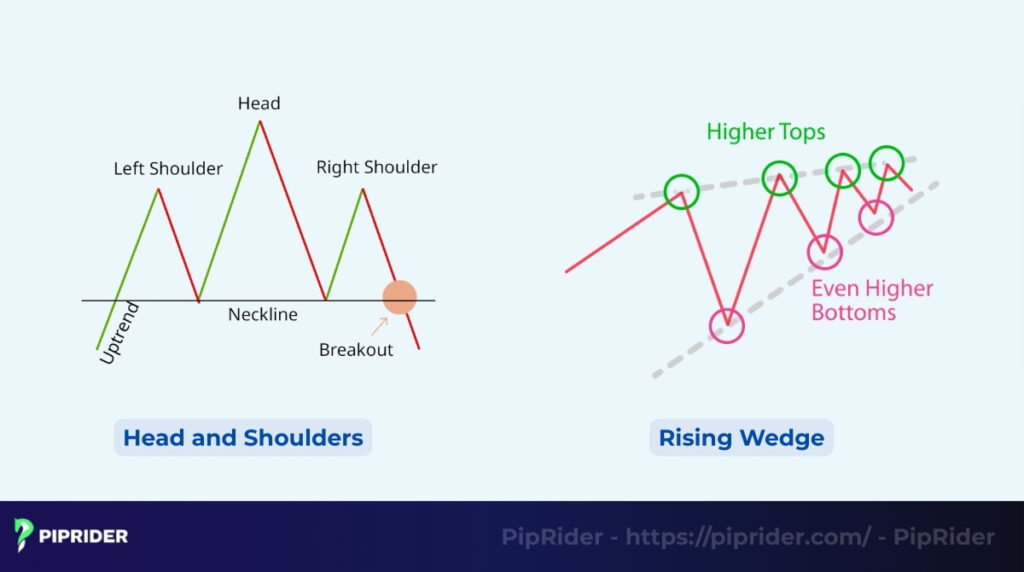
| Rising Wedge | Higher Highs + Higher Lows | Price compresses into a narrow, diagonal cone. | High (if steep) |
11.1. Head and Shoulders vs. Double Top: Which Is Easier to Trade?
These are the two most common bearish reversals, but they tell different stories about buyer exhaustion.
The Verdict: The Head and Shoulders is “safer” to trade, but the Double Top is “easier” to spot on a chart.
- The Structural Advantage: In a Head and Shoulders, the Right Shoulder (Lower High) is a “gift” from the market. It provides early confirmation that the bull trend is already dying before the neckline even breaks.
- The Risk Factor: A Double Top is more prone to “fakeouts.” Often, the second peak will briefly spike above the first to hunt liquidity before reversing. This makes stop-loss placement much trickier than the H&S, where the Right Shoulder provides a clear structural “wall.”
- Piprider Tip: If you are a beginner, prioritize the Head and Shoulders. The three-peak structure provides more data points and a clearer signal of institutional distribution.
11.2. Head and Shoulders vs. Rising Wedge
While both appear at the end of uptrends, their geometry and exit strategies differ significantly.
- The Geometry: A Head and Shoulders typically leads to a horizontal support breakdown. A Rising Wedge is a diagonal pattern where price continues to make higher highs, but the range gets tighter (lines converge).
- The Logic: H&S indicates a failed attempt to make a higher high. A Wedge indicates that while prices are rising, the buying pressure is weakening significantly—the trend is “climbing a mountain with no oxygen.”
11.3. Head and Shoulders vs. M-Pattern
The “M-Pattern” is essentially the visual description of a Double Top, but traders often confuse it with a “Complex” Head and Shoulders.
- Visual Check: An M-Pattern has sharp, equal peaks. A valid H&S must have a middle peak (Head) that is significantly higher than the surrounding shoulders.
- The Morphing Trap: If you see a Head and Shoulders where the Right Shoulder rises as high as the Head, the pattern has failed. It has “morphed” into a Double Top. You must immediately adjust your strategy: your entry trigger is no longer the H&S neckline, but the support level (trough) of the Double Top.
12. Which Tools Can Automatically Detect the Pattern?
Manual detection takes practice. Save time by using these verified scanners to alert you immediately when a pattern forms.
- TradingView Auto Pattern Recognition: A built-in indicator (“All Chart Patterns”) that highlights Head and Shoulders patterns automatically. Best for beginners to learn visual recognition without complex setup.
- TrendSpider Pattern Scanner: A professional tool that scans multiple time frames simultaneously. It allows you to adjust sensitivity to filter out “messy” patterns and find only high-quality setups.
- MT4/MT5 Pattern Indicators: Plugins like Pattern Graphix or ZUP (available on the MQL5 market) draw necklines and project profit targets directly on your Forex terminal.
AI Chart Pattern Detectors: Advanced platforms like Tickeron or AutoChartist use Machine Learning to not only detect the pattern but also calculate a “Confidence Score” based on historical success rates.
13. Frequently asked questions about Head and Shoulders Pattern
Quick, direct answers to the most common questions regarding the Head and Shoulders pattern.
14. Conclusion
The Head and Shoulders pattern is a reliable reversal signal, but only when traded with discipline. A valid setup requires a decisive neckline breakout confirmed by a volume spike, ensuring that sellers have truly taken control of the market.
To maximize success, filter your trades using RSI divergence or wait for a neckline retest to avoid bear traps. Ready to master the markets? Follow Piprider today for professional insights to stay ahead of market movements. Visit our blog to refine your complete trading strategies.


