
The double top pattern is a powerful bearish reversal signal that forms when the market fails twice to break a high. Understanding how to trade double top patterns is critical for spotting market tops, avoiding bull traps, and finding high-probability short entries. This guide explains the structure, confirmation rules, and strategies to trade this pattern like a pro.
Key Takeaways
- A double top pattern is a bearish reversal formation that signals a change from an uptrend to a downtrend.
- It consists of two peaks at a similar price level and a central support level called the neckline.
- The pattern is only valid once the price breaks down below the neckline.
- Traders calculate the price target using a measured move: the vertical distance from the peak to the neckline.
- For higher accuracy, always confirm the pattern with volume, RSI divergence, or a trendline break to avoid false signals.
1. What Is a Double Top Pattern?
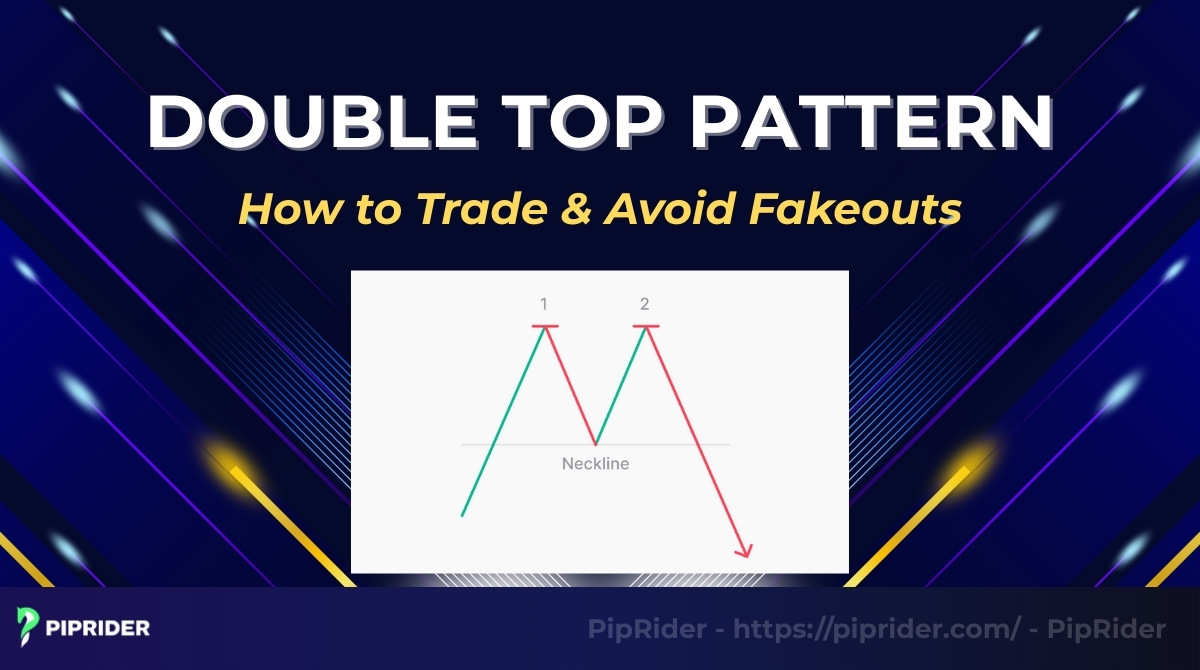
The double top pattern is a bearish technical reversal formation that signals a potential trend change. It occurs when an asset’s price hits a resistance level twice without breaking through, indicating that the uptrend has lost momentum and is shifting to a downtrend.
Visually, this pattern resembles the letter “M” on a price chart.

The pattern consists of three distinct parts:
- First peak: The price rallies to a new high but hits resistance and pulls back.
- Trough (neckline): The price drops to a temporary support level, creating the central trough of the M.
- Second peak: Buyers try to push the price up again to the same resistance level but fail to break it, proving that demand is exhausted.
Psychologically, double top pattern represents a shift in power. The first peak shows strong demand. However, the failure of the second peak to break resistance proves that the upward price movement is weakening. Sellers realize the uptrend is over and begin to take control.
Quick Double Top Rules
- ✓Prior Uptrend: Must form after a clear, established upward move.
- ✓Similar Peaks: Both peaks should be near the same price level (within 3-5%).
- ✓Clear Neckline: A distinct horizontal support level must exist between the peaks.
- ✓Valid Confirmation: The pattern is ONLY valid after a candle closes decisively below the neckline.
- ✓Technical Confluence: Use Volume or RSI divergence to verify the trap at Peak 2.
2. What Does the Visual Structure of a Double Top Look Like?
Visually, a double top pattern is defined by four specific phases that form an “M” shape: the first peak (initial rejection), a pullback to the neckline (support), a second peak (failed breakout), and the final neckline breakdown, which confirms the reversal.
- Peak 1 – First Rejection Zone: The pattern begins when the price rallies to a new high but faces strong resistance. Sellers step in aggressively at this level, rejecting the price and causing the first sell-off. This establishes the initial resistance zone.
- Pullback to Neckline Support: After the rejection, the price retreats until it finds temporary support. This low point is critical because it forms the “neckline” (the middle trough of the “M”). It represents the level where buyers try to save the trend one last time.
- Peak 2 – Failed Breakout Attempt: Buyers make a final attempt to push the price higher. However, as the price approaches the level of the first peak, demand dries up. The price fails to break the previous high (often forming a reversal candlestick pattern with a long upper wick), confirming that the uptrend has run out of steam.
- Neckline Breakdown – Trend Reversal Confirmation: The pattern is not complete until this final step. The price falls back down from the second peak and breaks below the neckline support. This breakdown confirms the reversal, triggering stop-losses from buyers and signaling a new downtrend has begun.
3. What Are the Different Types of Double Top Patterns?
While the classic “M” shape is the standard, the market often creates variations based on volatility and time. Traders typically encounter four specific types. Identifying the specific type helps you adjust your timing and expectations.
Here is a quick cheat sheet to distinguish them:’
| Pattern Type | Characteristics (Visual Shape) | Market Signal |
|---|---|---|
| Classic Double Top | Two even, symmetrical peaks. | Standard bearish reversal. |
| Adam & Eve | Peak 1 is sharp (A), Peak 2 is round and wide (E). | Slower distribution phase. |
| Wide Double Top | Peaks are separated by weeks or months. | Major, long-term trend change. |
| Failed (BUST) | Price fails to break neckline and breaks above Peak 2. | Bullish continuation (Bear Trap). |
3.1. Classic Double Top
The standard version features two peaks separated by a clear trough, creating a symmetrical ‘M’ shape. It signals a neat, textbook reversal where buying pressure hits a clear ceiling twice before giving up.
Piprider Tip: Watch the space between the peaks. If they are too close together (only a few candles apart), it might just be a single consolidation zone rather than a true Double Top reversal.
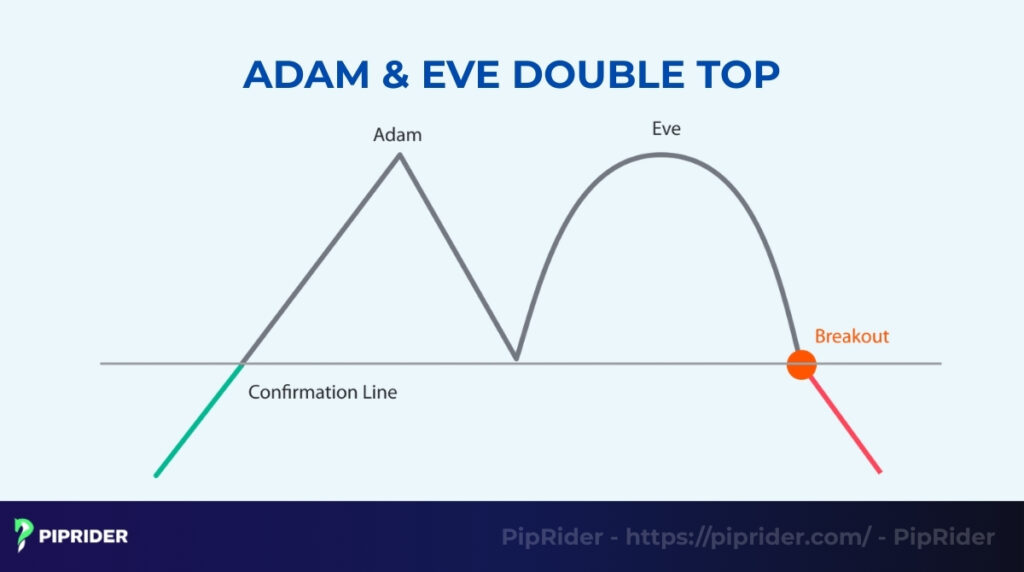
3.2. Adam & Eve Double Top
This variation is characterized by two distinct-looking peaks. The first peak (Adam) is sharp and narrow (V-shape), representing a sudden, violent rejection. The second peak (Eve) is wider and rounder (U-shape), showing a gradual loss of momentum.
Trading Logic: The rounded “Eve” peak is powerful because it shows that even after a slow attempt to reclaim the highs, buyers simply don’t have the strength anymore. Sellers are absorbing every bid over a longer period.
3.3. Wide Double Top
Timeframe and distance matter significantly here. The two peaks are separated by a long period (weeks or even months). Because the distribution phase lasts so long, the resulting breakdown often leads to a massive, macro trend reversal.
Pro Insight: Wide double tops are most common on Daily or Weekly charts. When the neckline finally breaks on a wide pattern, the “Measured Move” target is often exceeded because the institutional shift is so large.
3.4. Failed Double Top (The BUST Pattern)
Not all M-shapes result in a reversal. If the price pulls back from the second peak but finds support at or above the neckline, it may rally again. If it breaks above the resistance of the two peaks, the pattern has “failed.”
The Opportunity: Smart traders treat this failure as a high-probability Bullish Continuation signal. This is often a massive Bear Trap where short-sellers are forced to cover their positions, providing fuel for a violent rally to the upside.
4. How to Identify a Valid Double Top Pattern
Identifying a valid double top requires more than just finding an “M” shape on the chart. To filter out false signals, you must follow a strict 5-step checklist that verifies the trend, the price structure, and the volume.
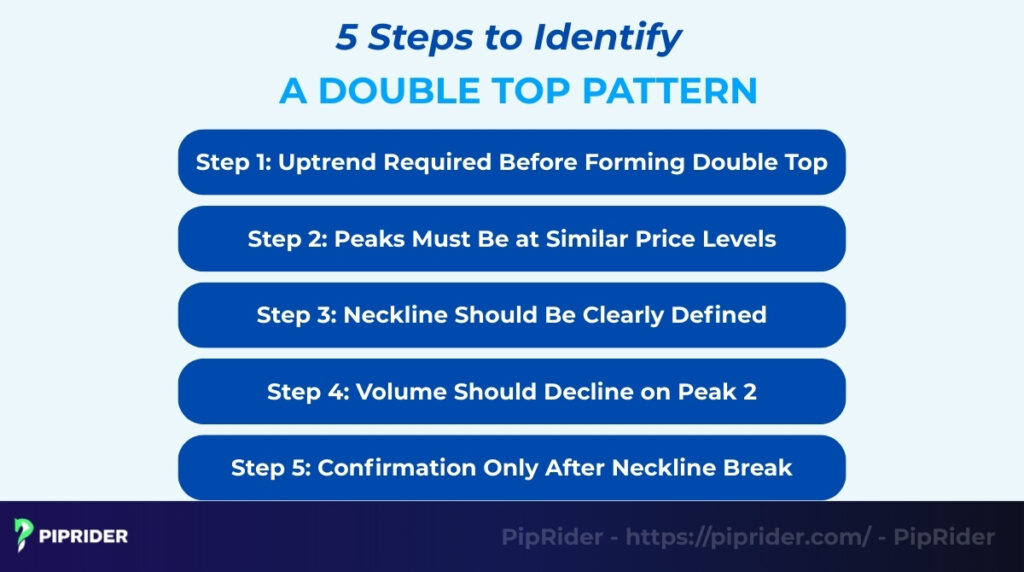
4.1. Step 1: Uptrend Required Before Forming Double Top
A reversal pattern cannot exist without a prior trend to reverse. You must first confirm that the asset is in an established uptrend. If you see an “M” shape in a sideways (ranging) market, it is not a double top; it is just random consolidation.
4.2. Step 2: Peaks Must Be at Similar Price Levels
Visually, the two peaks should look like twins. They do not need to be at the exact same price to the penny, but they should be close. A difference of 3% to 5% between the highs is generally acceptable. If the second peak is significantly lower than the first, it may simply be a lower high in a normal downtrend.
4.3. Step 3: Neckline Should Be Clearly Defined
The neckline is the horizontal support level drawn through the lowest point of the trough (the valley between the two peaks). This line is your “trigger zone.” You must be able to draw a clear, straight line connecting the reaction lows. If the support area is messy or unclear, the pattern is less reliable.
4.4. Step 4: Volume Should Decline on Peak 2
Volume acts as a lie detector. In a classic Double Top, you should see higher volume on the first peak (strong buying) and noticeably lower volume on the second peak. This divergence proves that buying pressure is drying up (“exhaustion”) as the price tries to retest the highs.
4.5. Step 5: Confirmation Only After Neckline Break
The double top pattern is not valid until the price actually breaks support. A common mistake is assuming the pattern is complete while the price is still hovering at the second peak. You must wait for a candle to close decisively below the neckline to confirm the pattern is active.
5. How to Trade the Double Top Pattern
Once you identify the pattern, execution is key. Instead of blindly picking a strategy, choose the one that aligns with your experience level and risk tolerance.
| Strategy | Risk Level | Reward Potential | Best For (The Decision) |
|---|---|---|---|
| 1. Neckline Breakout | Medium | Medium | Beginners (Wait for full confirmation) |
| 2. The Retest | Low | High | Patient Traders (Better entry price) |
| 3. Peak 2 (Aggressive) | High | Very High | Pro Traders (Advanced candlestick reading) |
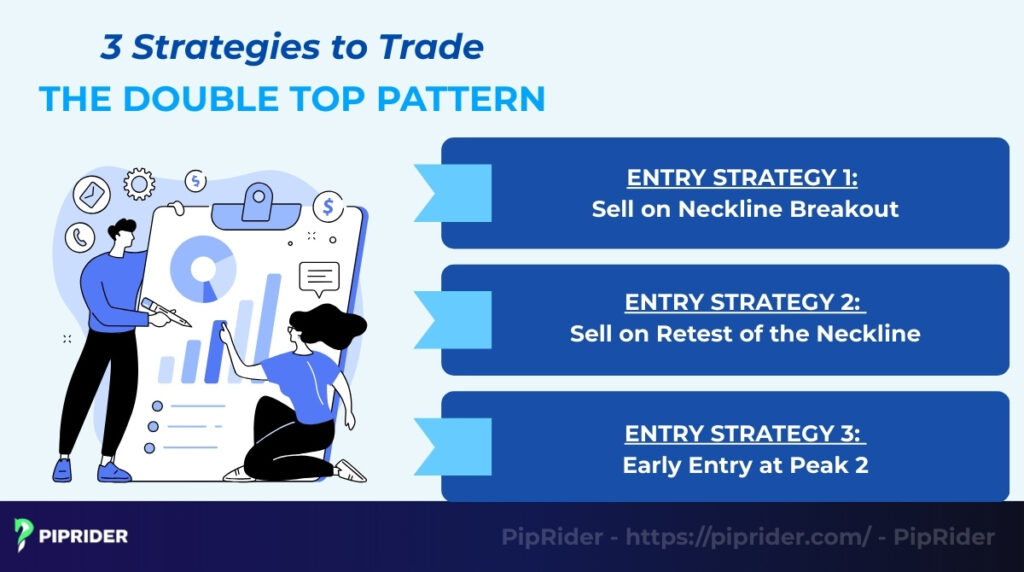
5.1. Entry Strategy 1: Sell on Neckline Breakout
Trading the breakout is the standard approach used by most retail traders because it waits for the pattern to fully complete. By waiting for the support to break, you have confirmation that the sellers have officially taken control.
- The Setup: Wait patiently for the price to breach the support level.
- The Trigger: Enter a “Sell” trade only when a candle closes decisively below the neckline. This breakdown serves as your primary entry point.
- The Decision: Best for beginners and mechanical traders. It is the easiest to execute because it removes the guesswork of “picking the top.”
- The Risk: Be careful of “fakeouts” (whipsaws) in volatile market conditions where price breaks down but snaps back up.
5.2. Entry Strategy 2: Sell on Retest of the Neckline
A more conservative method involves waiting for a retest, relying on the principle that “broken support becomes new resistance.”
- The Setup: After the breakdown, wait for the price to rally back up to touch the neckline.
- The Trigger: Enter on a bearish rejection candle (like a pin bar) at the retest level.
- The Decision: Best for patient, disciplined traders who prioritize Risk-to-Reward (RR). This filters out many false signals, but you must be prepared to miss the trade if the market drops without looking back.
5.3. Entry Strategy 3: Early Entry at Peak 2 (Aggressive)
Aggressive traders try to “snipe” the very top by entering at the second peak. This strategy does not wait for the neckline break; instead, it anticipates the reversal based on resistance failure.
- The Setup: Watch the price closely as it tests the resistance level of the first peak.
- The Trigger: Look for strong reversal candlesticks (like a shooting star or bearish engulfing) right at the resistance line.
- The Decision: Strictly for experienced traders. You must be skilled at reading candle rejection and historical resistance. It offers the biggest profit potential but carries the highest risk.
5.4. Stop Loss Placement
Effective risk management is vital, and your stop loss (SL) placement should depend on which entry strategy you chose.
- Conservative SL: Place it just above the second peak or the nearest supply zone. If price breaks this high, the reversal pattern has failed.
- Aggressive SL: Place it just above the breakout candle (for Strategy 1), the rejection candle (for Strategy 2), or right above Peak 2 (for Strategy 3) to keep the risk tight.
5.5. Take Profit Targets
You need a clear profit target to lock in gains before the market finds new support. Traders usually combine measured moves with historical levels:
- TP1 (Measured Move): Measure the vertical distance from the peak to the neckline and project it downward from the breakout point.
- TP2 (Support Zones): Look left on the chart to find the next major historical support level where buyers might step in.
- TP3 (Fibonacci): Advanced traders use Fibonacci extensions (like the 1.272 or 1.618 levels) to find extended targets for a longer downtrend.
5.6. Which Double Top Entry Method Is Best for Beginners?
The Neckline Breakout (Strategy 1) is undeniably the best and safest entry method for beginners. Rather than trying to predict the market, it forces you to wait for full mathematical confirmation that the trend has reversed.
As you gain screen time and experience, your entry methods should naturally evolve based on your skill level. Here is the recommended progression path:
- Beginners (The Neckline Breakout): Wait for a candle to close decisively below the neckline. It is the easiest to execute and completely removes the emotional guesswork of “picking the top.”
- Intermediate (The Retest): Wait for the price to break the neckline and pull back to retest it as new resistance. This requires patience and the ability to read candlestick patterns (like pin bars), but it offers a much better Risk-to-Reward ratio and a tighter stop loss.
- Advanced (Peak 2 Aggressive): Entering exactly at the second peak before the neckline even breaks. This is strictly for pro traders who can expertly read volume exhaustion and price rejection at major structural resistance levels.
6. Measured Move: How to Calculate the Double Top Target
Establishing a clear profit target is just as important as finding the entry. The “measured move” technique gives you a specific, mathematical goal based on the pattern’s own structure, rather than relying on subjective guesswork or emotions.
The Measured Move Formula
Target = Breakout Level – (Peak High – Neckline Level)
6.1. Step 1: Measure the Height
First, calculate the vertical distance of the double top pattern. Measure the exact number of pips or points from the absolute highest peak down to the neckline level.
For example: If the asset’s peak is at $150 and the neckline is firmly established at $140, the total height of your pattern is exactly $10.
6.2. Step 2: Project from the Breakout
Next, take that calculated height value and project it downward directly from the breakout point.
Continuing the example: If the neckline breaks at $140, you subtract the $10 height. Your theoretical 100% target is $130.
This traditional calculation assumes that the downward momentum will directly equal the upward momentum that created the pattern. Statistical data from Thomas Bulkowski’s Encyclopedia of Chart Patterns supports this logic, showing that a confirmed Double Top pattern reaches its full measured move target approximately 71% of the time. This high probability proves why establishing a clear mathematical target is superior to emotional guessing.
6.3. Adjust for Volatility (ATR)
Real markets rarely move in perfect straight lines. To be safe and protect floating profits, professional traders view the measured move as a flexible guide, adjusting their final targets based on current market volatility.
- The 70%–80% Approach: Many traders choose to take profit before the full measured move, such as around 70%–80% of the projected distance, especially in slower or choppier conditions. This is a practical trade management technique—not a rigid rule—ensuring you exit the market safely before the bearish momentum runs out of steam.
- Using the ATR Indicator: You can also use the Average True Range (ATR) indicator to create a dynamic safety buffer. Since a double top triggers a short trade, you want your Take Profit to be slightly closer than the full 100% drop. If your full projected target is $130 and the current daily ATR is $2, you simply add 1x ATR to your target ($130 + $2 = $132). Aiming for this slightly smaller drop helps you avoid getting stuck in a sudden bullish reversal just pennies away from your original exit order.
6.4. The Golden Rule: Check Your Risk/Reward Ratio
Even a perfect Double Top setup is not worth trading if the math doesn’t work in your favor. Before pulling the trigger, always ensure a minimum Risk/Reward ratio of 1:1.5 or 1:2.
- The Math: If your potential profit (distance to Target) is smaller than your potential loss (distance to Stop Loss), the trade is mathematically unattractive.
- Piprider Pro Tip: If the volatility is too high and requires a massive stop loss that ruins your R:R ratio, the professional choice is to skip the setup and wait for a better opportunity.
7. Which Techniques Confirm the double top pattern?
Trading a double top without confirmation is risky because the market often fakes a reversal before continuing higher. To filter out these “bull traps,” professional traders look for confluence from these four technical signals.
7.1. Volume Confirmation (The Fuel)
Applying volume analysis is the most important validator. You should look for a specific pattern: decreasing volume on the second peak (showing lack of buyer interest) followed by a massive spike in volume as the price breaks the neckline. High volume on the breakdown confirms that institutions are aggressively selling.
7.2. RSI Divergence (The Early Warning)
The RSI Relative Strength Index often spots the reversal before price action does. Look for bearish divergence: while the price creates two equal highs (the double top), the RSI indicator creates a lower high. This disagreement signals that although price is high, the underlying momentum is dying.
7.3. MACD Bearish Crossover
The MACD indicator (Moving Average Convergence Divergence) provides a clear momentum shift signal. Traders watch for the MACD line to cross below the signal line (a bearish crossover). If this crossover happens at the same time the second peak is forming, it strongly supports the bearish case.
7.4. Trendline Break Confirmation
Before the price even reaches the neckline, it often breaks a major diagonal trendline. Draw a line connecting the lows of the uptrend. A break and close below this rising trendline is usually the first “domino” to fall, warning you that the double top structure is forming and the trend is changing.
8. How Does the Double Top Compare to Similar Patterns?
Traders often confuse the double top with other reversal patterns. Misidentifying the structure can lead to entering trades too early or setting the wrong targets.
Here is a quick comparison guide:
| Pattern | Peaks | Key Characteristics | Market Signal |
|---|---|---|---|
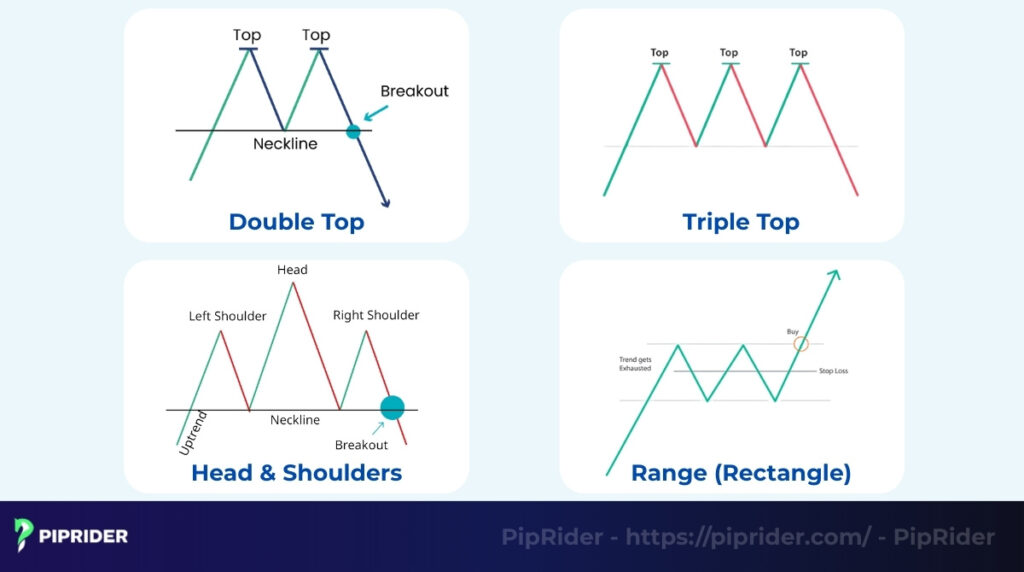
| Double Top | 2 | Two peaks at roughly the same price level. | Standard bearish reversal. |
| Triple Top | 3 | Three failed attempts to break the same resistance. | Stronger reversal (Maximum buyer exhaustion) |
| Head & Shoulders | 3 | Middle peak (Head) is the absolute highest. | Clearest structural reversal (Forms a distinct Lower High) |
8.1. Is a double top the Same as an M-Pattern?
No, context is the key difference. While every double top looks like an “M,” not every “M” on the chart is a Double Top. A valid double top must appear after a clear, extended uptrend. If you see an “M” shape forming in the middle of a sideways consolidation range, it is likely just market noise, not a reversal signal.
8.2. What Is the Difference Between a Double Top and Triple Top?
The difference is the number of failed attempts. A triple top features three distinct peaks hitting the same resistance level instead of two. It represents a longer battle between buyers and sellers. Because the resistance has held three times, the eventual breakdown from a triple top is often more explosive than a double top.
8.3. How Does it Differ from a Head and Shoulders?
The main difference is the height of the middle peak. In a Double Top, the two peaks are roughly equal. In a head and shoulders pattern, the middle peak is significantly higher than the left and right peaks. This indicates a failed higher high, whereas a double top shows a failure to even make a higher high.
9. Common Mistakes Traders Make With Double Tops
Even when the chart presents a perfect setup, human error can easily ruin the trade. Most losses come from impatience or poor risk management. Make sure you are not sabotaging your own capital by committing these four execution mistakes:
- Entering Too Early (FOMO): Selling the exact moment price touches Peak 2 without waiting for rejection confirmation or the neckline break. The market frequently blasts through resistance, turning your premature short into trapped liquidity.
- Ignoring Context: A double top must reverse a prior uptrend. Trading an “M” shape that appears randomly in a sideways, choppy market is a surefire way to lose money. It is just random noise, not a valid signal.
- Disregarding Volume: Peak 2 requires lower volume than Peak 1. If you see high, aggressive buying volume forming on the second peak, it completely invalidates the bearish setup.
- Setting Stop-Losses Too Tight: Placing your stop-loss exactly at the high of Peak 2 is an open invitation for “stop hunting.” With algorithmic trading now accounting for roughly 70% of spot FX volume (according to institutional market data), automated systems are specifically programmed to sweep liquidity pools resting just above obvious resistance levels. Always give your trade breathing room by placing stops slightly higher or using the ATR indicator (e.g., adding a buffer of 15 to 20 pips above the absolute high).
10. When Does a Double Top Pattern Fail?
Even the most textbook double top is not immune to market manipulation or overwhelming momentum. Understanding how and why this pattern fails structurally is what separates amateur retail traders from professionals. A pattern failure usually falls into one of these four categories:
10.1. Structural Failure (The Flawed Setup)
This happens when the pattern is fundamentally invalid from the start. If the peaks are wildly uneven (e.g., Peak 2 is far below Peak 1), it is not a double top; it is simply a “lower high” in an ongoing downtrend. If you misidentify the structure, the pattern didn’t fail—the analysis did.
10.2. Failure by No Neckline Break (The Range Bound)
An “M” shape on the chart means nothing until support is decisively broken. If the price pulls back from the second peak but finds strong buying pressure at the neckline, the pattern fails to trigger. The market is not reversing; it is simply entering a period of horizontal consolidation.
10.3. Failure by Reclaim After Breakdown (The Bear Trap)
This is the most painful type of failure. The price breaks below the neckline, seemingly confirming the reversal, and retail traders rush to enter short positions. However, the breakdown happens on weak volume. The market quickly reverses, reclaiming the neckline and closing back above support. This creates a massive Bear Trap, capturing short sellers and often leading to a violent squeeze to the upside.
10.4. Failure in a Strong Trend Continuation
Sometimes, the underlying macroeconomic trend is simply too bullish. The double top forms merely as a temporary pause to shake out weak hands. Once the market absorbs the selling pressure, institutional buyers step back in with immense volume, completely overriding the bearish technical signal and driving the price to new highs.
11. Best Timeframes for Double Top Patterns
While a Double Top can technically form on any chart, its reliability and profit potential change drastically depending on the timeframe you choose. In technical analysis, time equals conviction: The longer a pattern takes to develop, the more significant the eventual breakout will be.
11.1. Swing Trading: The “Gold Standard” (H4 & Daily)
For traders looking for high-probability setups with significant price moves, the 4-hour (H4) and Daily (D1) charts are the undisputed favorites. These timeframes allow the market enough time to flush out retail “noise” and establish true institutional resistance.
- Why it works: A Double Top on a Daily chart represents weeks of distribution. When it breaks, it often signals a long-term trend reversal that can last for months.
- The Benefit: You get much higher success rates and larger profit targets. It is the perfect environment for applying the “80% Measured Move” rule with confidence.
11.2. Day Trading: The Tactical Middle (H1 & M15)
Intraday traders often use the 1-hour (H1) and 15-minute (M15) charts to catch smaller, tactical reversals within the daily range. While these patterns appear more frequently, they require a much higher level of precision.
- The Strategy: On these timeframes, confirmation is mandatory. You cannot afford to skip the volume check or the RSI divergence verification.
- The Challenge: You are competing with high-frequency algorithms. To win here, your entry must be perfectly timed at the candle close below the neckline to avoid getting caught in a “lunch hour” fakeout.
11.3. Scalping: The High-Risk Zone (M5 & Below)
Double Tops on the 5-minute (M5) or 1-minute (M1) charts are notoriously difficult to trade and are often the site of massive “Bear Traps.” At this speed, price action is dominated by minor order flow rather than major structural shifts.
- The Risk: These patterns fail frequently because a single large buy order can easily invalidate the resistance. Low timeframe Double Tops are prone to “V-shaped” recoveries that don’t respect technical levels.
- Piprider Pro Tip: Never trade a 5-minute Double Top in isolation. Only take the trade if it aligns with a major resistance zone found on a higher timeframe (like the H4 or Daily). If the “big picture” isn’t bearish, the M5 pattern is likely just a trap.
12. Real-World Execution Examples
Theory is completely useless unless you can apply it to a live, breathing chart. Moving from a perfect textbook diagram to real market conditions requires adjusting for volatility, market hours, and the specific behavior of different assets.
Below are three real-world execution breakdowns across Forex, Stocks, and Cryptocurrency. Notice how the core logic of the Double Top remains the same, but the specific trade management—such as stop-loss placement, target selection, and invalidation rules—adapts to each unique market environment.
12.1. Forex Example (EUR/USD on the 4H Chart)
According to the latest Bank for International Settlements (BIS) 2025 Triennial Survey, the global FX market processes an astonishing $9.6 trillion in average daily trading volume. In such a massive, highly liquid environment, lower timeframes are dominated by high-frequency trading and algorithmic noise. This is why using the 4-hour chart for swing trading is highly reliable for spotting genuine institutional shifts and managing the risk of sudden news-driven fakeouts.
- The Setup: EUR/USD is in a clear uptrend. It hits resistance at 1.1000 (Peak 1), pulls back to 1.0900 (Neckline), and rallies back to 1.0995 (Peak 2) on lower volume.
- The Trigger: A 4-hour candle closes decisively below the 1.0900 neckline.
- Stop Loss: 1.1015 (Placed slightly above the resistance zone of Peak 1 and Peak 2 to avoid standard algorithm stop hunts).
- Target 1 (Measured Move): 1.0800. The height is 100 pips (1.1000 – 1.0900). Projected downward from the breakout: 1.0900 – 100 pips = 1.0800.
- Target 2 (Historical Support): 1.0750 (The next major daily support level, identified by looking left on the chart).
- Setup Invalidation: The price drops to 1.0890 but immediately violently rejects, closing back above the 1.0900 neckline. The setup is canceled as support has held.
12.2. Stock Market Example (AAPL on the Daily Chart)
Equities are heavily driven by institutional flows and fundamental catalysts like earnings reports. This Apple (AAPL) daily chart setup demonstrates how to trade a double top when fundamental momentum dries up and open gaps become prime Take Profit targets.
- The Setup: Apple (AAPL) rallies heavily into an earnings report. It peaks at $180, drops to build support at $170, and forms a second peak at $179.
- The Trigger: The daily candle breaks and closes below the $170 support level.
- Stop Loss: $182 (Using the ATR indicator to add a safe buffer above the $180 psychological resistance level).
- Target 1 (80% Rule): $162. Full measured move is $10 ($180 – $170). The 80% safe target is an $8 drop from the $170 breakout.
- Target 2 (Gap Fill): $155 (An open gap left on the chart from a previous earnings report, which acts as a powerful magnet for price).
- Setup Invalidation: On the formation of Peak 2, the buying volume is massively higher than Peak 1. This shows buyers are still fully in control, invalidating the bearish bias.
12.3. Crypto Market Example (BTC/USD on the Daily Chart)
Cryptocurrency is notorious for violent volatility and liquidity sweeps. Trading a Bitcoin (BTC) double top requires much wider stop-losses to survive the noise, and a keen eye on weekend volume anomalies to avoid getting trapped.
- The Setup: Bitcoin surges to $65,000, sharply corrects to $60,000, and attempts another rally but fails at $64,800 (Peak 2), showing massive bearish divergence on the RSI.
- The Trigger: A daily candle closes firmly below the $60,000 neckline.
- Stop Loss: $65,500. Stops must be placed well above the structural highs to survive aggressive wick sweeps.
- Target 1 (Measured Move): $55,000. The $5,000 height projected downward from the $60,000 breakout.
- Target 2 (Major Zone): $52,000 (A key Fibonacci retracement level aligned with an old accumulation zone).
- Setup Invalidation: The price breaks $60,000 but it happens over a weekend with extremely flat, zero-conviction volume. In crypto, low-volume weekend breakdowns often scream “fakeout.”
13. Frequently asked questions about Double Top Pattern
Traders often have questions about reliability, timing, and context. Here are the answers to the most common questions.
14. Conclusion
The double top pattern is a reliable reversal signal, but only when confirmed. To avoid expensive “bull traps,” always wait for a clear neckline breakdown supported by volume or RSI divergence.
Don’t guess the top. Wait for confirmation, use the Measured Move for targets, and trade with discipline. Ready to master more trading patterns? Explore the comprehensive trading guides and strategies at Piprider today.


