
The Dead Cat Bounce pattern is one of the most deceptive traps in a bear market, often tricking traders into believing a crash has ended. This guide provides a comprehensive framework for distinguishing these fake rallies from genuine market bottoms, using volume analysis and technical confirmation to execute high-probability short trades.
By understanding the mechanics of this bearish continuation pattern, you can avoid the “FOMO” buying that leads to significant losses and instead learn to capitalize on the market’s eventual resumption of the downtrend.
Key Takeaways
- Bearish continuation: The Dead Cat Bounce is a temporary recovery that typically appears after a sharp market crash, signaling that the downtrend is likely to resume.
- Resistance failure: While the price bounces, it fails to break through key technical resistance levels, indicating a lack of sustained buying pressure.
- Volume divergence: Trading volume often decreases during the recovery phase, exposing the rally as a “bull trap” driven by short-covering rather than new demand.
- Confirmation is critical: The pattern is only fully confirmed once the price breaks below the previous “bounce low,” triggering a potential short-selling opportunity.
Quick Rules for a Valid Dead Cat Bounce
Before diving into the deep technical analysis, use these four essential criteria to determine if a setup is a valid Dead Cat Bounce or a potential reversal.
- Prior sharp plunge: The pattern must be preceded by a steep, significant decline (often characterized by panic selling and extreme oversold conditions).
- Weak, low-volume rally: The bounce should appear “hollow,” with trading volume drying up as the price moves higher, suggesting institutional players are not buying.
- Rejection at resistance: The price must fail to hold above a clear resistance zone, such as a major Moving Average (20 or 50 EMA) or a Fibonacci Retracement level (38.2% or 50%).
- Confirmed breakdown: A valid setup is only tradeable after the price breaks and closes below the initial low of the bounce; never preempt the move without this confirmation.
1. What Is a Dead Cat Bounce Pattern?
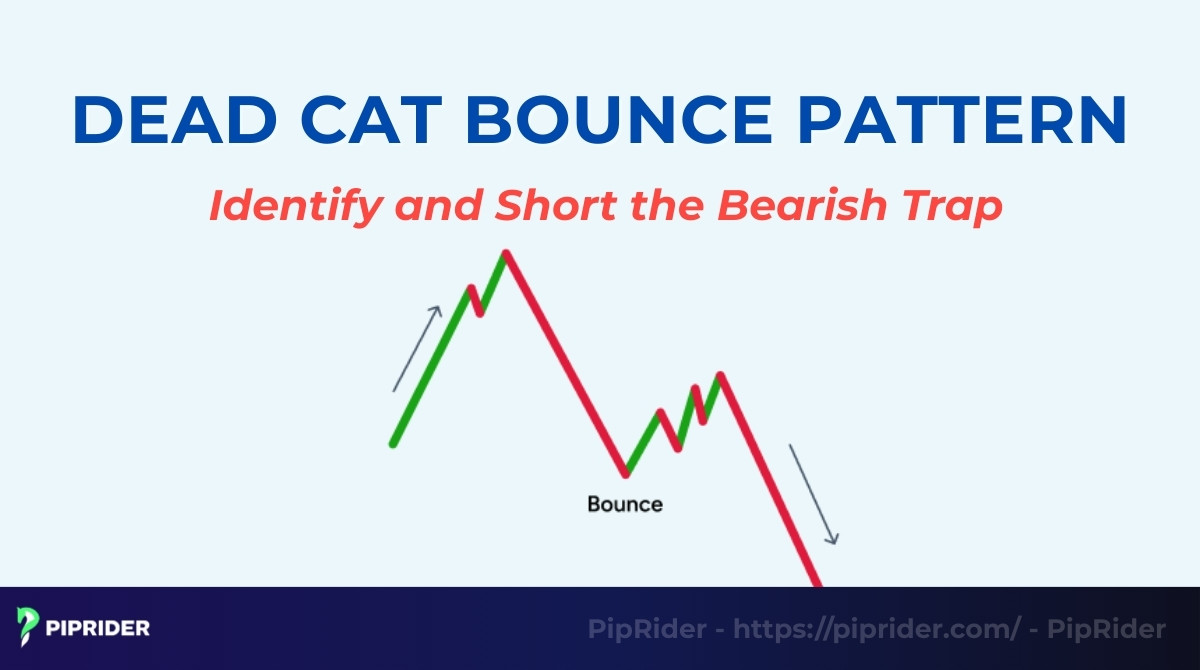
The Dead Cat Bounce is a technical phenomenon characterized by a short-lived recovery in the price of a declining asset, followed by a continuation of the prevailing downtrend. This section defines the pattern’s origin and explores why it is a high-risk trap for unconfirmed “bottom fishing” strategies.
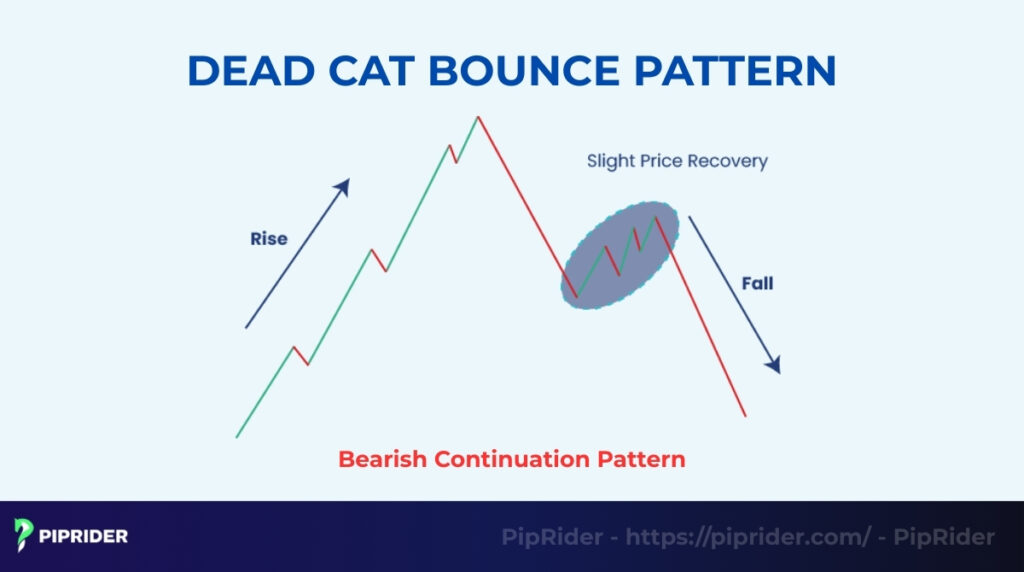
In technical analysis, it is strictly classified as a bearish continuation pattern. This means that despite the upward price movement, the primary market trend remains down. The rally is typically driven by short-term technical factors such as overextended sell-offs or short-covering—rather than a fundamental shift in the asset’s value.
The term originates from a well-known Wall Street proverb: “Even a dead cat will bounce if it falls from a great height” (Chen, 2025). This macabre imagery serves as a stark warning to traders that a rising price after a crash does not inherently signify a healthy recovery; it may simply be the mechanical reaction of an asset “hitting the floor” before gravity pulls it lower.
1.1. Why It’s Not a Bullish Reversal
Traders often mistake a Dead Cat Bounce for a “V-shaped” market reversal, but the underlying mechanics are fundamentally opposite. Distinguishing between the two is the difference between catching a trend and “catching a falling knife.”
- Volume profile: A genuine bullish reversal is backed by expanding volume, which proves that institutional buyers are stepping in with conviction. In contrast, a Dead Cat Bounce typically occurs on low or declining volume. This lack of participation suggests that “smart money” is staying on the sidelines, leaving the rally vulnerable to a sudden collapse.
- Interaction with resistance: A true reversal possesses enough momentum to break through and hold above significant resistance levels. A Dead Cat Bounce, however, tends to stall at the first major obstacle—such as a 20-period Exponential Moving Average (EMA) or a key Fibonacci retracement level—before rolling over.
1.2. The Bull Trap Concept Behind the Pattern
The primary danger of this pattern is its role as a “bull trap,” a scenario where traders are lured into buying long, only for the price to reverse and trap them in losing positions.
- The Lure: Following a sharp crash, the asset appears “cheap” or “oversold” on technical indicators like the RSI. This attracts retail traders and “bottom fishers” who hope to buy at the absolute low.
- The Trap: Professional sellers and institutions often use this temporary surge in retail liquidity to exit remaining positions or open fresh short positions at more favorable prices. When the price inevitably breaks below the low of the bounce, these new buyers are forced to sell in panic, adding fuel to the next leg of the crash.
2. How Does the Dead Cat Bounce Pattern Form?
The formation of a Dead Cat Bounce follows a predictable cycle driven by shifting market sentiment and technical triggers. This section breaks down the four distinct phases of the pattern to help you identify the trap as it unfolds.
The 4-Phase Cycle Summary
| Phase | Event | Market Sentiment |
|---|---|---|
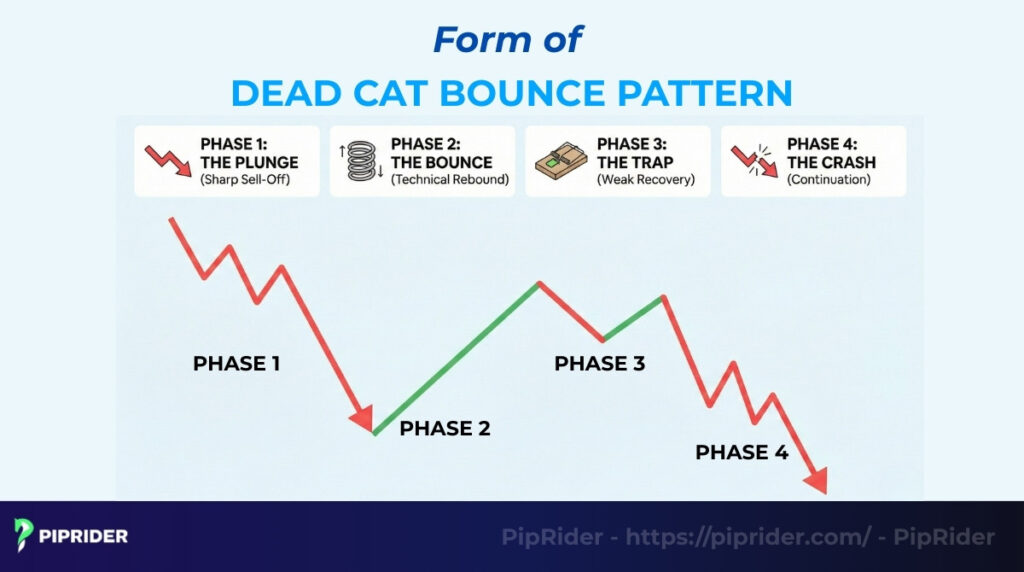
| Phase 1 | The Plunge | Panic selling and extreme fear. |
| Phase 2 | The Bounce | Short-covering and initial bottom fishing. |
| Phase 3 | The Trap | False hope; price stalls on low volume. |
| Phase 4 | The Crash | Continuation of the downtrend; new lows. |
Phase 1: The Plunge (Sharp Sell-Off) The cycle begins with a violent, aggressive decline, often triggered by negative news or a breakdown of long-term support. During this phase, price action is nearly vertical, and technical indicators like the RSI frequently plunge deep into oversold territory (often below 30). The volume is typically high as investors panic-sell to exit their positions.
Phase 2: The Bounce (Technical Rebound) After the initial bloodbath, the price experiences a sudden, sharp uptick. This is rarely caused by long-term investors. Instead, it is primarily driven by “short covering.” Traders who profited from the drop must buy back shares to close their positions, creating artificial buying pressure that pushes the price higher.
Phase 3: The Trap (Weak Recovery) As the short-covering ends, the rally loses its momentum. The price may drift slightly higher, but the “tell” is the volume: it dries up significantly. Institutional money is absent, and the move is sustained only by retail traders hoping for a reversal. The price approaches key resistance zones but lacks the “buying power” to break through.
Phase 4: The Crash (Continuation) The trap finally snaps shut when the price reaches a point of exhaustion. As the price fails at resistance and begins to dip, the retail buyers from Phase 3 realize they are on the wrong side of the trade. Their subsequent panic selling, combined with new short entries from professional traders, drives the price below the previous low, confirming the pattern and resuming the dominant downtrend.
3. What Is the Market Psychology Behind a Dead Cat Bounce?
The Dead Cat Bounce is a psychological battleground where the hope of retail traders often collides with the calculated strategies of institutional investors. Understanding the emotional and technical drivers behind this pattern is essential for recognizing why these rallies ultimately fail.
This movement is primarily fueled by three psychological and mechanical forces: anchoring bias, short-covering, and institutional liquidity hunting.
3.1. The Retail Trap: Anchoring Bias and FOMO
Inexperienced traders often fall victim to “Anchoring Bias,” a cognitive trap where they fixate on an asset’s recent all-time high or a specific price level before the crash. When the price drops significantly, they perceive the asset as a “bargain” relative to that anchor point. Driven by the Fear of Missing Out (FOMO) on a perceived bottom, their emotional buying provides the initial spark for the bounce, mistaking a technical reset for a V-shaped recovery.
3.2. The Mechanical Trigger: Short Covering
The initial rally is rarely supported by fundamental improvements. Instead, it is often triggered by a “short squeeze” or simple profit-taking by those who shorted the asset at the peak. To lock in their gains, short sellers must buy back shares or contracts. This mechanical buying pressure creates an artificial surge in price—a mirage of strength that lacks the sustained demand required for a true trend reversal.
3.3. The Institutional Setup: “Selling the Rip”
While retail traders are buying the “discount,” institutional “Smart Money” views the rally through a different lens. They see the bounce as a liquidity event—a second chance to exit losing long positions or to open fresh short positions at higher prices. Once this professional selling pressure absorbs the limited retail buying power, the temporary support collapses, and the primary downtrend resumes with renewed intensity.
4. Dead Cat Bounce vs. Real Reversal: How to Tell the Difference
One of the most critical challenges for any trader is distinguishing a high-risk bull trap from a genuine market bottom. While they may look similar in the early stages, several technical “tells” can help you identify a sustainable trend reversal.
- Support stability: In a Dead Cat Bounce, the price may stop falling momentarily, but the support is fragile. Once the bounce ends, the price typically crashes through the previous low without hesitation. In a Real Reversal, the price often retests the previous low and holds, creating a “Higher Low” or a “Double Bottom” structure, indicating that the selling pressure has been fully exhausted.
- Volume conviction: Volume acts as the “lie detector” of price action. A Dead Cat Bounce usually occurs on thin, declining volume; the higher the price goes, the fewer participants are willing to buy. Conversely, a Real Reversal is characterized by a surge in volume as price increases, proving that institutional investors are committing capital to the new upward trend.
- Structural breakout: A Dead Cat Bounce remains trapped under dynamic resistance levels, such as the 20-day or 50-day Exponential Moving Average (EMA). It typically fails at these levels and rolls over. A Real Reversal involves a decisive break above these key resistance zones, often followed by a successful retest where the old resistance flips into new support.
- Momentum and Divergence: Traders should look for “Bullish Divergence” on oscillators like the RSI or MACD. In a Dead Cat Bounce, momentum indicators simply reset from oversold levels without showing strength. In a Real Reversal, you will often see the RSI making higher lows while the price makes lower lows, suggesting that the downward momentum is fading and a trend change is imminent.
5. Key Characteristics of a Valid Dead Cat Bounce
To effectively trade this pattern, you must distinguish between a typical price correction and a high-probability “dead cat” setup. This section outlines the specific technical conditions that must be met before a rally can be classified as a bearish continuation trap.
Not every recovery in a downtrend is a shorting opportunity. A valid Dead Cat Bounce requires a specific confluence of price action, volume, and resistance interaction. Use the following checklist to verify the validity of the setup.
The Validity Checklist
| Criterion | Technical Requirement | Why it Matters |
|---|---|---|
| Market Context | Follows a steep, aggressive downtrend | The pattern is only valid if it occurs after a significant “plunge” that has exhausted initial buyers |
| Volume Profile | Rally occurs on declining or low volume | A “hollow” rally without institutional participation is highly likely to fail |
| Resistance Cap | Fails at key EMA or Fibonacci retracement levels | If the bounce cannot break through the 20-day EMA or 50% Retracement, the bears remain in control |
| Final Confirmation | Price breaks below the initial bounce low | The setup is not tradeable until the market makes a new lower low, confirming the resumption of the trend |
6. When the Pattern Is Weak or Invalid (Red Flags)
Identifying a “failed” Dead Cat Bounce is just as important as finding a valid one. If the following “Red Flags” appear during a rally, the bearish continuation thesis is weakened, and shorting the asset becomes significantly higher risk.
In these scenarios, the market may be transitioning from a downtrend into a new accumulation phase or a full bullish reversal.
- Expanding Bullish volume: If the price begins to rise and trading volume increases significantly (relative to the preceding crash), this is a major warning sign. High-volume rallies suggest that “Smart Money” is actively accumulating the asset rather than just covering short positions. This suggests a shift in conviction from sellers to buyers.
- Decisive break above major resistance: The hallmark of a Dead Cat Bounce is its inability to sustain a move above resistance. If the price breaks above the 50-day EMA or the 61.8% Fibonacci retracement level and, more importantly, stays there, the bearish trap logic is invalidated. This structural change indicates that the “ceiling” has been broken and a new trend may be forming.
- Clear Bullish divergence: Watch your momentum oscillators (RSI, MACD). If the price makes a new low during the initial crash, but the oscillator makes a higher low, this is “Bullish Divergence.” It indicates that the selling momentum is waning. Rallies following a clear divergence are more likely to lead to a real bottom than a temporary bounce.
- Broad and Persistent Price structure: A Dead Cat Bounce is typically sharp and short-lived. If the price begins to move sideways in a tight range (consolidation) for an extended period or forms a series of higher highs and higher lows, it is no longer a “bounce.” This behavior suggests the market has found a stable floor and is no longer in a “plunge” state.
- Lack of a Lower Low: The most definitive red flag is the failure to break the previous low. If the price returns to the bottom of the initial crash but holds as support—forming a Double Bottom—the Dead Cat Bounce pattern has failed. Without a breakdown, there is no confirmation for a short entry.
7. Dead Cat Bounce vs. Similar Patterns: How to Avoid Confusion
Mistaking a Dead Cat Bounce for a genuine market reversal is one of the most costly errors a trader can make. This section provides a categorical comparison to help you distinguish a bearish continuation trap from other common market structures.
The key to identification lies in observing the “tell”—the specific behavior of volume, duration, and price interaction with support and resistance levels.
Comparison Summary Table
| Pattern | The “Tell” (Key Difference) | Primary Directional Bias |
|---|---|---|
| Dead Cat Bounce | Low-volume recovery that fails at resistance | Bearish (Continuation) |
| Bear Market Rally | Lasts longer (weeks/months); fundamentally driven | Bearish (Long-term) |
| Double Bottom | Respects and holds the previous low (“W” shape) | Bullish (Reversal) |
| V-Shaped Recovery | Massive volume spike; breaks resistance instantly | Bullish (Reversal) |
7.1. Dead Cat Bounce vs. Bear Market Rally
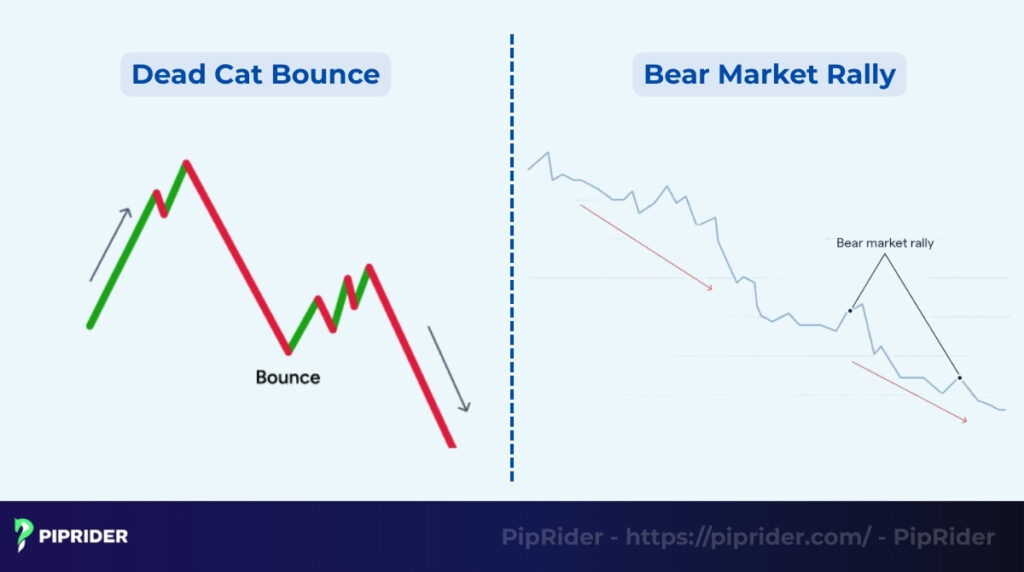
While both occur within a downtrend, they differ in scale. A Dead Cat Bounce is a sharp, technical reaction lasting days to weeks, driven largely by short-covering. A Bear Market Rally is more structural, often lasting months and retracing a significant portion of the initial decline (sometimes 20% or more), which frequently misleads investors into believing a new bull market has begun.
7.2. Dead Cat Bounce vs. Double Bottom
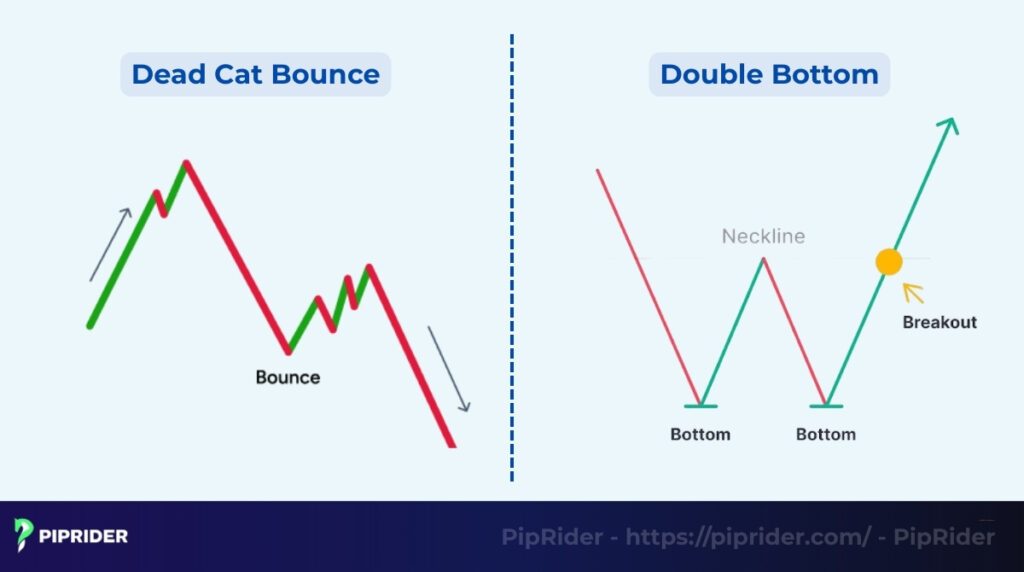
The critical differentiator here is the support level. In a Dead Cat Bounce, the price rallies briefly but fails to hold support, eventually breaking to new lows. In a Double Bottom, the price returns to the initial low, finds strong buying interest, and bounces back up to form a “W” structure. If the support holds, it is a reversal; if it breaks, the Dead Cat is confirmed.
7.3. Dead Cat Bounce vs. V-Shaped Recovery
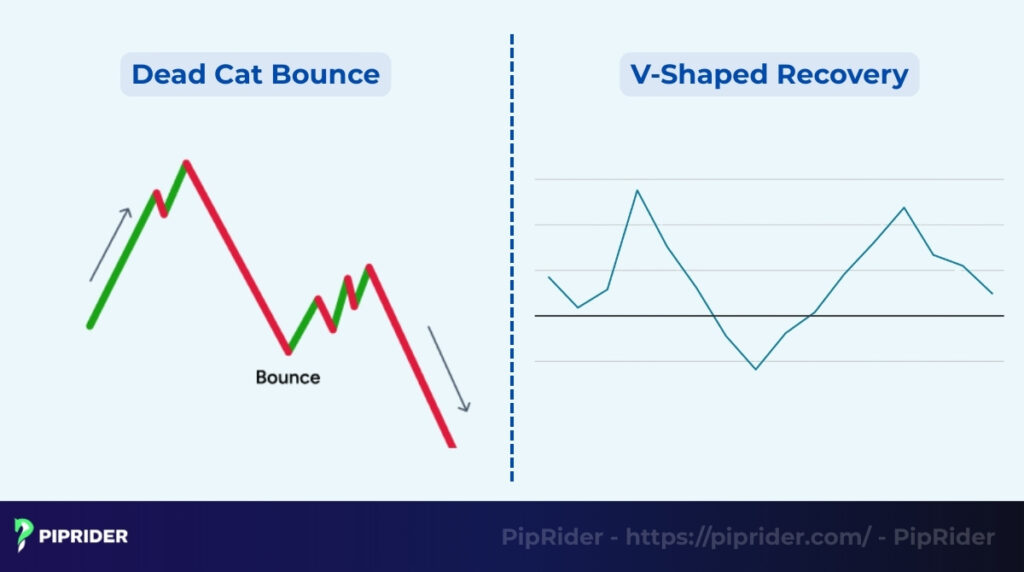
Volume and momentum serve as the primary filters. A V-Shaped Recovery is characterized by explosive, sustained buying volume that smashes through resistance levels without a significant pause. A Dead Cat Bounce rises on anemic or declining volume, signaling a lack of institutional conviction that eventually leads to exhaustion and failure.
7.4. Dead Cat Bounce vs. Corrective Wave (Elliott Wave)
For advanced technical analysts, a Dead Cat Bounce typically corresponds to a “Wave B” within an A-B-C correction or a minor corrective wave within a larger impulsive downtrend. Following the completion of the bounce, the market enters “Wave C,” which is traditionally the most aggressive and devastating leg of the decline.
8. How to Trade a Dead Cat Bounce Step-by-Step
Executing a successful trade on a Dead Cat Bounce requires a disciplined approach to confirmation. This workflow ensures you are entering a high-probability continuation rather than guessing the top of a rally.
- Confirm the initial plunge: Identify a sharp, aggressive sell-off where the price has dropped significantly from a recent peak, leaving the market in an oversold state.
- Mark resistance zones: Identify key levels where the bounce is likely to fail. This includes previous support-turned-resistance levels, the 20-day EMA, or the 38.2%/50% Fibonacci retracement levels.
- Analyze the rally volume: Monitor trading volume as the price bounces. If the price rises while volume contracts, you have confirmed the “hollow” nature of the rally.
- Wait for the trigger: Look for a bearish signal. This could be a price rejection (long upper wick) at a resistance zone or a decisive breakdown below the “bounce low.”
- Select your entry strategy: Choose between a breakdown entry (standard), a retest entry (conservative), or fading the bounce (aggressive) based on your risk tolerance and the market’s volatility.
- Set protection and targets: Immediately place a stop-loss above the peak of the bounce and define your profit targets based on the previous low or a measured move projection.
9. How Should You Trade the Dead Cat Bounce Pattern?
Trading a Dead Cat Bounce requires a disciplined transition from “buying the dip” to “selling the rip.” Since this is fundamentally a bearish continuation pattern, the objective is to time the resumption of the crash rather than attempting to profit from the temporary, high-risk recovery.
Effective execution depends on choosing an entry method that balances the need for confirmation with the desire for a favorable risk-to-reward ratio.
9.1. Strategy 1: The Breakdown Short (Best for Beginners / Cleanest Confirmation)
Commonly referred to as the “Gold Standard,” the breakdown entry waits for the market to prove that the “dead cat” has finished bouncing. This strategy removes much of the guesswork associated with timing a top.
- The trigger: You enter a short position the moment the price breaks and closes below the lowest point of the initial crash (the Phase 1 low).
- Logical reasoning: A break below this level signifies that the technical rebound has completely failed and that new selling pressure is sufficient to drive the market to fresh lows. It confirms the downtrend has officially resumed.
9.2. Strategy 2: The Retest Short (Best for Patient Traders / Higher Risk-Reward)
This conservative approach relies on the “Polarity Principle”, where a broken support level often transforms into a new resistance level. It is designed to filter out “false breakdowns”.
- The trigger: After the price breaks below the initial low, you do not enter immediately. Instead, you wait for a minor “relief rally” to retest that broken support from underneath. You enter the short only when the price touches this level and shows signs of rejection (such as a bearish candlestick).
- The trade-off: While this provides a much better entry price and a tighter stop-loss, there is a risk that a violent market crash will never return to retest the level, causing you to miss the move entirely.
9.3. Strategy 3: Fading the Bounce (Professional Only / Requires Candlestick Confirmation)
This is an aggressive, anticipatory strategy used by experienced traders to “short the top” of the recovery before the breakdown even occurs.
- The Trigger: You enter a short position when the rally approaches a major technical “ceiling,” such as a 50% Fibonacci retracement level or the 20-day Exponential Moving Average (EMA).
- Confirmation: To reduce risk, professionals wait for a bearish reversal signal—like a Shooting Star, Bearish Engulfing, or Gravestone Doji—at these resistance zones to confirm that the buyers have exhausted their strength.
9.4. Stop Loss Placement (Protecting Capital)
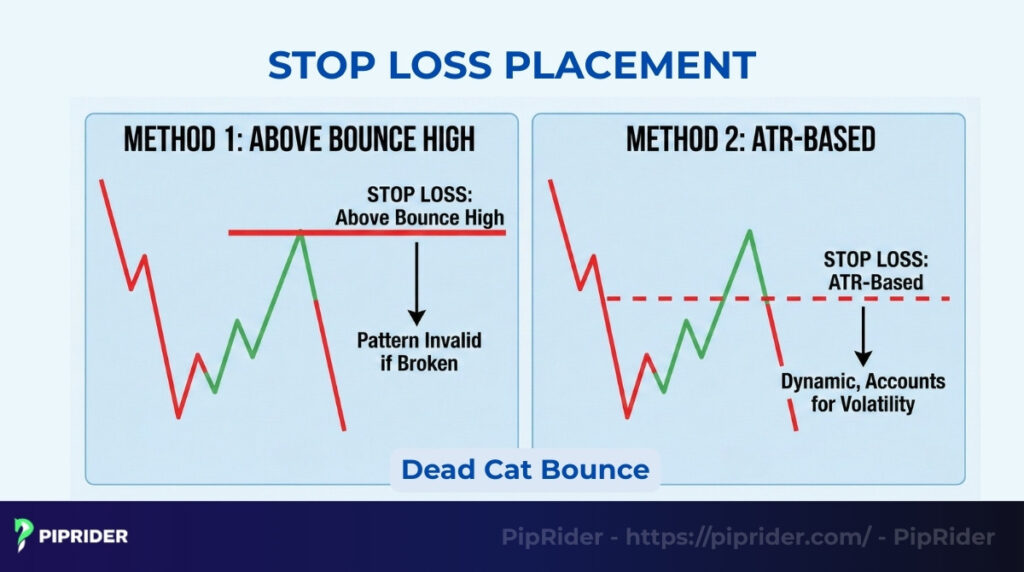
Because short-selling carries significant risk if the market suddenly reverses (a “short squeeze”), a precise and non-negotiable stop-loss is mandatory for every trade.
- Above the Bounce High: The most logical place for a stop-loss is just above the highest peak of the recovery rally. If the price manages to break above this point, the Dead Cat Bounce thesis is invalidated, as the market is showing structural strength.
- ATR-Based Stops: For volatile markets like Crypto or certain Forex pairs, traders often use the Average True Range (ATR) to add a “buffer” to their stop-loss. This prevents being stopped out by random market noise or minor price spikes.
9.5. Take Profit Strategy
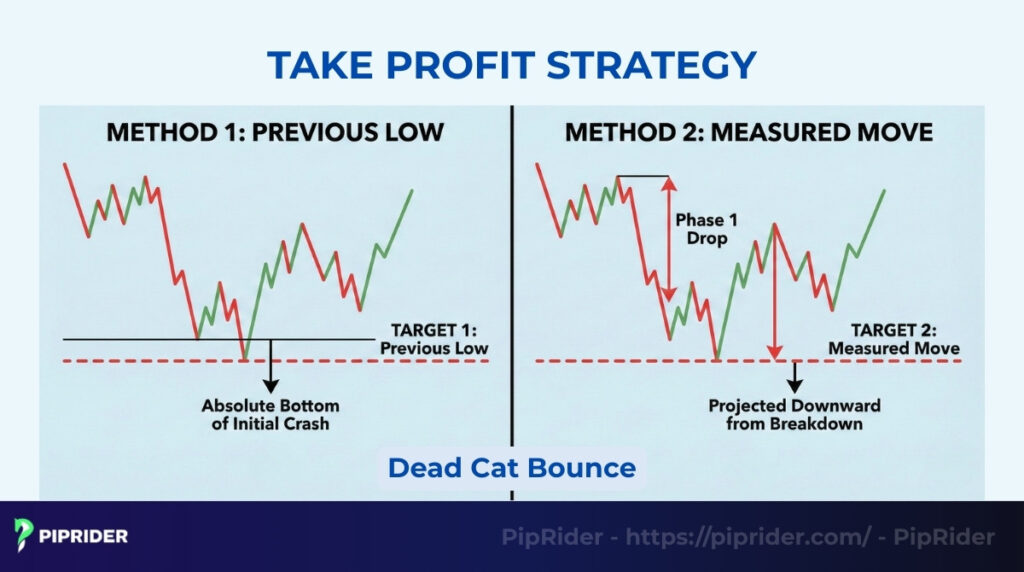
Profit targets should be based on objective chart structure rather than emotional expectations. A common method is to use the initial move as a guide for the next leg down.
- Target 1 (Previous low): The first target is usually the bottom of the initial crash. This is where “bottom fishers” may attempt to support the price again.
- Target 2 (The measured move): For a primary target, calculate the distance of the initial “Plunge” (Phase 1). Project that same distance downward from the peak of the bounce. Historically, continuation patterns often replicate the magnitude of the first move in the second leg of the crash.
10. Which Dead Cat Bounce Setup Is Best for Beginners?
If you are new to trading bearish patterns, the Breakdown Short (Strategy 1) is the most recommended approach. This section explains why prioritizing confirmation is the safest path for novice traders to avoid the psychological traps of a bear market.
The greatest challenge for a beginner is the urge to “pick the top” of a bounce. This often leads to entering a short position too early, only to be stopped out as the rally continues higher than expected. By waiting for a Confirmed Breakdown (a close below the previous low), you are letting the market prove that the bears are back in control. While you give up a small portion of the potential profit, you gain a significantly higher probability of trade success.
To keep your trading simple and objective, follow this three-step rule for your first few Dead Cat Bounce trades:
- Do not “Fade”: Avoid trying to guess where the rally will end. Ignore Fibonacci levels for entry and focus solely on the price floor.
- Wait for the Daily Close: Ensure the price doesn’t just “wick” below the low; wait for a candle to close below it to avoid a “Bear Trap.”
- Fixed Risk: Always use the “Above the Bounce High” stop-loss method. It provides a clear, binary signal: if that high is broken, the trade was wrong, and you should exit immediately.
11. Which Indicators Best Improve Dead Cat Bounce Accuracy?
While price action identifies the structure of a Dead Cat Bounce, technical indicators provide the necessary context to determine the “strength” of the move. Using a confluence of indicators helps traders separate a hollow bull trap from a high-conviction trend reversal.
The following table summarizes the primary technical filters used to confirm that a rally is likely to fail.
Indicator Confirmation Table
| Indicator | The Signal to Look For | Market Meaning |
|---|---|---|
| Volume | Declining volume as price rises | Lack of institutional buying; “hollow” rally |
| RSI | Rebounds to 40–50 (Neutral) with no divergence | Momentum is resetting for the next drop, not reversing |
| MACD | Weak/flat histogram during the bounce | Bulls lack the power to sustain upward pressure |
| EMA | Price rejection at 20 or 50-period EMA | Dynamic resistance remains dominant; trend stays bearish |
- Volume (The “Lie Detector”): Volume is the most critical secondary filter. In a valid Dead Cat Bounce, the rally should occur on significantly lower volume than the preceding crash. This divergence indicates that the upward movement is driven by a lack of immediate sellers rather than a genuine influx of buyers. If volume expands during the bounce, the pattern is likely invalid.
- RSI Bearish reset: During the initial plunge, the Relative Strength Index (RSI) often drops into extreme oversold territory (below 30). In a Dead Cat Bounce, the RSI will rise back toward the 40–50 level simply to relieve technical pressure. A key red flag is the absence of “Bullish Divergence”; if the price makes a new low but the RSI doesn’t show strength, the downtrend is still intact.
- EMA Dynamic resistance: Professional traders often use Exponential Moving Averages (EMAs) as “ceilings” for the bounce. The 20-period EMA typically acts as the first line of defense for bears. If the price touches this line and produces a bearish reversal candle (like a Shooting Star), it provides a high-probability trigger for a short entry.
12. Best Timeframes and Markets for the Pattern
The reliability of a Dead Cat Bounce setup varies significantly depending on the timeframe of the chart and the specific characteristics of the asset class. Understanding these nuances is essential for avoiding market “noise.”
For high-probability trades, the Daily (D1) and 4-Hour (H4) timeframes are considered the most reliable. These higher timeframes filter out the intraday volatility that can create “fake” bounces. While Dead Cat Bounces do occur on lower timeframes like the 15-minute chart, they are often prone to “whipsaws” and lack the structural significance of a multi-day move.
Market-Specific Nuances
- Equities (Stocks): In the stock market, these patterns are frequently triggered by “Gap Downs” following negative earnings reports. The bounce often attempts to “fill the gap” before the selling pressure resumes.
- Cryptocurrency: Crypto markets are known for extreme volatility, meaning Dead Cat Bounces can be exceptionally violent, sometimes recovering 20% to 40% of the crash in a few days. Traders must be cautious not to mistake this high volatility for a permanent trend change.
- Forex: In currency trading, these patterns are usually driven by sudden shifts in central bank policy or global risk sentiment. Pairs involving “safe-haven” currencies (like JPY or USD) often show clean retests of broken support levels.
13. Real Chart Examples: Seeing the Trap in Action
The Dead Cat Bounce is a chameleon that shifts its appearance based on market liquidity. By analyzing execution-focused examples, traders can learn to spot the “trigger” before the trap snaps shut.
13.1.Forex Example: GBP/JPY (The “Kiss of Death” Retest)
- Context: After a period of stability, a major shift in risk sentiment caused GBP/JPY to break below a critical weekly support level at 150.00.
- Why it was a DCB: The initial 400-pip drop left the pair oversold. The subsequent rally back to 150.00 occurred on low conviction, failing to break back above the old support.
- Trigger: A “Bearish Pin Bar” formed exactly at the 150.00 level (previous support turned resistance).
- Entry: Short entry at the close of the Pin Bar.
- Result: The bounce failed, and the pair resumed its downtrend, falling an additional 300 pips.
13.2. Crypto Example: Bitcoin (The 0.5 Fibonacci Trap)
- Context: Bitcoin experienced a sudden 30% crash due to regulatory uncertainty, driving the RSI down to 20.
- Why it was a DCB: The price exploded upward in a “relief rally,” but volume was steadily declining throughout the 3-day bounce. The recovery stalled precisely at the 0.5 Fibonacci retracement level of the crash.
- Trigger: Rejection at the 0.5 Fibonacci level combined with a Bearish Engulfing candle on the H4 timeframe.
- Entry: Short entry after the engulfing candle closed below the previous candle’s open.
- Result: Institutional sellers used the retail liquidity to open shorts, driving Bitcoin to new yearly lows.
13.3. Stock Example: Tech Sector Earnings Gap
- Context: A major tech stock reported a significant earnings miss, causing the price to gap down 15% at the market open.
- Why it was a DCB: Over the next several trading sessions, the price drifted upward to “fill the gap.” However, the volume was anemic compared to the massive volume seen on the gap-down day.
- Trigger: The price reached the “top” of the gap (the previous day’s close) and failed to move higher, forming a series of long upper wicks.
- Entry: Short entry once the price broke below the low of the 3-day consolidation.
- Result: The gap acted as a “brick wall” of resistance, and the stock entered a multi-month downtrend.
14. What Are Common Mistakes Traders Make?
Even with a highly accurate technical setup, execution errors and psychological biases can compromise a trade. Understanding these common pitfalls is essential for protecting your capital and maintaining a disciplined approach to bearish continuation patterns.
Most mistakes stem from a desire to predict market movements rather than waiting for the market to provide objective confirmation.
- Buying the “Oversold” Bounce (FOMO): The most frequent error is jumping into a long position at the first sign of a green candle after a crash. Traders often fear missing out on the absolute bottom, forgetting that the initial rally is typically a “short squeeze” or a technical reset rather than a shift in fundamentals. Buying too early often results in entering at the peak of a minor correction just before the primary downtrend resumes.
- Confusing a Lower High with a Trend Reversal: Traders often assume a “V-shaped” recovery is underway without looking at the price structure. A genuine bottom requires the market to establish a “Higher Low” or a “Double Bottom.” A Dead Cat Bounce, conversely, is defined by its “Lower High”—the price rallies but fails to reach the previous peak. Shorting based on a perceived bottom without structural confirmation is a recipe for a “bull trap”.
- Ignoring Volume and Market Context: Technical patterns do not exist in a vacuum. Attempting to trade a Dead Cat Bounce without confirming declining volume is dangerous. If the market is in a structural bear market (such as a long-term crypto winter or an economic recession), the probability of a bounce failing at resistance is much higher. Always ensure the “hollow” nature of the rally is visible in the volume bars before committing to a short position.
- Over-Reliance on Lagging Indicators: While the RSI and MACD are helpful filters, they are lagging indicators based on past price action. Shorting an asset solely because the RSI has returned to a “neutral” level is risky. Indicators should only be used to support your observation of price action. Always wait for a specific bearish trigger such as a breakdown of the bounce low or a rejection candle before entering the trade.
15. Which Scanners and Tools Can Automatically Detect the Pattern?
Manually searching for Dead Cat Bounce setups across hundreds of assets is inefficient. By using technical scanners, you can automate the identification of assets that have experienced a sharp plunge and are currently undergoing a weak recovery.
15.1. TradingView Screener (Crypto & Forex)
To find high-probability “traps,” set your TradingView filters to find assets that are severely oversold but showing a minor uptick.
- Filter 1: RSI (14) below 30 on the Daily timeframe (identifies the initial crash).
- Filter 2: Weekly Performance below -15% (confirms the “Plunge” phase).
- Action: Look for these assets to start rallying back toward their 20-day EMA on low volume.
15.2. FinViz Stock Screener (Equities)
For the stock market, focus on technical “Channel Down” patterns and price location relative to moving averages.
- Technical Tab: Set “20-Day Simple Moving Average” to “Price below SMA20.”
- Pattern: Select “Channel Down.”
- Signal: Look for stocks that are gapping up or rallying toward the upper trendline of the descending channel on weak volume.
15.3. MT4/MT5 Supply and Demand Zones
Forex traders can use Supply and Demand plugins to identify “Drop-Base-Drop” zones. These areas represent institutional sell orders left unfilled during the initial crash. Set alerts for when the price rallies back into these “Supply Zones” on the 4-Hour (H4) chart; a rejection here is a classic sign of a Dead Cat Bounce failure.
16. Frequently asked questions about Dead Cat Bounce Pattern
This section addresses the most common questions regarding the mechanics and reliability of the Dead Cat Bounce to help you avoid common misunderstandings.
17. Conclusion
The Dead Cat Bounce pattern remains one of the most effective tools for institutional investors to trap emotional retail traders in a fake recovery. It serves as a reminder that in a bear market, price increases are often opportunities to sell rather than invitations to buy.
To survive and profit from these setups, you must trade with clinical patience. Never trust a rally that lacks volume conviction, and always wait for the market to break its support floor before confirming the continuation of the crash. By shifting your perspective from “bottom fishing” to “selling the failure,” you can turn a treacherous market trap into a high-probability trading strategy.
Ready to master market traps? Don’t trade blindly. Follow Piprider today for professional technical analysis and strategies to stay ahead of the next market crash.


