
The hammer candlestick pattern is a widely recognized reversal signal in price action trading, often marking the exhaustion of selling pressure. When it appears at key support levels or at the conclusion of a sustained downtrend, the hammer helps traders identify potential market bottoms where risk is historically lower and the probability of a trend shift increases. This guide provides an expert analysis of how to identify, confirm, and trade this pattern effectively.
Key Takeaways
- The hammer is a bullish reversal pattern that appears exclusively after a downtrend.
- Structure: It has a small real body, a long lower wick (at least 2-3 times the body length), and little to no upper wick.
- Confirmation: The signal is strongest when the next candle closes above the high of the hammer.
- Location matters: It is most effective when found at support zones or in oversold conditions.
- Warning: Avoid trading hammers that appear in the middle of a sideways range or lack volume confirmation.
1. What Is a Hammer Candlestick Pattern?
The hammer candlestick is a single-candle bullish reversal formation that appears at the bottom of a downtrend. It signals that selling pressure is weakening and buyers are beginning to take control (Thompson, 2025), where the market attempts to push lower but is met with significant buying interest that forces the price back up before the session closes.
1.1. Visual Characteristics and Requirements
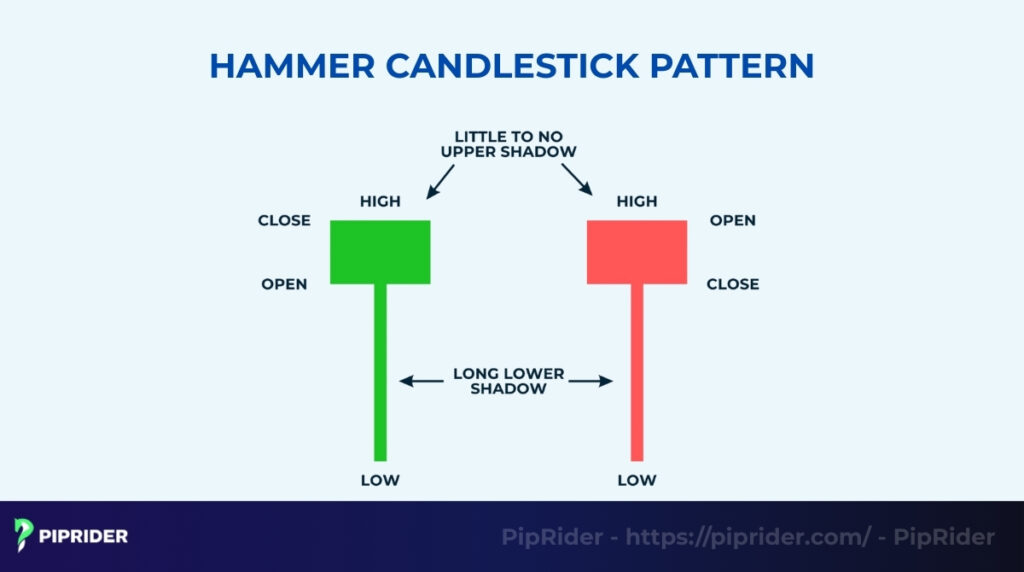
To distinguish a genuine hammer from random market noise, technical analysts look for three specific structural traits:
- The Context (Prior Trend): A valid hammer must form after a clear decline or downtrend. Its primary function is to reverse existing bearish momentum; therefore, a hammer shape appearing in a sideways or “choppy” market lacks the necessary context to be considered a reliable signal.
- The Proportions (The 2x Rule): The candle must have a small real body situated at the top of the trading range. The lower shadow (wick) must be at least two to three times the length of the real body. This dramatic extension illustrates the intensity of the intraday rejection.
- The Upper Wick: Ideally, a hammer should have little to no upper shadow. A prominent upper shadow indicates that while buyers pushed the price up, they were unable to maintain those highs until the close, which weakens the bullish sentiment.
1.2. The Mechanism of the Bullish Reversal
The hammer signals a shift in market psychology from extreme fear to emerging confidence. During the session, sellers maintain their dominance, driving the price to new lows. However, as the price drops, “Smart Money” or institutional buyers step in to absorb the supply, recognizing value at these discounted levels. This aggressive buying forces the price back toward the opening level, proving that bearish momentum has likely reached a point of exhaustion.
2. Hammer vs. Inverted Hammer: Which Is Easier to Trade?
Traders often encounter both the standard hammer and the inverted hammer at the bottom of a downtrend. While both are bullish indicators, understanding their structural differences is crucial for choosing the right entry strategy.
- The Standard Hammer: Features a long lower wick, representing a rejection of lower prices. This is often seen as a more “natural” reversal because the buyers successfully defend a price floor within the same session. Many traders find this easier to trade as the price rejection is immediate and obvious.
- The Inverted Hammer: Features a long upper wick. This suggests that buyers tried to rally the price during the session but sellers pushed it back down toward the open. While it still signals a potential bottom, it is often considered a “test” of higher prices rather than a full rejection of lows, frequently requiring more conservative confirmation before a trade is placed.
In both cases, the signal is only considered complete when the following candle closes above the high of the pattern, confirming that the new bullish momentum is sustainable.
3. Quick Rules for a Valid Hammer
Before performing a deep technical analysis, traders can use this high-impact summary to quickly verify if a candle qualifies as a potential hammer. These rules are designed to filter out weak signals and focus only on candles that represent a significant structural rejection of lower prices.
Quick Hammer Checklist
- Context: Must follow a clear downtrend or a series of lower lows.
- Lower Wick: Must be at least 2 to 3 times the length of the real body.
- Body Position: The real body must sit at the very top of the candle’s range.
- Upper Wick: Should be extremely small or entirely absent.
- Confirmation: A high-probability setup requires the next candle to close above the hammer’s high.
4. How to Identify a Valid Hammer Pattern
Not every candle with a long wick is a tradable hammer. To filter out random market noise and identify high-probability setups, you must verify the pattern against four specific technical criteria. These rules ensure that the candle represents a true shift in supply and demand rather than simple intraday volatility.
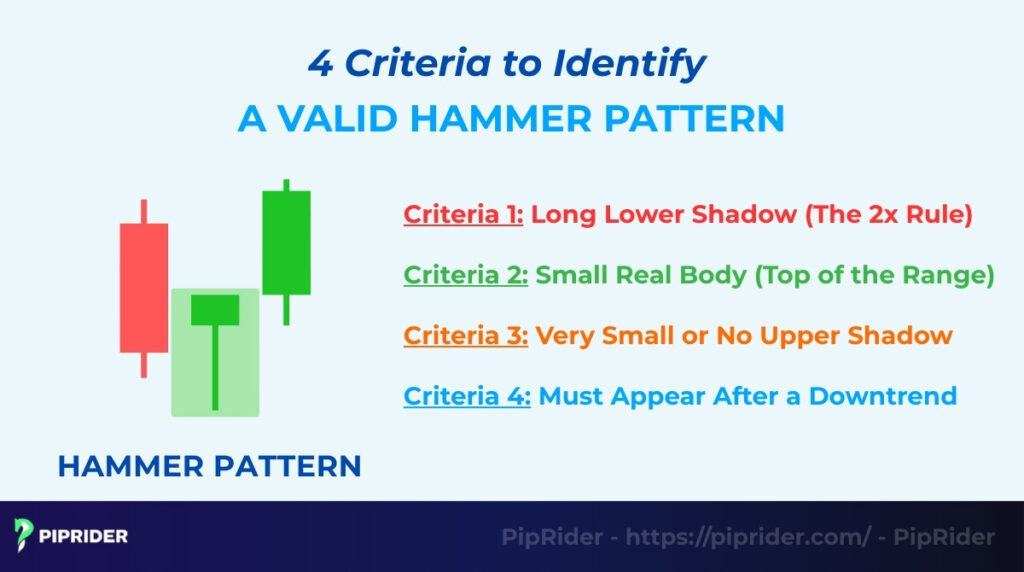
4.1. Long Lower Shadow: “The 2x Rule“
The lower shadow is the most critical component of the hammer. To be considered a valid signal, the shadow must be at least two to three times the length of the real body. This extreme length is a visual representation of a “bear trap” or a sharp price rejection; a short wick simply suggests market indecision, whereas a long wick proves that buyers have successfully reclaimed territory lost earlier in the session.
4.2. The Real Body: Size and Positioning
The “real body” (the distance between the open and close) should be small and situated at the upper extreme of the trading range.
- Position: It must sit near the high of the candle to show that buyers maintained control until the close.
- Color: While a green (bullish) body is technically strongerin, dicating the close was higher than the open – a red (bearish) hammer is still a valid reversal signal as long as the other structural criteria are met.
4.3. The Upper Shadow: Minimal to None
A classic, high-probability hammer should have little to no upper shadow. In technical analysis, an upper shadow indicates that sellers were able to push the price down from its intraday highs before the session ended. If the upper shadow is too long, it suggests that the bullish conviction is weak, making the reversal less reliable.
4.4. Market Context: The Preceding Downtrend
Context is the ultimate filter for any reversal pattern. Because the hammer is designed to signal the end of a decline, it must appear after a clear series of lower lows (a downtrend). Finding a hammer-shaped candle in the middle of a sideways or choppy market is typically a false signal and should be ignored, as there is no trend to reverse.
5. What Is the Market Psychology Behind the Hammer?
Technical analysis is essentially the study of collective human behavior. The hammer candlestick tells a story of a failed bearish attack and a subsequent surge in buyer confidence, often occurring during periods of high market volatility or panic.
5.1. From Fear to Value Absorption
The session usually begins with sellers maintaining their grip on the market, following the momentum of the existing downtrend. They aggressively liquidate positions, driving the price to new lows and creating the long lower shadow. At this peak of bearish momentum, institutional “Smart Money” identifies the price as undervalued. These buyers step in to absorb the heavy supply, preventing further decline.
5.2. Short Covering and Momentum Shift
Once the initial selling pressure is absorbed, the supply dries up, and the sentiment shifts from panic to accumulation. As buyers begin to bid the price up, sellers who were “short” are forced to cover their positions to limit losses. This short-covering creates a feedback loop that fuels the intraday rally, pushing the price back toward the top of the session’s range.
5.3. The Significance of the Close
The final close near the session high is the ultimate sign of buyer dominance. By erasing almost all intraday losses, the bulls have demonstrated that the bears have lost control of the price floor. This visual victory sets the psychological stage for a trend reversal, as traders now expect higher prices in the coming sessions.
6. What Are the Different Types of Hammer Patterns?
While the visual structure of a hammer remains consistent, its effectiveness is heavily dictated by the market context in which it appears. Understanding these variations allows traders to distinguish between a low-conviction signal and a high-probability reversal setup.
To help you categorize these signals, the following table outlines the strength of different hammer setups based on their technical alignment.
Hammer Strength Table
| Hammer Type | Strength | Key Characteristics |
|---|---|---|
| Standard Bullish Hammer | Medium | Meets visual criteria but lacks specific support or volume confluence |
| Hammer at Support | High | Forms at a major support zone, trendline, or moving average |
| Volume-Confirmed Hammer | Very High | Accompanied by a volume spike, indicating “climax selling” |
| Failed Hammer | Invalid | Price breaks and closes below the hammer’s lower wick |
6.1. Bullish Hammer (Standard)
This is the textbook version of the pattern found at the bottom of a downtrend. It meets all visual criteria—small body and long lower wick—but appears without additional technical “confluence” (such as a support level or moving average). While it is a valid signal, it carries a moderate risk of being a temporary pause rather than a full reversal. Consequently, standard hammers strictly require a bullish confirmation candle before an entry is considered.
6.2. Hammer at Support (High-Probability)
Location is often the most critical factor in a hammer’s success. When a hammer forms exactly on a historical support level, a psychological “round number,” or a key technical indicator like the 50-day moving average, its probability of success increases significantly. This “confluence” proves that buyers are actively defending a specific price floor that has been respected by the market in the past.
6.3. Volume-Confirmed Hammer
In technical analysis, volume acts as the fuel for a price move. A hammer accompanied by a massive spike in trading volume suggests “Climax Selling” or “Capitulation.” This means the last remaining sellers have exited the market in a panic, and “Smart Money” has stepped in to absorb the entire supply. This is widely regarded as one of the strongest reversal signals available because it represents a complete transfer of ownership from weak hands to strong hands.
6.4. Failed Hammer (Weak Setup)
Traders must be able to recognize when a signal is invalidated. A hammer is considered a “failed” setup if the price subsequently drops and closes below the lowest point of the hammer’s wick. This often occurs when the underlying bearish trend is too powerful to be reversed by a single candle. In such cases, the hammer acts as a “bull trap,” and the downward trend typically resumes with increased momentum.
7. Hammer Candlestick vs. Similar Patterns
Because many candlestick formations feature long wicks and small bodies, it is easy for beginners to misidentify them. Mistaking a bearish signal for a bullish one can lead to entering trades in the wrong direction, making it essential to understand the subtle differences in their structure and context.
Comparison of Single-Candle Formations
| Pattern | Key Visual Difference | Trend Context | Signal Meaning |
| Hammer | Small body, long lower wick | After a Downtrend | Bullish Reversal |
| Hanging Man | Identical to Hammer | After a Uptrend | Bearish Reversal |
| Doji | No body (Open = Close) | Any | Indecision / Stalemate |
| Pin Bar | Long wick, small body | Any | Price Rejection |
| Dragonfly | No body, long lower wick | After a Downtrend | Strong Bullish Rejection |
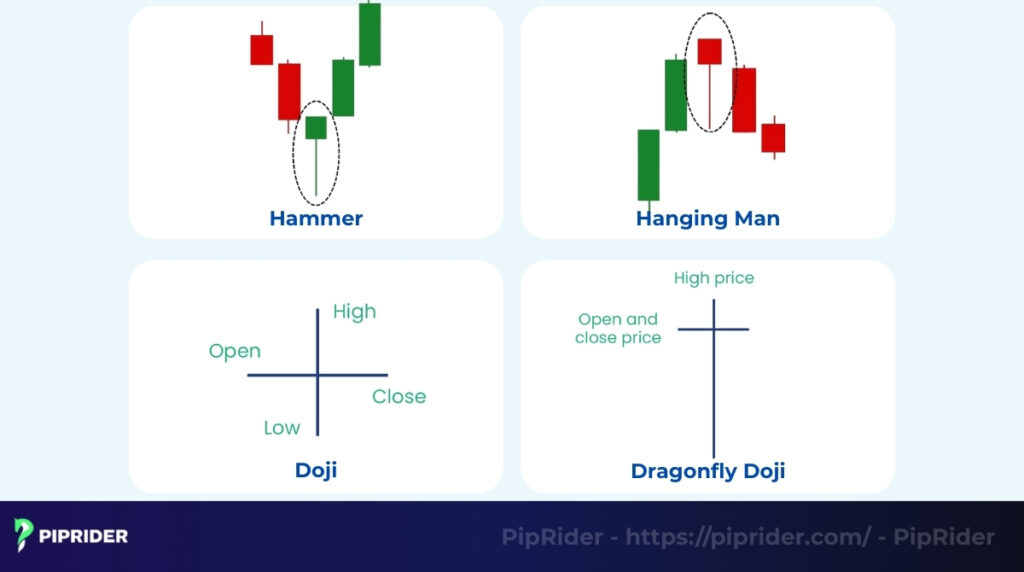
7.1. Hammer vs. Doji
The primary distinction between these two lies in the size of the “real body” and what it represents regarding market conviction. A hammer has a small but visible body, indicating that buyers managed to push the price slightly above the open (if green) or at least held a level near the open. A Doji, however, has virtually no body, meaning the open and close prices are identical. While a hammer shows buyers gaining the upper hand, a Doji represents a total stalemate or indecision between bulls and bears.
7.2. Hammer vs. Hanging Man
These two patterns are visually identical, which is the most frequent source of confusion for new traders. The only difference is the preceding trend. A hammer appears after a price drop and signals a bottom, whereas a Hanging Man appears after a price rise and signals a potential top. If you see a “hammer shape” at the peak of an uptrend, it is actually a bearish warning signal.
7.3. Hammer vs. Pin Bar
The terms are often used interchangeably, but they stem from different schools of analysis. “Pin Bar” is a broad term used in Price Action trading to describe any candle with a long wick that “pins” (rejects) a specific price level. “Hammer” is a specific term from Japanese Candlestick charting with strict proportional requirements. Essentially, every hammer is a bullish pin bar, but not every pin bar (which can appear in various contexts) is a hammer.
7.4. Hammer vs. Dragonfly Doji
The Dragonfly Doji is an extreme version of the hammer. While a hammer has a small body—showing a slight struggle between buyers and sellers—the Dragonfly Doji has no body and no upper shadow. The open, high, and close are all at the exact same level. This indicates that despite intense selling pressure during the session, the bulls were strong enough to push the price all the way back to the absolute high, making it a very potent sign of a bottom.
8. How to Trade the Hammer Pattern: Strategies for Entry & Exit
Identifying a hammer candlestick is only the first step in a successful trade; the real edge comes from a disciplined execution strategy. This section details how to plan your entry, manage your risk with stop-losses, and secure profits using technical targets.
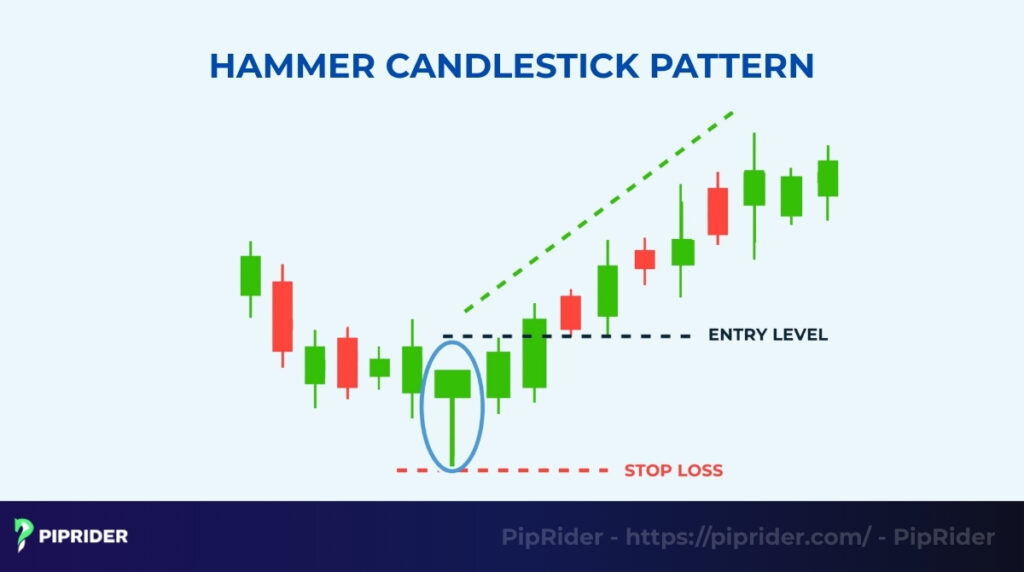
8.1. Entry Methods (Choose Your Style)
Choosing an entry point depends on your risk tolerance and the degree of confirmation you require. Traders generally categorize their approach into three distinct styles based on whether they prioritize an early entry or higher probability.
| Entry Style | Trigger Point | Risk Level | Best For |
|---|---|---|---|
| Aggressive | Break of Hammer’s High | High | Advanced traders catching the full move |
| Standard | Bullish Confirmation Close | Medium | Beginners and most retail traders |
| Conservative | Retest of 50% Wick | Low | Precision traders focusing on Risk-to-Reward |
- The Aggressive Entry (Break of High): This method involves placing a “Buy Stop” order just above the high of the hammer candle. The moment the price breaks this level, the trade triggers. While this ensures you don’t miss a sudden rally, it carries a higher risk of “fakeouts” where the price breaks the high but immediately reverses. Best for advanced traders who can manage intraday volatility.
- The Standard Entry (Confirmation): This is the most widely recommended approach. Traders wait for the next candle to close completely above the hammer’s high. If that candle closes green (bullish), it confirms that buyers have successfully reclaimed control. Best for beginners as it provides the most technical evidence of a reversal.
- The Conservative Entry (Retest): In many cases, the market will temporarily pull back after a hammer forms to “retest” the demand within the long lower wick. Traders place a “Buy Limit” order near the 50% level of the hammer’s tail. This provides a superior risk-to-reward ratio but carries the risk of the price shooting up without ever returning to fill the order. Best for precision-focused traders who prioritize capital protection.
8.2. Stop Loss Placement
Defining your risk is critical when trading hammers because the long lower wick can require a wide stop-loss. Proper placement ensures you stay in the trade through minor fluctuations while protecting your capital from a total failure of the pattern.
- Below the Low: The most common placement is 2–5 pips below the lowest point of the hammer’s tail. If the market reaches this level, the bullish thesis is invalidated, and you should exit the trade immediately.
- ATR-Based Stop: In volatile markets (such as Cryptocurrencies or minor Forex pairs), a tight stop might be triggered by noise. In these cases, traders use the Average True Range (ATR indicator) to calculate market volatility and place their stop 1x ATR below the hammer’s low to give the trade more “breathing room.”
8.3. Take Profit Techniques
Exiting a trade is often more difficult than entering. To avoid emotional decision-making, use objective technical levels to determine where to take profits.
- Previous Market Structure: Look to the left of your chart for the most recent “swing high” or established resistance zone. These levels represent areas where sellers are likely to step back in.
- Fibonacci Extensions: If the price breaks into new highs, use Fibonacci extension levels (such as 1.272 or 1.618) to find potential mathematical reversal points.
- Fixed Risk-to-Reward Ratio: A simple yet effective method is to aim for a 2:1 or 3:1 ratio. For every dollar risked at the stop loss, aim for two or three dollars in profit.
9. When a Hammer Pattern Is Weak or Invalid
Not every hammer-shaped candle results in a reversal. Learning to identify “false” signals is essential to prevent “catching a falling knife”—a situation where you buy into a downtrend that is far from over.
9.1. Lack of Preceding Trend
A hammer is, by definition, a reversal pattern. If the market has been moving sideways in a narrow, choppy range (consolidation), a hammer shape is likely just random market noise. Without a clear downtrend to reverse, the pattern lacks the psychological weight required to drive a meaningful move.
9.2. Structural Weakness (Long Upper Wicks)
If a hammer has a prominent upper shadow, it is considered a weak setup. A long upper wick indicates that although buyers pushed the price up, they were met with enough selling pressure to force the price back down before the close. This “battle” at the highs suggests that bears are still active and the bullish momentum is not yet dominant.
9.3. Trading Against Strong Institutional Momentum
If a hammer forms during a massive, high-volume crash without any surrounding support levels, it may be a “mere pause” rather than a reversal. In extremely strong bearish trends, a single hammer is often insufficient to stop the momentum; the market may form a hammer, stay flat for one or two candles, and then continue plummeting.
9.4. Failure of Confirmation
The most common mistake is entering a trade before the following candle confirms the move. If the next candle fails to break above the hammer’s high—or worse, closes below the hammer’s body—the pattern is invalidated. Always wait for the “follow-through” to ensure the bulls have officially taken the lead.
10. Best Conditions for High-Probability Hammer Trades
A hammer pattern is only as effective as the context in which it forms. To filter out low-quality signals, professional traders look for a “confluence” of factors that increase the likelihood of a successful reversal. The probability of success improves significantly when multiple technical layers align at the same price point.
10.1. Primary Confluence: Support and Demand Zones
Location is the single most critical factor in determining a hammer’s validity. A hammer that forms in “thin air”—meaning it is not touching any recognizable technical level—is often a trap. Professional traders prioritize setups where the hammer’s tail pierces or touches a major support zone, a fresh demand zone, or a psychological round number. This historical evidence suggests that buyers have a vested interest in defending that specific price floor.
10.2. Volume Confirmation: “Stopping Volume”
Volume serves as the fuel for any price reversal. A high-probability hammer should ideally be accompanied by a significant spike in trading volume compared to the preceding 5–10 candles. This represents “Stopping Volume” or “Climax Selling,” indicating that the final sellers have panicked and institutional buyers have stepped in to absorb the entire supply. Without volume confirmation, the hammer may lack the necessary momentum to sustain a new uptrend.
10.3. Secondary Confluence: Moving Averages and Indicators
Once location and volume are established, secondary filters can add further weight to the trade:
- EMA Confluence (20/50 EMA): In a healthy uptrend, the price often pulls back to its “mean.” A hammer forming on the 20-period or 50-period Exponential Moving Average (EMA) acts as a dynamic support level, suggesting that the broader trend is ready to resume.
- Oversold RSI and Bullish Divergence: Oscillators like the RSI (Relative Strength Index) can confirm seller exhaustion. A hammer is more reliable when the RSI is in oversold territory (below 30). Even stronger is Bullish Divergence, where the price makes a new low (the hammer’s tail) while the RSI makes a higher low, signaling that bearish momentum is fading.
10.4. Trendline and Fibonacci Alignment
Using trendlines and Fibonacci retracement levels adds a final layer of precision. A hammer that aligns with a long-term upward trendline or the 61.8% Fibonacci retracement is widely regarded as one of the most stable setups. These levels act as mathematical magnets for institutional orders, providing the liquidity needed for a sharp bounce.
11. Best Timeframes for Hammer Candlestick Trades
The reliability of a hammer pattern depends heavily on the timeframe being analyzed. Generally, the higher the timeframe, the more institutional “weight” and data each candle represents, leading to more dependable signals.
11.1. Institutional Timeframes: Daily (D1) and 4-Hour (H4)
For swing traders and long-term investors, the Daily and 4-Hour charts offer the highest probability of success. A hammer on these timeframes represents a significant shift in daily sentiment and is often reacted to by large banks and hedge funds. Because these candles encapsulate many hours of trading, they are much harder to manipulate and carry a lower risk of “market noise.”
11.2. Intraday Timeframes: 1-Hour (H1) and 15-Minute (M15)
Day traders frequently use the 1-hour or 15-minute charts to catch intraday reversals. While these are valid, they require stricter adherence to confluence factors like volume and support. A hammer on a 15-minute chart can be a powerful signal if it occurs during a session open (like the New York or London open) when liquidity is high, but it is more prone to temporary fluctuations than the daily chart.
11.3. Scalping Timeframes: 5-Minute (M5) and Below
Hammers on very short timeframes (1-minute or 5-minute) occur frequently but have a much higher failure rate. These charts are often dominated by high-frequency trading algorithms and minor retail fluctuations. Professional traders generally advise against trading “isolated” hammers on these timeframes unless they are perfectly aligned with a major level from a much higher timeframe (e.g., a 5-minute hammer touching a Daily support level).
12. What Do Real Hammer Chart Examples Look Like?
Theoretical knowledge provides the foundation for trading, but the real challenge lies in recognizing these patterns amidst the noise of live market data. The following examples illustrate how the hammer pattern functions across different asset classes, highlighting the importance of location and confirmation.
12.1. Forex Example: EUR/USD (Rejection of Psychological Levels)
In the currency markets, hammers frequently appear on the 4-hour (H4) chart during session reversals, particularly when the price approaches major “round number” levels.
- Context: The EUR/USD has been in a sustained decline for two trading days, showing strong bearish momentum.
- Location: The price approaches a major psychological support level at 1.1000. Sellers attempt to push the price lower to 1.0980, but the move is quickly rejected.
- Confirmation: The candle closes back above the 1.1000 level, leaving a long lower wick. The subsequent candle opens and begins to trade above the hammer’s high.
- Entry: A “Standard” entry is taken after the confirmation candle closes bullishly above the hammer’s high.
- Stop Loss: Placed 5 pips below the hammer’s low (at 1.0975) to protect against a trend continuation.
- Target: The first profit target is set at the recent swing high or the daily average price, resulting in a favorable risk-to-reward ratio.
12.2. Stock Market Example: Apple (AAPL) (Moving Average Bounce)
Stocks often exhibit hammer patterns on the Daily (D1) chart following multi-week corrections, signaling that institutional investors are stepping in to defend the long-term trend.
- Context: Apple stock has undergone a 10% pullback from its recent highs, entering a short-term correction phase.
- Location: The price drops to touch the 50-day Simple Moving Average (SMA), which has historically acted as a dynamic floor for the stock.
- Confirmation: The stock opens lower and drops sharply intraday, but rallies significantly during the final hour of trading to finish near the high of the session, forming a classic hammer.
- Entry: A “Buy Stop” is placed at the high of the hammer, triggered the following morning as the market opens with bullish momentum.
- Stop Loss: Positioned just below the 50-day SMA and the hammer’s low.
- Target: The recent resistance zone or a Fibonacci extension level, capturing the next leg of the primary uptrend.
12.3. Crypto Example: Bitcoin (BTC) (Volatility & Liquidity Sweeps)
Due to high volatility, crypto hammers often feature extreme wicks. These are frequently “liquidity sweeps,” where the price crashes to trigger stop-losses before a massive reversal occurs.
- Context: Bitcoin experiences a rapid “flash crash” during a period of high volatility, dropping several thousand dollars in minutes.
- Location: The price hits a major historical demand zone where high volumes of buy orders are clustered.
- Confirmation: The massive sell-off is met with aggressive buying, leaving a significant lower wick on the 1-hour chart. The candle closes green with a spike in “Stopping Volume.”
- Entry: A “Conservative” entry is sought at a 50% retracement of the long wick, as crypto prices often retest these levels before the final rally.
- Stop Loss: Placed below the extreme low of the crash.
- Target: A return to the pre-crash price levels, utilizing the “V-shaped” recovery typical of crypto liquidity events.
13. What Are Common Mistakes When Trading the Hammer Pattern?
Even a high-probability pattern like the hammer can lead to losses if applied without discipline or contextual awareness. By identifying these common technical and psychological traps, traders can significantly improve their long-term win rate.
13.1. “Catching a Falling Knife” (No Confirmation)
One of the most frequent errors is entering a trade while the hammer candle is still forming. A candle may look like a perfect hammer ten minutes before the close, only for a sudden burst of selling pressure to turn it into a large bearish candle by the time it finishes. Always wait for the candle to close and for the subsequent candle to provide confirmation before pulling the trigger.
13.2. Ignoring the Higher Timeframe Trend
A hammer on a 5-minute or 15-minute chart is statistically weak if the Daily or Hourly trend is crashing downward with heavy momentum. Small reversal patterns often fail against the weight of institutional trends. To avoid this trap, ensure your intraday hammer trade aligns with the direction of the trend on a higher timeframe or is occurring at a major “Daily” support level.
13.3. Trading in Consolidation (Sideways Markets)
Hammers are specifically designed to signal the end of a trend. When a hammer shape appears in a sideways, choppy market, it is usually just an indicator of volatility rather than a reversal. Trading these “random” hammers leads to frequent stop-outs. If there has been no clear downtrend preceding the candle, the pattern should be ignored.
13.4. Overlooking the Risk-to-Reward Ratio
Sometimes a hammer has an exceptionally long lower wick. While this shows strong rejection, it also requires a very wide stop-loss. If the required stop-loss is too large compared to the potential profit target, the trade no longer makes mathematical sense. In these scenarios, it is often better to wait for a “Retest Entry” (50% of the wick) or skip the trade entirely to wait for a setup with a better risk-reward profile.
14. Which Tools Can Automatically Detect the Hammer Pattern?
Manually scanning dozens of charts for specific formations can lead to decision fatigue and missed opportunities. Modern trading platforms offer sophisticated automated tools designed to detect hammer patterns instantly, allowing traders to focus on execution rather than discovery.
14.1. TradingView (Built-in Scripting and Labeling)
TradingView provides an accessible way to scan for patterns without requiring custom programming. By adding the built-in “All Candlestick Patterns” indicator, users can filter for the hammer specifically. The platform will then automatically label every valid formation on the chart in real-time. This is particularly useful for traders who monitor multiple timeframes simultaneously.
14.2. MetaTrader 4/5 (Custom Indicators and Alerts)
The MetaTrader ecosystem relies on custom-coded indicators (MQL4/MQL5) available through the marketplace. High-quality pattern scanners can monitor an entire watchlist of currency pairs, sending push notifications or email alerts the moment a hammer forms. This automation is essential for traders who cannot spend the entire session glued to their monitors but want to catch session-specific reversals.
14.3. FinViz and TrendSpider (Institutional Grade Screeners)
For stock market participants, screeners like FinViz (Free) and TrendSpider (Paid) offer powerful filtering capabilities.
- FinViz: Allows users to filter thousands of stocks simultaneously by selecting “Hammer” under the technical signals tab.
- TrendSpider: Utilizes machine learning to detect patterns with higher accuracy, filtering out low-quality shapes that lack proper proportions, thereby reducing the number of false positives.
15. Frequently asked questions about the Hammer Candlestick Pattern
Traders frequently encounter specific scenarios where the hammer’s reliability is questioned. This section addresses the most common practical concerns regarding timeframe selection and pattern confirmation.
16. Conclusion
The Hammer Candlestick Pattern remains one of the most effective tools for identifying potential market bottoms and trend reversals. Its simplicity, a single candle representing a dramatic intraday rejection makes it accessible for beginners, while its psychological depth provides a reliable edge for professional price action traders.
However, the pattern should never be traded in isolation. Its true power is unlocked only when it is treated as one component of a broader trading plan that includes support/resistance analysis, volume confirmation, and strict risk management. To build long-term success, traders must remain disciplined, waiting for high-probability “confluence” setups rather than chasing every hammer-shaped candle that appears. Ready to master market reversals? Explore the comprehensive trading guides and strategies at Piprider today.


