
In the world of technical analysis, the Ascending Triangle Chart Pattern is widely regarded as one of the most reliable continuation signals in a bull market. This formation occurs when buyers consistently push prices higher, creating higher lows against a static resistance level.
This comprehensive guide will equip you with the skills to accurately identify this powerful setup, filter out false breakouts, and execute high-probability trades with precision.
Key Takeaways
- The Ascending Triangle is a bullish continuation pattern that typically forms during an established uptrend.
- A horizontal resistance line combined with rising higher lows indicates that buyer strength is aggressively absorbing selling pressure.
- A valid breakout requires a significant surge in volume, confirming that institutional money is fueling the move.
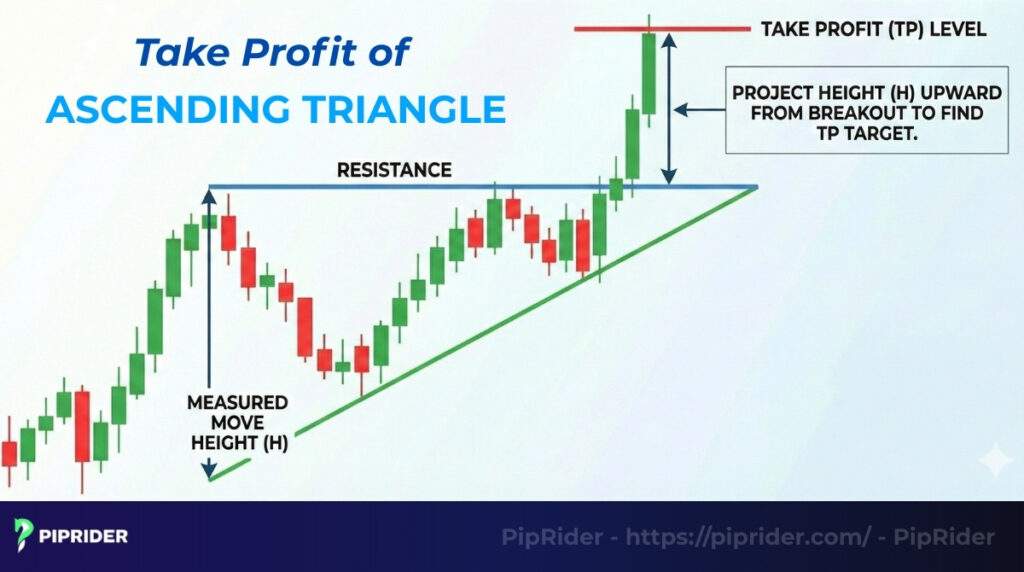
- The standard profit target is calculated by measuring the vertical height of the triangle and projecting it upward from the breakout point.
- This pattern is effective across all liquid markets, including Forex, Crypto, Stocks, and Indices.
1. What Is an Ascending Triangle Chart Pattern?
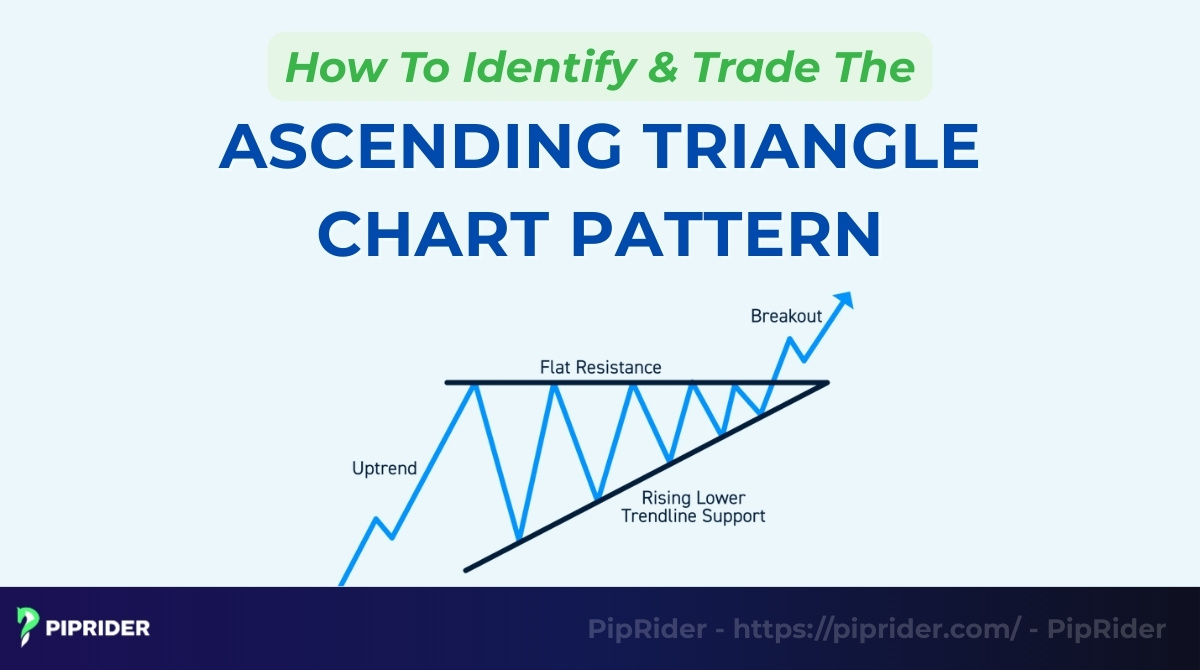
The Ascending Triangle is a bullish chart pattern defined by a flat, horizontal resistance line and a rising support trendline formed by a series of higher lows. According to the Corporate Finance Institute (CFI), this formation signals significant buying pressure, where buyers are aggressive enough to create higher lows while sellers hold a fixed price ceiling (CFI Team, n.d.).
To confirm a valid pattern, you must identify two converging trendlines that create a “squeeze” effect:
- Flat Resistance (The Ceiling): Price hits a specific high level multiple times but fails to break it, creating a horizontal line of resistance where sellers are active.
- Ascending Support (The Floor): Crucially, the price creates a series of higher lows, visually forming rising troughs. This proves that buyers are impatient, stepping in at higher prices during each dip.
1.1. Why Is an Ascending Triangle a Bullish Signal?
It is considered a reliable bullish pattern because it visualizes a specific market battle known as “Supply Absorption”.
- The Mechanism: Sellers are trying to defend the resistance level. However, buyers keep attacking this level without letting the price drop back to previous lows.
- The Result: Eventually, the supply of sell orders at the resistance level dries up. Once the sellers are exhausted, the price has nowhere to go but up, triggering an explosive breakout.
1.2. Where Does the Ascending Triangle Appear?
This pattern relies on human psychology, making it effective across all liquid markets:
- Stock Market: Common during accumulation phases before earnings reports.
- Crypto: Highly reliable in Bitcoin/Ethereum during consolidation periods before a pump.
- Forex: Frequently seen on intraday charts (15m, 1H) in pairs like USD/JPY.
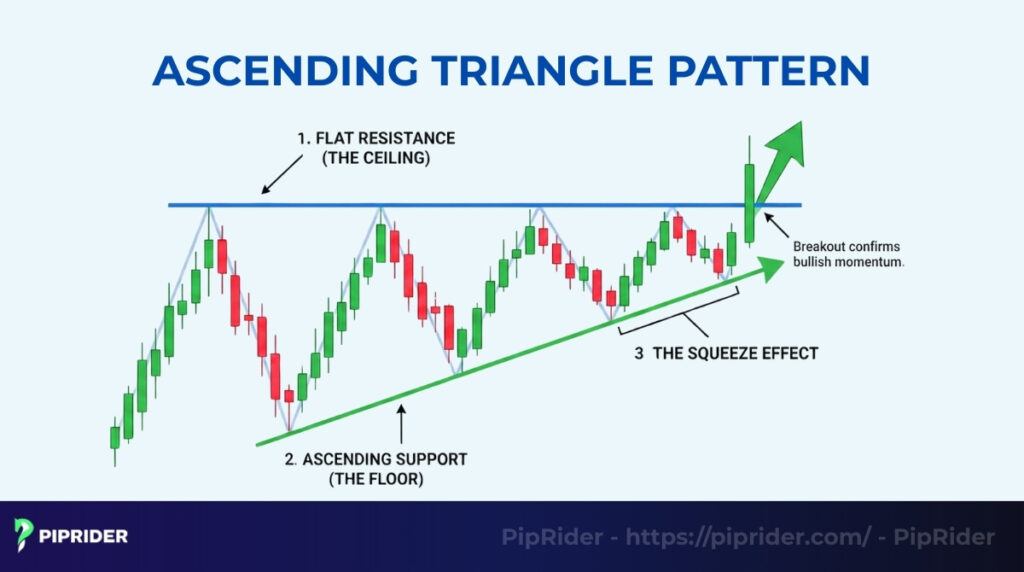
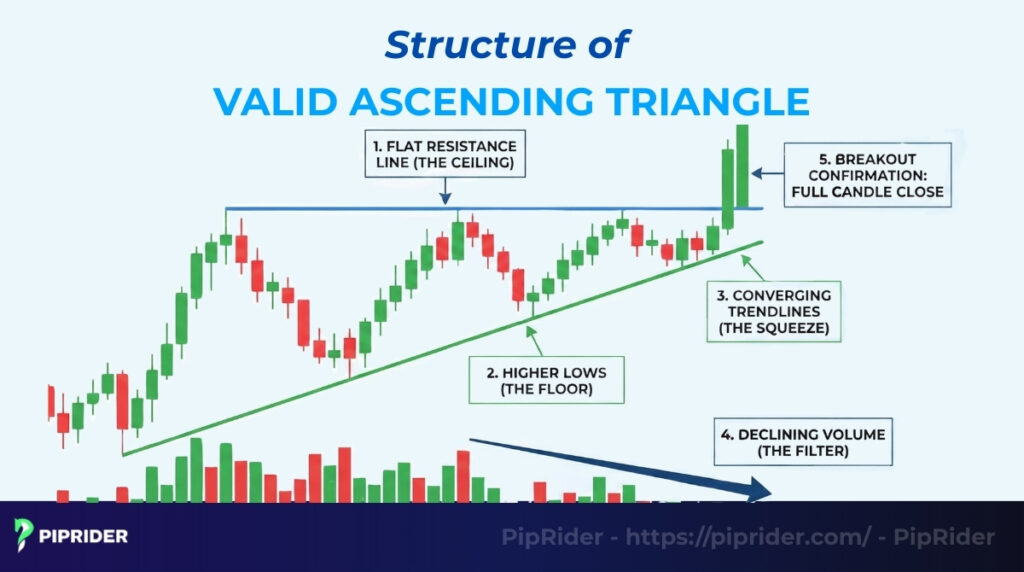
2. Structure of a Valid Ascending Triangle
To distinguish a high-probability setup from random noise, confirm these five structural elements before trading.
- Flat Resistance Line (The Ceiling): The upper trendline must be horizontal, connecting at least two swing highs. This horizontal line represents a fixed supply zone where sellers are absorbing demand. Slight deviations are acceptable, but significant slopes invalidate the pattern.
- Higher Lows (The Floor): The lower trend line connects a sequence of higher lows. This rising slope is the key signal of buyer aggression. It proves they are paying a premium to enter early rather than waiting for the price to drop back to previous lows.
- Converging Trendlines (The Squeeze): The flat resistance and rising support must converge to squeeze the price into a narrow apex. This volatility contraction builds potential energy like a coiled spring; the tighter the squeeze, the more explosive the breakout.
- Declining Volume (The Filter): As the pattern matures, trading activity should noticeably decrease. This “drying up” of volume indicates that selling pressure is evaporating, setting the stage for a demand-driven breakout.
- Breakout Confirmation: Professional traders never act on a simple wick. You need a full candle close (preferably H4 or Daily) decisively above the resistance line to confirm that buyers have overwhelmed the sellers.
3. What Is the Market Psychology Behind the Pattern?
The chart is a footprint of human emotion. The Ascending Triangle chart pattern reveals a specific battle where aggressive buyers systematically exhaust the supply of passive sellers.
- Sellers Defend the “Line in the Sand”: A large institution or group of sellers is camped at the resistance line, supplying liquidity at a fixed price. They believe the asset is overvalued and are happy to exit, creating a temporary ceiling that absorbs buying pressure.
- Buyers Show Aggression (The Squeeze): While sellers are passive, buyers are impatient. Instead of waiting for the price to drop back to previous lows, they “bid up” the price earlier during every dip. The formation of higher lows proves that demand is increasing and buyers are willing to pay a premium to enter.
- The Breakout Chain Reaction: Eventually, the sellers run out of inventory. When the supply wall disappears, the price shoots up through resistance. This triggers a double wave of buying: short sellers panic-covering and breakout traders entering, fueling the explosive move.
4. Market Scenarios: How to Play Each Setup
The Ascending Triangle doesn’t always behave the same way. Its location on the chart changes its win rate and how you should manage your risk. Use these three frameworks to adjust your strategy in real-time.
4.1. Classic Continuation (The Trend Follower)
This is the “Bread and Butter” setup for most traders. It appears during an established uptrend, representing a period where buyers “digest” the recent gains before the next leg up.
- The Logic: Sellers are trying to take profits at a fixed resistance, but buyers are so aggressive they won’t let the price drop, creating the “Rising Floor.”
- Bias: Strongly Bullish (Highest statistical success rate).
- Best Approach: Standard Breakout or Retest Long. Focus on the 4H or Daily timeframes.
- Main Warning Sign: A breakout on declining volume. If the “Ignition” (Volume spike) is missing, the trend might be exhausted.
- Pro Tip: The longer the triangle consolidates (without reaching the apex), the more powerful the eventual breakout usually is.
4.2. Reversal at the Bottom (The Trend Shifter)
Though less common, this pattern can form at the end of a long downtrend. It signals that the “Bear Market” has run out of steam and professional accumulation has begun.
- The Logic: Large institutions are “bidding up” the price at every dip to build their positions without letting the price break the ceiling too early.
- Bias: Bullish (Transitionary).
- Best Approach: Be conservative. Wait for the price to break the triangle AND clear a major moving average (like the 200 EMA) to confirm the trend has truly flipped.
- Main Warning Sign: Lack of a clear “accumulation” phase before the triangle. A “V-shaped” triangle is less reliable than one that follows a flat bottom.
- Pro Tip: Look for a “Double Bottom” or “Rounding Bottom” structure inside the triangle for extra confirmation.
4.3. The Failed Triangle / Bull Trap (The Pivot)
Not every triangle breaks upward. If the rising support line fails, the bullish thesis is dead. This often triggers a violent move as “trapped” buyers are forced to sell.
- The Logic: Buyers have exhausted their capital trying to break the resistance. When they give up, a “Vacuum” is created, leading to a sharp drop.
- Bias: Bearish (after support breaks).
- Best Approach: Abandon all long ideas. Consider a Short Entry only after a decisive close below the rising support line and a failed retest of that same line.
- Main Warning Sign: Multiple “fakeout wicks” above the resistance that fail to hold. This is a clear sign that sellers are still dominating the “ceiling.”
- Pro Tip: A failed Ascending Triangle often leads to a move that is much faster and more violent than a successful breakout.
Comparison: Strategy by Setup Type
| Setup Type | Market Context | Priority Execution | Risk Level |
| Continuation | Strong Uptrend | Breakout / Retest Long | Low |
| Reversal | End of Bear Market | HTF Confirmation + Long | Moderate |
| Failed / Trap | Exhausted Buyers | Support Breakdown Short | High (Fast move) |
5. How Do You Identify a High-Probability Ascending Triangle?
To confirm a high-probability setup in technical analysis, you must identify four distinct technical traits: a minimum of four touchpoints on the trendlines, a clearly defined horizontal resistance, declining volume during formation, and a pre-existing uptrend context.
5.1. Minimum 4 Touchpoints (The Rule of 4)
A valid geometric pattern requires sufficient data points to confirm that the trendlines are real market structures, not just random drawings.
- The Requirement: You need a minimum of two distinct touches on the upper resistance line and two higher lows touching the support line.
- The Logic: A line drawn with only two points is tentative. A confirmed trend line requires three or more touches. The more touches, the more reliable the eventual breakout.
5.2. Resistance Must Be Well-Defined
The upper trendline acts as the “line in the sand.” It must represent a clear, visible zone where sellers are actively defending their positions.
- Horizontal Accuracy: The highs should align horizontally. While minor wicks can poke through, the bodies of the candles should respect the level.
- Supply Zone: If the resistance line slopes significantly downward or upward, the pattern is likely a Wedge or a Pennant, which requires different trading rules.
5.3. Volume Contraction + Expansion on Breakout
Volume analysis acts as your truth detector. It reveals the hidden flow of money moving into or out of the asset during the consolidation phase.
- During Formation: Volume should contract (decrease) as the price moves toward the apex. This shows that the market is running out of sellers.
- At Breakout: The breakout candle must be accompanied by a massive volume spike. This confirms that institutional “Smart Money” is fueling the move, reducing the chance of a fakeout.
5.4. Context: The Uptrend Requirement
The Ascending Triangle is a continuation pattern by design. Its predictive power is statistically highest when it is used to rejoin an existing trend.
- The Trend Check: Zoom out. Is there a clear uptrend leading into the triangle?
- The Filter: Avoid trading this pattern if it appears in a choppy, sideways market or immediately after a parabolic crash. It works best as a “pause” in a rising market, not a reversal from a crash.
5.5. The Probability Filter: High-Probability vs. Low-Quality Setups
Not all Ascending Triangles are created equal. Before risking your capital, run your setup through this diagnostic matrix to see if the odds are truly in your favor.
| Feature | ✅ High-Probability (Green Flags) | ❌ Low-Quality (Red Flags) |
| Market Context | Clear, established Uptrend beforehand. | Choppy, sideways, or erratic market. |
| Volume Profile | Visible Contraction toward the apex. | Volume remains high or random throughout. |
| Resistance | Flat and “Clean” (Horizontal Ceiling). | Messy, sloping, or inconsistently hit. |
| The Breakout | Decisive Candle Close above resistance. | Price “wicks” through but fails to close. |
| Volume Spike | 1.5x – 2x average volume on breakout. | Low or average volume (No “Smart Money”). |
| Confluence | Supported by Higher Timeframes (HTF). | Opposed by HTF trend or major resistance. |
The “One-Look” Rule
If your setup has more than two Red Flags, it’s no longer a high-probability trade—it’s a gamble. Professional traders don’t look for “any” triangle; they look for the “Cleanest” triangle.
- Green Flag Setup: High conviction, larger position size.
- Red Flag Setup: Skip the trade or use a significantly smaller position (micro-lot) if you must enter.
6. How to Trade the Ascending Triangle
Developing a professional trading plan requires more than just identifying a shape; it requires Decision Support. Most traders lose money not because they missed the breakout, but because they chose the wrong execution for the wrong market environment.
6.1. The Momentum Breakout Entry (Aggressive)
The Momentum Breakout focuses on capturing the “Initial Impulse.” It is designed for markets moving too fast to wait for a second chance.
- Best For: Momentum traders and those trading high-catalyst events (Earnings, News).
- Use When: The breakout candle is large (Marubozu), volume is at least 2x the average, and the broader market trend is strongly bullish.
- The Trigger: Enter a long position immediately when a candle closes decisively above the horizontal resistance line.
- The Risk: Entering early carries a higher risk of a “fakeout” if the price reverses quickly back into the triangle.
- Avoid When: The breakout candle is small, has a long upper wick (rejection), or occurs on low/average volume.
6.2. The Confirmation Retest Entry (Conservative)
The Retest Entry prioritizes Win Rate over speed. It assumes that once a major resistance is broken, the market will return to validate the level as new support.
- Best For: Swing traders and those who prioritize capital preservation.
- Use When: The initial breakout is orderly (not parabolic) and the price is likely to “breathe” before the next leg up.
- The Process: Allow the breakout to happen, then wait for the price to pull back to the broken resistance level.
- The Trigger: Enter only when you see a bullish rejection candle (e.g., Hammer or Engulfing pattern) forming at the retest level.
- Avoid When: The breakout is so explosive that the market leaves you behind. Trying to wait for a retest in a “parabolic” move often leads to missing the trade entirely.
6.3. The Entry Matrix: How to Choose Your Execution
Stop guessing which entry to take. Use this logic system to align your execution with the market’s “personality” in real-time:
| Market Personality | Recommended Strategy | The Logic |
| High Volatility + High Volume | Aggressive Breakout | Momentum is too strong; a retest is unlikely to happen before the target is hit. |
| Steady Uptrend + Orderly Market | Conservative Retest | Higher probability of a clean “support-resistance flip.” Reduces the risk of bull traps. |
| No Volume Spike + Long Wicks | SIT ON HANDS (No Trade) | Lack of institutional fuel makes it a high-risk fakeout. Save your capital. |
The Quick Decision Rule: Strong breakout + High volume + Fast market → Breakout Entry. Small breakout + Average volume + Orderly market → Retest Entry.
6.4. Strategic Exit: Stop-Loss & Take-Profit Framework
Don’t use a “one-size-fits-all” exit. In a live market, your levels must adapt to your entry type and the surrounding structure. Place your stop at the exact point where your bullish thesis is proven wrong.
Stop-Loss Placement
Your stop-loss should never be a random number or a fixed percentage. It must be placed at the exact technical level where the pattern is invalidated. Here is where to place your safety net based on your chosen entry:
| Entry Type | Stop-Loss Placement | The “Why” |
| Breakout Trade | Below the Breakout Candle’s Low | If price falls back, it’s likely a “Bull Trap.” |
| Retest Trade | Below the Retest Low (Wick) | Allows for a tighter stop and higher R:R. |
| Messy Charts | ATR Buffer (1.5x – 2x ATR) | Prevents getting “wicked out” by market noise. |
How to Manage Take-Profit (The 3-Step Target)
Professional traders don’t just “set and forget” their targets; they use Tiered Profit Taking to secure gains while letting their winners run.
- Step 1: The Primary Target (Measured Move): Calculate the vertical height of the triangle at its widest point (the base) and project it upward from the breakout point. This classic projection method, popularized by John J. Murphy in Technical Analysis of the Financial Markets (1999), provides a high-probability exit zone. Close 50-70% of your position here. (Formula: Target = Breakout Price + (Resistance – Lowest Low of Triangle)).
- Step 2: The “Reality Check” (Major Resistance): Look at the historical price action on the Daily chart. If a major Supply Zone or Old High is closer than your measured move, take partial profits at that level first, and immediately move your Stop-Loss to Breakeven (Entry Point).
- Step 3: The Runner (Trailing for Maximum Upside): For the remaining position, trail your stop using the 20-period EMA or move it below each new “higher low” formed after the breakout. This captures the “parabolic” moves that far exceed the original triangle’s height.
6.5. Multi-Timeframe Confirmation
Filtering out low-quality signals is easier when you check the “Big Picture.” If you are trading a triangle on the 1-Hour chart, always confirm that the 4-Hour or Daily trend is also bullish. A breakout that aligns with the higher timeframe trend and stays above the 200 EMA has a significantly higher probability of reaching its target.
7. Technical Indicators: The Confirmation System
Price action tells you what is happening, but technical indicators act as your “Secondary Confirmation” to reveal the strength behind the move. Use this matrix and the following protocol to filter out low-quality signals.
| Indicator | What it Confirms | When it Helps Most |
|---|---|---|
| Volume | Institutional Participation | All Breakout Trades (Non-negotiable). |
| RSI (14) | Bullish Momentum | Finding the “Ignition” point at entry. |
| MACD | Trend Acceleration | Sustaining the move post-breakout. |
| EMA 20/50 | Trend Alignment | Filtering out risky counter-trend setups. |
How to Build Your Confluence
Instead of looking at indicators in isolation, use them as a “jury” to vote on your trade. A high-probability setup should meet these criteria:
- Volume (The Non-Negotiable Filter): Volume is the breakout’s fuel. While activity should “dry up” during the triangle’s formation, the breakout candle demands a strict volume spike (ideally 1.5x – 2x the recent average). If the “Smart Money” isn’t buying the breakout, you shouldn’t either—low-volume moves are almost always bull traps.
- RSI (The Momentum Lead): Use the RSI to gauge buyer strength before the price even breaks. Look for the indicator to clear the 50-level or break its own internal downtrend line. Piprider Tip: If RSI is already above 70 (overbought) before the breakout, be cautious; the move might be exhausted and prone to a sharp “fakeout” or deep retest.
- MACD (The Trend Ignition): This indicator confirms that momentum is accelerating. Look for a bullish crossover occurring just as the price attacks the resistance line. When the histogram bars flip from negative to positive at the moment of breakout, it confirms that the “bullish engine” is firing on all cylinders.
- EMA 20/50 (The Dynamic Floor): Always ensure the price is trading above the 50-period EMA to confirm the macro trend is on your side. Ideally, the triangle’s rising support line should align with the 20-period EMA, creating a “dual-layer” of support that makes the breakout much more likely to hold during a retest.
The Golden Rule: Volume is the King; other indicators are its Advisors. Never ignore a lack of volume just because RSI or MACD looks “pretty.” If there is no volume spike, there is no trade.
8. How Does the Ascending Triangle Differ From Similar Patterns?
Misidentifying a chart pattern is one of the fastest ways to lose money. An Ascending Triangle looks similar to several other formations, but their trading implications are vastly different. Use this “Confusion Matrix” to stay on the right side of the trade.
| Pattern | Upper Trendline | Lower Trendline | Signal Bias | Most Common Confusion |
| Ascending Triangle | Flat (Horizontal) | Rising | Bullish (Continuation) | Mistaken for a Rising Wedge if the resistance is not truly flat. |
| Symmetrical Triangle | Sloping Down | Rising | Neutral (Wait for break) | Confused with a Bull Flag if the consolidation is very tight. |
| Rising Wedge | Sloping Up | Rising (Steeper) | Bearish (Reversal) | The “Bull Trap”: Traders buy the breakout, ignoring the rising resistance. |
| Bull Flag | Sloping Down | Sloping Down | Bullish (Continuation) | Often confused with a Descending Channel or a small triangle. |
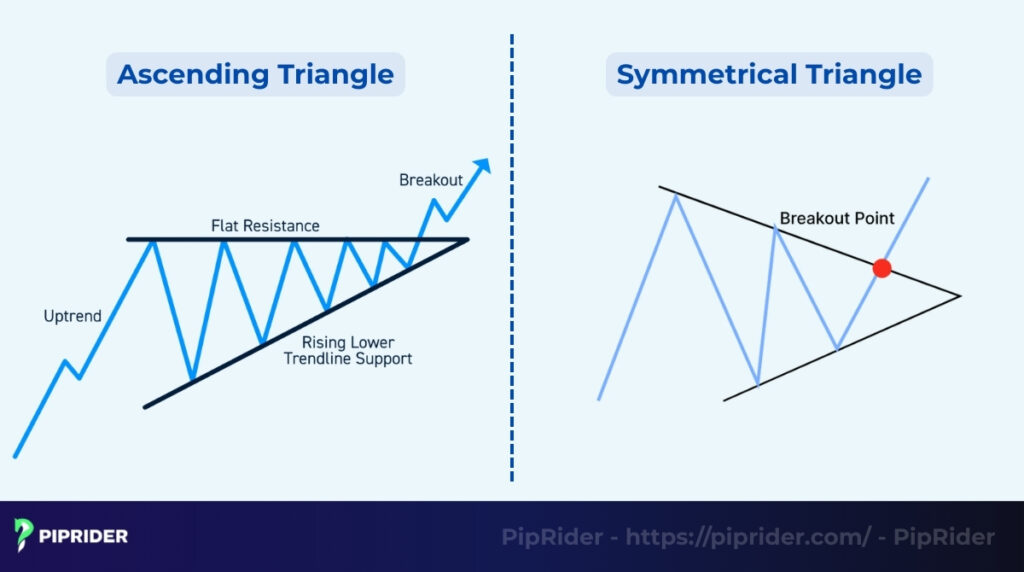
8.1. Ascending Triangle vs. Symmetrical Triangle
While both are consolidation patterns, they reveal different levels of buyer aggression.
- Resistance: The Ascending Triangle chart pattern has a flat resistance (buyers attacking a fixed level), while the Symmetrical Triangle has a descending resistance (sellers pushing price down).
- Bias: The Ascending Triangle is inherently bullish. The Symmetrical Triangle is neutral; the breakout can happen in either direction, requiring more patience.
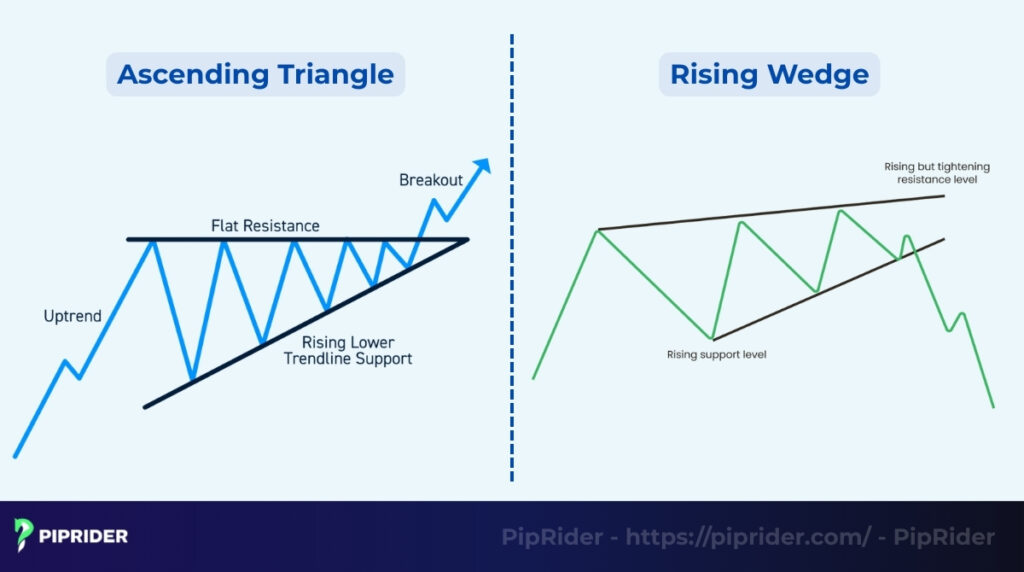
8.2. Ascending Triangle vs. Rising Wedge
This is the most dangerous confusion because the signals are opposite.
- The Slope: In an Ascending Triangle, the top is flat. In a Rising Wedge, both lines slope upward.
- The Outcome: The Ascending Triangle signals that buyers are absorbing supply (Bullish). The Rising Wedge signals that buyers are exhausting themselves chasing price (Bearish Reversal).
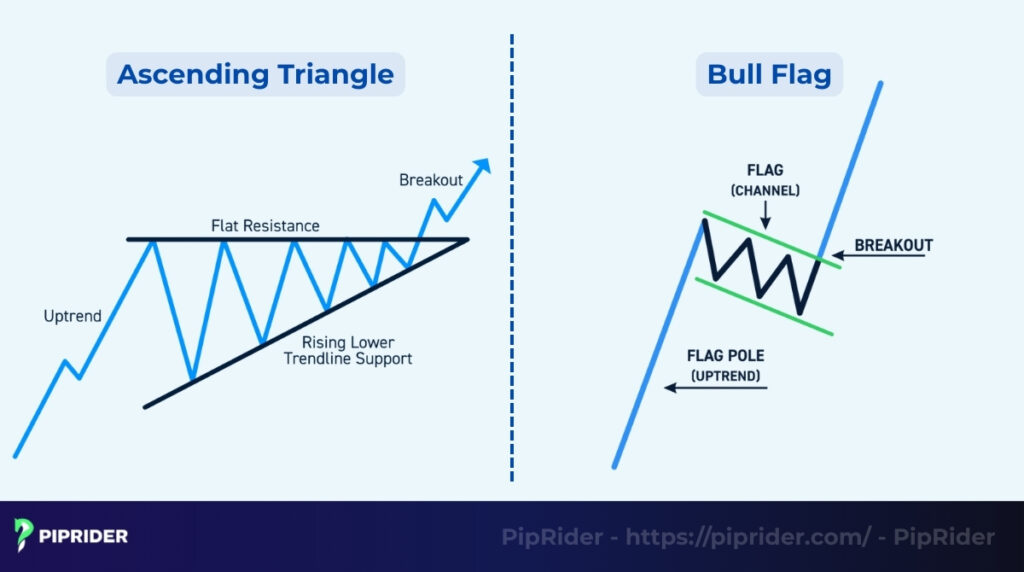
8.3. Ascending Triangle vs. Bull Flag
Both are bullish continuation patterns, but they operate on different timeframes and structures.
- Geometry: The Triangle has converging lines (volatility squeeze). The Bull Flag has parallel lines sloping downward (channel).
- Duration: Flags are typically short-term “pauses” (1-3 weeks) after a sharp spike. Triangles are medium-term “structures” (weeks to months) that build significant energy.
9. Real-World Case Studies: From Theory to Execution
Mastering the Ascending Triangle requires moving beyond textbook diagrams and observing how the pattern “breathes” in live markets. Let’s analyze two distinct scenarios to understand why one resulted in a massive rally and the other in a dangerous trap.
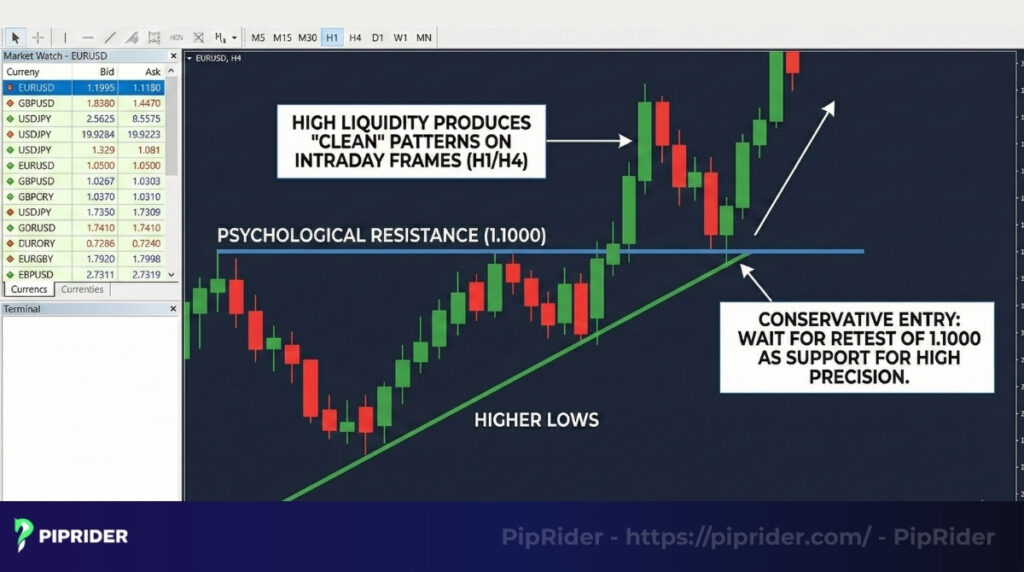
9.1. Case Study 1: EUR/USD H1 – The Classic Continuation
In this scenario, the pattern performed its primary role: acting as a “springboard” for an existing uptrend.
- Market Context: A strong, established uptrend was visible on the H4 timeframe. Price was trading consistently above the 50-period EMA.
- Pattern Formation: A perfect flat resistance formed at 1.0850 with three distinct “higher lows,” showing that buyers were aggressively absorbing all available sell orders.
- The Trigger: A strong bullish candle closed decisively above the 1.0850 ceiling.
- Volume Confirmation: A clear volume spike (1.8x the 20-period average) confirmed institutional “Smart Money” was backing the move.
- Execution Strategy:
- Entry: Opened at the breakout candle close (approx. 1.0855).
- Stop-Loss: Placed at 1.0830 (just below the most recent higher low).
- Target: Measured move of 50 pips, aiming for 1.0905.
- The Result: Price reached the target within 6 hours without ever threatening the stop-loss.
- Key Lesson: Breakouts have the highest win rate when they are aligned with the prior trend and the breakout candle shows real intent (full body, high volume).
9.2. Case Study 2: BTC Daily – The Exhausted Bull Trap
Not all triangles lead to profits. This case study teaches you how to stay on the sidelines when the necessary “confirmation” is missing.
- Market Context: Bitcoin formed a large triangle after a long, exhausted uptrend. Volume had been steadily declining throughout the entire formation—a major red flag.
- The False Trigger: Price pushed above the $60,000 resistance line mid-day, creating a FOMO (Fear Of Missing Out) environment.
- The Failure: Instead of a decisive close, the daily candle left a long upper wick (rejection). By the end of the day, the price crashed back inside the triangle.
- The Outcome: Trapped buyers were forced to liquidate, causing a “Long Squeeze.” Price broke the rising support floor and dropped 15% within 48 hours.
- Execution Strategy (The “No-Trade” Decision):
- Action: No entry was taken.
- Logic: The “Candle Close Rule” was never met. The long wick proved that sellers were still dominating the $60k ceiling.
- Key Lesson: A wick is not a breakout. If the price fails to sustain its position above the ceiling and volume is weak, the triangle is likely a “Bull Trap.” Patience is the best risk management tool.
Diagnostic Comparison: Success vs. Failure
| Feature | Case Study 1 (Success) | Case Study 2 (Failure) |
| Prior Trend | Strong & Healthy | Weak & Exhausted |
| Breakout Type | Decisive Candle Close | Rejection Wick (Fakeout) |
| Volume Spike | High (1.8x average) | Low / Average |
| Final Outcome | Hit Measured Move Target | Bull Trap & Support Breakdown |
10. The Anti-Fakeout Framework: Why Ascending Triangles Fail
Even with a perfect pattern, human error can ruin the trade. Avoid these four common traps that turn profitable setups into losses:
- Confusing trading patterns: Mistaking a Rectangle Pattern (a sideways range with a flat top and flat bottom) for a triangle. Always check that the support line is clearly rising, indicating increasing buyer aggression, rather than just moving sideways.
- FOMO trading: Entering before the breakout candle actually closes. This is essentially gambling on a prediction rather than trading a confirmation, and it often leads to buying the exact top just before the price rejects resistance and reverses.
- Ignoring volume: Trading a breakout that occurs on low or average volume. A valid, sustainable move requires a significant surge in volume to confirm that institutional money is fueling the breakout; otherwise, it’s likely a “bull trap.”
- Poor stop loss: Placing the stop loss too tight, such as exactly on the rising trendline. Market noise and volatility wicks often puncture the trendline momentarily before the price rallies. Always leave a small buffer or use an ATR-based stop to let the trade breathe.
The Ascending Triangle “Anti-Fakeout” Checklist
Run this 7-point diagnostic before every trade to filter out bad setups:
- [ ] Convergence: Do the upper and lower trendlines decisively point toward an Apex?
- [ ] The Rule of 5 (High Quality): Are there a minimum of 3 touches on resistance + 2 touches on support?
- [ ] Momentum Shift: Are the pullbacks getting shallower (forming clear Higher Lows)?
- [ ] Volume Exhaustion: Has trading volume dried up significantly during the squeeze phase?
- [ ] The Confirmation: Is there a clean, full candle body close above the resistance level?
- [ ] The Ignition: Is there a visible volume spike (1.5x – 2x) on the breakout candle?
- [ ] The Runway: Is there at least a 1:2 Risk/Reward ratio before the price hits the next major historical resistance?
11. Which Scanners and Tools Can Automatically Detect the Pattern?
Manually scanning hundreds of charts is inefficient and prone to error. Professional traders leverage specialized software for serious technical analysis to automate the hunt.
- TradingView (Built-in & Community):
Open a chart -> Click “Indicators” -> Type “Chart Patterns” -> Select “Ascending Triangle”. This official tool will automatically highlight valid patterns on your chart in real-time. - FinViz (Free Stock Screener):
Go to the “Screener” tab -> Select “All” -> Under the “Signal” dropdown menu, choose “Triangle Ascending”. This instantly filters thousands of stocks down to a shortlist of high-probability candidates. - TrendSpider (Automated Analysis):
Enable the “Auto-Analysis” button. The AI will instantly draw trendlines across multiple timeframes. You can set dynamic alerts that trigger only when price touches or breaks the resistance line, saving you hours of screen time. - MT4/MT5 Custom Indicators:
Visit the MQL5 Market and search for plugins like “Autochartist” or “ZUP”. These tools scan Forex pairs in the background and pop up an alert window whenever a triangle pattern is detected on your chosen timeframe.
12. Frequently asked questions about Ascending Triangle Chart Pattern
Quick answers to the most common questions traders have about this chart pattern.
13. Conclusion
The Ascending Triangle chart pattern is a premier tool for identifying high-probability trend continuations. Its clear structure, distinct higher lows, and volume contraction provide a roadmap of buyer aggression.
Success lies in disciplined execution. Never rely on shape alone. Always confirm the breakout with a significant volume spike, support from key EMAs, and a valid candle close to avoid costly bull traps. Ready to master the markets? Follow Piprider today for professional insights and advanced trading strategies.


