
The Falling Wedge pattern is a powerful technical formation that signals a potential bullish breakout. Recognizing this structure allows traders to spot when selling pressure is fading and buyers are ready to take control. This guide provides a complete roadmap to mastering the setup. You will learn how to filter out false signals, confirm the breakout with volume, and execute high-probability trades using our step-by-step strategy.
Key Takeaways
- The Falling Wedge is inherently bullish, signaling an upward price movement regardless of the prior trend.
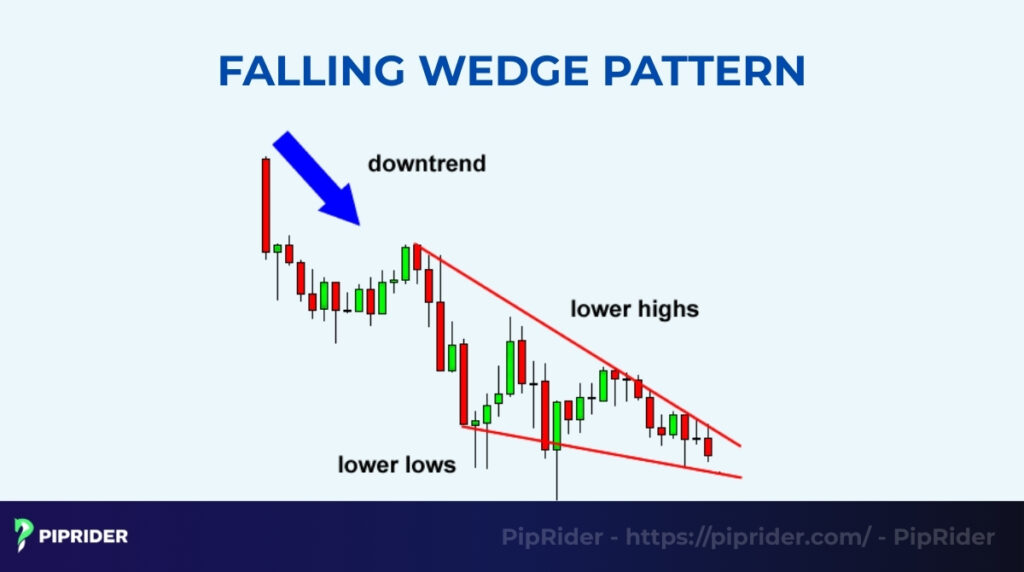
- It features two converging trendlines sloping downward, connecting lower highs and lower lows.
- Volume typically decreases as the wedge forms and must spike significantly to confirm the breakout.
- It acts as a reversal pattern at the bottom of a downtrend and a continuation pattern during an uptrend pullback.
- The theoretical target is calculated by measuring the height of the widest part of the wedge.
Quick Falling Wedge Rules
- Convergence: Two downward-sloping trendlines must clearly converge (squeeze together).
- Structure: Price must form lower highs and lower lows inside the wedge.
- Volume: Volume should contract (decrease) during the pattern’s formation.
- The Trigger: The pattern is ONLY tradable after a clear candle close above the upper trendline.
- Context: The setup is statistically stronger when it forms near major support, demand zones, or as a pullback inside a macro uptrend.
1. What Is the Falling Wedge Pattern?
The Falling Wedge is a bullish technical pattern formed by two downward-sloping trendlines that converge as price action contracts. According to Investopedia, this formation is widely recognized as a bullish signal, indicating that selling pressure is weakening and a price rally is imminent (Scott, 2025).
This setup relies on a fundamental psychological shift known as “seller exhaustion.” While bears attempt to push prices lower, each consecutive dip becomes shallower than the last, signaling that sellers are running out of momentum. As the range tightens, buyers begin to absorb the remaining supply, preparing the market for an explosive upward breakout.
The Falling Wedge is a universal structure found across Forex, Stocks, and Crypto. It typically appears in two main contexts:
- Reversal: Forming at the bottom of a prolonged downtrend.
- Continuation: Forming as a temporary pullback during an established macro uptrend.
In either scenario, the pattern serves as a high-probability signal that the price direction is about to shift in favor of the bulls.
2. How Does the Falling Wedge Structure Form?
A valid wedge is not just a random downward move; it requires specific market geometry where price action contracts, signaling that the battle between bears and bulls is reaching a climax. To confirm a true Falling Wedge, ensure your chart meets these three structural pillars:
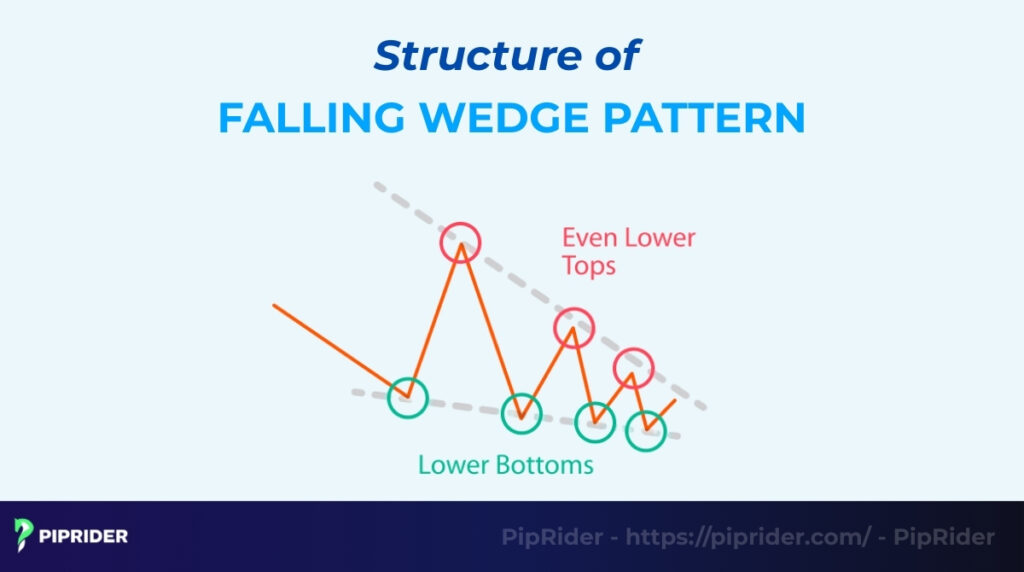
- The “Price Squeeze” (Convergence): Unlike a Parallel Channel where lines run side-by-side, the two trendlines in a wedge must converge. The upper resistance line (connecting lower highs) slopes down steeply, while the lower support line (connecting lower lows) has a much flatter angle. These lines point toward each other, squeezing the price into a tight corner known as the Apex.
- Shallow Lows (Decreasing Momentum): While the market is technically making new lows, they are becoming increasingly shallow. The vertical distance between the highs and lows shrinks as the pattern progresses. This lack of “downward depth” is the primary evidence that bears are losing their ability to push prices lower, even if they still technically hold the lead.
- The Rule of 5 (Validation): To filter out market noise, a professional-grade pattern typically requires at least five reversal points to be mathematically sound. This means you need a minimum of 3 touches on the upper resistance line and 2 touches on the lower support line. If your drawing only has one or two touches, it remains a speculative line rather than a confirmed structure.
3. What Are the Two Types of Falling Wedge Patterns?
The shape looks identical, but the strategy changes based on the market trend. Use this table to determine if you are catching a reversal or riding a trend.
| Type | Market Trend | Signal | Reliability |
| Reversal Falling Wedge | Downtrend | Bullish reversal | Medium |
| Continuation Falling Wedge | Uptrend pullback | Bullish continuation | Higher |
3.1. Reversal Falling Wedge (The “Bottom Fisher”)
The reversal Falling Wedge is the classic reversal pattern that aggressive traders look for to catch market bottoms. It typically marks the final exhaustion point of a long-term bear market, offering a chance to enter at the very start of a new trend.
- The Setup: Price has been falling for weeks or months, but the downward momentum starts to stall.
- The Psychology: Sellers are exhausted and can no longer push the price down efficiently, allowing buyers to gradually take over.
- Risk Warning: Catching a falling knife is dangerous. If the breakout fails, the downtrend can resume violently. Always wait for a confirmed candle close above the upper line.
3.2. Continuation Falling Wedge (The “Trend Rider”)
In contrast, the continuation Falling Wedge appears in the middle of a strong uptrend, acting as a temporary pause or “breather” for the bulls. This setup is statistically safer because you are trading in the direction of the established momentum rather than trying to fight it.
- The Setup: The market rallies strongly, then rests briefly by drifting down in a tight, converging range.
- The Psychology: Early buyers are taking profits, but sellers are too weak to reverse the trend. Smart money uses this dip to accumulate more positions.
- Pro Tip: Focus on this variation if you are a beginner. It offers a higher probability of success since the “tide” is already rising in your favor.
4. What Defines a Valid Falling Wedge Setup?
A messy chart leads to messy results. To trade with confidence, ensure your pattern meets these four strict technical criteria before you even think about clicking “buy.”
4.1. Trendline Integrity & The Convergence Ratio
While Section 2 covers the basic geometry, a “tradable” setup requires strict trendline integrity. Before placing a trade, apply these two quality filters:
- The Convergence Check: Do not trade a “sloppy” wedge. If the trendlines are almost parallel, the price squeeze is too weak to generate an explosive breakout. The lines must point decisively toward an Apex. If they don’t meet within a reasonable distance on your screen, you are likely looking at a Descending Channel.
- The Cleanliness Rule: Avoid forcing trendlines through the bodies of candles just to make them fit. A valid wedge should have clean touches on the wicks or bodies without excessive “overlap.” If the price is constantly leaking outside your lines before the actual breakout, the structure is fractured and unreliable.
4.2. Volume Behavior (The Fuel)
Volume acts as the “lie detector” of the market. It confirms whether the price drop is genuine selling or just a lack of buying interest.
- During Formation: Volume should decay (decrease) as the price moves deeper into the wedge. This confirms that selling pressure is drying up.
- At Breakout: You need to see a massive volume spike when the price breaks the upper trendline. A breakout on low volume is often a “fakeout” or a trap.
4.3. Time Duration & Reliability
The amount of time a pattern takes to build directly affects its potential power. Quick, intraday wedges are often just noise, while longer structures build significant energy.
- The Rule: Generally, the longer the wedge takes to form, the more explosive the breakout will be.
- Timeframes: Wedges forming on 4-Hour (H4) or Daily (D1) charts are far more reliable than those on 5-minute charts, which are prone to random volatility.
4.4. Market Context (Location Matters)
Never trade a shape in isolation. The location of the wedge relative to the bigger picture is just as important as the shape itself.
- Confluence: A wedge forming exactly at a major support level or demand zone has a significantly higher win rate. This is because touching a long-term Moving Average (like the 200 EMA) at the same time provides strong confirmation, regardless of broader market trends.
- Avoid: A wedge “floating” in the middle of the chart with no historical support is risky.
5. How Do You Identify the Falling Wedge Pattern?
You identify the Falling Wedge Pattern by confirming four key elements: the convergence of its trendlines, a visible decrease in volume during its formation, structural symmetry, and the context of the prior trend. Use this checklist to validate the pattern before looking for an entry.
5.1. Step-by-Step Identification Checklist
Building a reliable trade requires a logical sequence of checks. Follow this systematic process to confirm the structural integrity of the wedge before making any trading decisions.
- Check the trend: Identify if you are trading a reversal (downtrend context) or a continuation (uptrend context).
- Draw Trendlines: Connect lower highs and lower lows. The lines must converge (point towards each other), not run parallel.
- Observe volume: Look for a steady decrease in volume as the price range tightens.
- Check pivot touches: You need a minimum of two clear touches on both the upper and lower trendlines.
- Confirm price action: Look for small candles and long wicks near the apex, indicating market indecision.
5.2. Indicators for Confirmation
Price action tells you what is happening, but these technical tools reveal why. Using them together creates a strong confluence of signals that drastically reduces false positives.
- RSI divergence: A Bullish Divergence (Price makes lower low, RSI makes higher low) is a strong sign of an incoming reversal.
- MACD bullish cross: A crossover above the signal line confirms momentum is shifting to buyers.
- Volume spike: The breakout candle must show a surge in volume to be valid.
- Moving Averages: A breakout that also clears the 50 EMA provides double bullish confirmation.
6. Best Timeframes for the Falling Wedge Pattern
Because the financial markets are fractal, you can spot a Falling Wedge on a 1-minute chart just as easily as on a Weekly chart. However, its reliability scales directly with the timeframe you choose. The longer the pattern takes to form, the more institutional money is trapped, resulting in a significantly more powerful breakout.
- Daily (D1) and 4-Hour (H4) – The Cleanest Structure: These are the gold standards. Higher timeframes naturally filter out intraday algorithmic noise and represent genuine shifts in institutional supply and demand. Breakouts here offer the highest win rates and the most sustained trends.
- 1-Hour (H1) – The Middle Ground: Usable for active swing traders, but it requires strict validation. Because the H1 chart is subject to session-specific volatility, you must use additional filters (like RSI divergence, volume spikes, or a 50-EMA crossover) to confirm the breakout.
- 15-Minute (M15) and 5-Minute (M5) – The Danger Zone: These lower timeframes are incredibly noisy, chaotic, and heavily manipulated by “stop hunts.” What looks like a perfect wedge on an M5 chart is often just a random 30-minute consolidation block on the H1 chart. Beginners should avoid trading this pattern on these timeframes entirely.
- The Crypto Exception: If you choose to trade highly volatile assets like Crypto on lower timeframes, you must apply extreme defensive rules. Never trade a wick. Demand a strict candle body close outside the trendline and rely heavily on an ATR-based stop-loss to survive erratic intraday price swings.
7. How to Trade a Falling Wedge Step by Step
Before diving into specific entry and exit formulas, you need a strict chronological workflow. When you spot a potential wedge forming on your chart, follow this exact 7-step sequence to execute the trade safely:
- Step 1: Identify the Trend Context. Determine if the wedge is forming at the bottom of a macro downtrend (Reversal) or during a pullback within an established uptrend (Continuation).
- Step 2: Draw Converging Trendlines. Connect at least two lower highs for your upper resistance line, and two lower lows for your support line. Visually confirm that the lines are squeezing together, not running parallel.
- Step 3: Confirm Volume Contraction. Look at the volume indicator at the bottom of your chart. Trading activity must fade as the price gets squeezed tighter into the wedge apex.
- Step 4: Wait for the Breakout Close. Patience is non-negotiable. Do not anticipate the move. Wait for a solid candlestick body to strictly close above the upper resistance line, ideally accompanied by a volume spike.
- Step 5: Execute Your Entry. Choose your entry based on your risk profile: either buy the immediate breakout (aggressive) or wait for the price to pull back and retest the broken trendline (conservative).
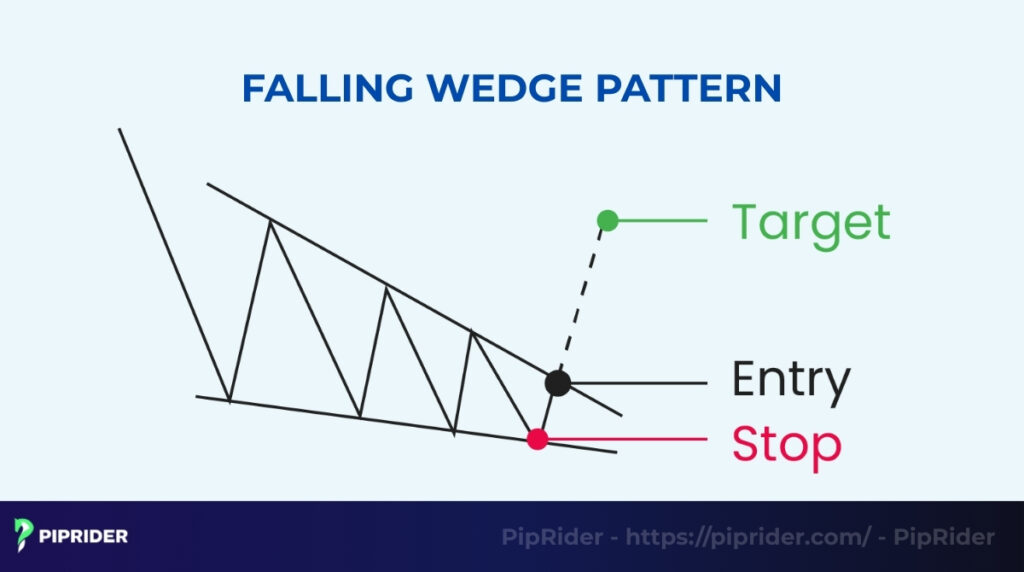
- Step 6: Place Your Stop-Loss. Immediately place your protective stop below the last internal swing low of the wedge or below the lower support line. If the price falls back down here, the bullish thesis is invalidated.
- Step 7: Set Your Profit Target. Measure the vertical height of the wedge at its widest point and project it upward from your breakout level. Take partial profits at this “Measured Move,” or at the next major historical resistance zone.
7.1. Entry Strategies
Choosing the correct entry depends entirely on your risk tolerance. Traders typically choose between an aggressive immediate entry and a conservative confirmation entry.
- Entry 1 (Aggressive Breakout): Open a long position immediately when the breakout candle closes above the upper trendline.
- Entry 2 (Conservative Retest): Wait for the price to pull back to the broken trendline. Enter when the price rejects the line (the old resistance becomes new support).
Trader Profiling: Which Execution Fits You?
Do not guess your entry. Align your strategy with your risk profile and the market environment:
- The Aggressive Breakout (Risk-More, Miss-Less): Best for experienced momentum traders. You accept a higher risk of getting trapped in a “fakeout” to guarantee you catch the explosive move immediately.
- The Conservative Retest (Capital Preservation): The absolute best choice for beginners and conservative swing traders. You demand confirmation. This offers a significantly higher win rate, even if it means occasionally missing a trade that never pulls back.
Piprider Risk Modifier: Regardless of your entry choice, if you are trading highly volatile assets (like Crypto or low-cap stocks), pair it with an ATR-based stop-loss. This gives your trade the necessary “breathing room” and prevents algorithmic wicks from hunting your stop before the real breakout begins.
7.2. Optimal Stop-Loss Placement
Placing the stop loss is the foundation of risk management. The tight convergence of the wedge allows for a clear, low-risk placement.
- Below the nearest low: Place the stop loss just below the last swing low formed inside the wedge structure.
- Below Wedge support: Place the stop loss below the lower support trendline of the wedge.
- ATR-based stop: Use the ATR indicator (Average True Range) to set a stop that accounts for current volatility.
7.3. Profit Targets
The structure provides a clear, objective target, removing emotional guesswork. The most common method relies on measuring the height of the pattern.
- Measurement technique: Calculate the vertical height of the wedge at its widest point (the beginning).
- Projection: Project that measurement upward from the breakout point to determine your optimal exit point.
- Trailing stop: After hitting the first target, use a trailing stop to manage the remainder of the position and maximize potential gains from a strong trend continuation.
7.4. Avoiding False Breakouts
False breakouts are the biggest threat to profitability. Use these final filters as a mandatory checklist to validate the move before pulling the trigger.
- Volume filter: The breakout candle must be accompanied by a noticeable spike in volume.
- Candle close confirmation: The price must close cleanly outside the upper trendline, a wick poking through is not sufficient.
- Checklist before entry: Quickly confirm the RSI is not overbought and the overall market context is favorable.
7.5. Risk–Reward Ratios
The Falling Wedge naturally offers favorable risk-to-reward metrics. Its structure allows you to place a tight stop loss close to the entry point.
- Optimal R:R: Aim for a minimum 1:2 or 1:3 risk-to-reward ratio. The tight stop loss placement ensures that even a small target can justify the risk taken.
- When to avoid: Do not trade the pattern if the target price is closer than 1:1 R:R, or if a major resistance level sits directly above the breakout point.
8. Execution Examples in Real Markets
Theory means nothing without execution. The Falling Wedge behaves differently depending on an asset’s liquidity, volume profile, and volatility. Below are three archetypal execution breakdowns—based on typical real-world market behaviors—demonstrating how professional traders adapt their strategy across Forex, Stocks, and Crypto.
8.1. Forex Case Study: The Textbook Retest (EUR/USD)
Forex markets are highly liquid, making them the most reliable environment for clean “textbook” patterns and conservative entries.
- Context: A prolonged daily downtrend reaches a major psychological support level (e.g., 1.0500). Selling momentum visually slows down.
- Pattern Type: Reversal Falling Wedge.
- Confirmation: Bullish divergence on the RSI (price makes a lower low, but RSI makes a higher low) paired with a 4-Hour (H4) candle close above resistance.
- Entry: Conservative Retest. A buy limit order is triggered when the price pulls back to “kiss” the broken upper trendline.
- Stop Loss: Placed 15-20 pips below the lowest wick of the retest candle to avoid minor spread fluctuations.
- Target: The measured move (height of the wedge), which perfectly aligns with the next major supply zone above.
- Why it Worked: High liquidity ensures that broken resistance cleanly flips to new support. The confluence of a psychological price level and RSI divergence provided strong institutional backing.
8.2. Stock Case Study: The Volume Ignition (AAPL)
Trading equities requires a strict focus on real trading volume and gaps, especially around the market open and earnings reports.
- Context: A strong macro uptrend. The stock pulls back sluggishly over two weeks, forming a wedge prior to an upcoming earnings announcement.
- Pattern Type: Continuation Falling Wedge.
- Confirmation: A massive volume spike at the New York session open, pushing the price cleanly out of the wedge structure.
- Entry: Aggressive Breakout. The trader buys at the market open, as the immediate volume surge validates the breakout.
- Stop Loss: Placed strictly below the last internal swing low of the wedge structure.
- Target: The previous all-time high. Once hit, the trader transitions to a trailing stop to capture the remaining post-earnings momentum.
- Why it Worked: In the stock market, volume is king. The institutional volume spike at the open proved real demand, instantly absorbing any residual selling pressure and preventing a fakeout.
8.3. Crypto Case Study: Surviving the Volatility (BTC/USD)
Crypto is notorious for extreme volatility, algorithmic “stop hunts,” and long wicks. Survival requires immense patience and wider safety margins.
- Context: A high-volatility weekend trading session. Bitcoin is consolidating in a downward squeeze near the Daily 200 EMA.
- Pattern Type: Continuation Falling Wedge.
- Confirmation: Waiting exclusively for a definitive Daily (D1) candle close. A sudden 1-hour wick spikes above the line but immediately collapses back inside.
- Entry: Delayed Aggressive. The trader ignores the intraday wicks and only enters after the Daily candle closes strongly above the resistance line.
- Stop Loss: An ATR-based stop-loss is placed significantly below the wedge support (e.g., 2x ATR) to give the trade breathing room.
- Target: The next major historical liquidity pool (previous month’s high).
- Why it Worked: By demanding a Daily candle close and using an ATR stop, the trader successfully avoided the notorious “Darth Maul” liquidity wicks that routinely liquidate impatient intraday traders in crypto.
8.4. Success Rate & Statistical Reality
While the Falling Wedge is historically cited as one of the more reliable bullish wedge structures, professional traders treat pattern probability as a statistical edge, not a guarantee.
- The Baseline Data: Research in technical analysis often points to a high probability of an upward breakout, with theoretical success rates sometimes cited between 70% to 80% (Bulkowski, 2021). However, relying solely on isolated statistics is a dangerous trap for retail traders.
- The Reality of Variables: In live trading, pattern statistics vary significantly by market, timeframe, and execution rules. A wedge that takes three months to form on a highly liquid Forex Daily chart will inherently have a different reliability profile than a 15-minute wedge in a volatile Crypto market.
- The Confluence Factor: A pattern’s shape is only one piece of the puzzle. Its real-world performance exponentially improves when volume, market context, and decisive breakout confirmation perfectly align.
9. Which Falling Wedge Setup Is Best for Beginners?
For novice traders, the goal is not to catch every single market movement; the primary goal is capital preservation. The financial markets are unforgiving to those who try to force trades in suboptimal conditions.
If you are a beginner, you should ignore the highly aggressive setups and strictly follow this “Green Light” Blueprint:
1. Prioritize Continuation over Reversal
- The Rule: Only trade the Continuation Falling Wedge (a wedge that forms during a pullback in a macro uptrend).
- The Logic: “The trend is your friend.” Trading a continuation means you have the overarching market momentum pushing your trade into profit. Trying to trade a Reversal Wedge at the bottom of a massive crash is akin to “catching a falling knife.” Leave bottom-fishing to the professionals.
2. Higher Timeframes Only (H4 / Daily)
- The Rule: Ignore wedges forming on the 5-minute (M5) or 15-minute (M15) charts. Focus strictly on the 4-Hour (H4) and Daily (D1) timeframes.
- The Logic: Lower timeframes are littered with algorithmic noise and “stop hunts.” A pattern that takes weeks to form on a Daily chart traps significantly more institutional money, making the eventual breakout much more reliable and explosive.
3. Demand the “Retest Entry”
- The Rule: Never buy the initial breakout. Wait for the price to break the upper resistance line, pull back to “kiss” that line from above, and form a bullish rejection candle.
- The Logic: Buying the aggressive breakout often leads to getting trapped in a “fakeout.” The retest confirms that the old resistance has officially flipped to new support, drastically increasing your win rate and allowing for a tighter stop-loss.
Piprider’s Verdict: The ultimate beginner setup is a Continuation Wedge on an H4 chart, entered purely on a Retest. If the chart doesn’t meet these three criteria, close the laptop and walk away.
10. How Can You Apply Advanced Techniques to the Falling Wedge?
Moving beyond basic identification, advanced traders combine the pattern with institutional concepts like Supply/Demand and Multi-Timeframe analysis to filter out noise and maximize their edge.
10.1. Multi-Timeframe Analysis (MTF)
MTF analysis filters noise and ensures you are trading with the primary market tide, not against minor fluctuations.
- The Rule: Always confirm the higher timeframe (Daily or Weekly) trend or structure before executing on the lower one (H4 or H1).
- Action: Check if your wedge apex aligns with a major support level or a Demand Zone visible on the Weekly chart. This confluence adds significant weight to the signal.
10.2. Supply–Demand Integration (S/D)
The wedge itself signals buyer dominance, but its location at a strong demand zone confirms institutional interest.
- The Setup: Look for the wedge formation to terminate (apex) precisely within a well-defined demand zone (an area where institutional buying pressure entered the market previously).
- Result: A breakout from a wedge that terminates in demand often results in a faster, more explosive rally.
10.3. Combining with Order Blocks (Advanced Pricing)
This technique is derived from Smart Money Concepts (SMC), using the wedge structure to validate a powerful entry at an institutional level.
- The Concept: Identify a large institutional order block below the wedge structure. The wedge’s price contraction should occur near or inside this area.
- Premium/Discount: Ensure the price is trading at a “Discount” (low price range) relative to the recent structure before the bullish breakout, confirming the asset is undervalued.
10.4. Using Screeners & Tools
Manually checking hundreds of charts is inefficient. Automated tools provide immediate alerts, ensuring you never miss a high-probability setup.
- TradingView/TrendSpider: These platforms allow you to set up alerts to notify you immediately when converging trendlines are detected across multiple assets.
- Efficiency: Use screeners to narrow your focus to only those assets that are currently setting up a wedge formation.
10.5. Quantitative / Backtesting Approach
Backtesting is essential for building confidence and verifying the pattern’s statistical edge on your specific assets and timeframes.
- The Process: Test the wedge’s success rate, risk placement, and target accuracy on 50–100 historical instances of your chosen asset (e.g., BTC/USD).
- Verification: Verify the pattern’s statistical accuracy under your own rules. This personal confidence is crucial for sticking to your plan during stressful trades.
11. How Does the Falling Wedge Compare to Other Chart Patterns?
Confusing the Falling Wedge with a triangle or a channel is a critical mistake. Use this quick comparison guide to differentiate the trading patterns based on their essential geometry.
| Pattern | Key Feature | Psychological Signal | Typical Outcome |
| Falling Wedge | Lines slope down and converge | Selling pressure is exhausting | Bullish Breakout |
| Descending Channel | Lines slope down and remain parallel | Bears are in stable control | Ongoing Downtrend |
| Descending Triangle | Flat support + falling resistance | Buyers are struggling to hold a floor | Usually Bearish Breakdown |
| Bull Flag | Short, tight parallel channel | Taking a breather after a massive pump | Bullish Continuation |
Downward-sloping patterns often look identical to the untrained eye, but their underlying psychology varies greatly. Use the comparison table below to instantly distinguish the Falling Wedge from its common “look-alikes” before diving into the detailed breakdowns.
11.1. Falling Wedge vs Descending Channel
The most common mistake novice traders make is confusing a Falling Wedge with a Descending Channel. While both patterns slope downward and print lower highs and lower lows, their underlying market psychology is entirely different.
- The Falling Wedge (The Squeeze): The upper and lower trendlines converge. This physical squeeze on the chart indicates that selling momentum is drying up. The market is compressing like a coiled spring, building energy for an explosive, highly probable bullish breakout.
- The Descending Channel (The Escalator): The upper and lower trendlines run perfectly parallel. There is no squeeze and no loss of momentum. The market is simply walking down an escalator in a controlled, stable downtrend. It is a trend-following structure, not an imminent reversal pattern.
Piprider Pro Tip: If you can easily draw a perfect parallel box over your downward trend, it is not a wedge. Do not anticipate a sudden, explosive wedge-like breakout from a stable parallel channel.
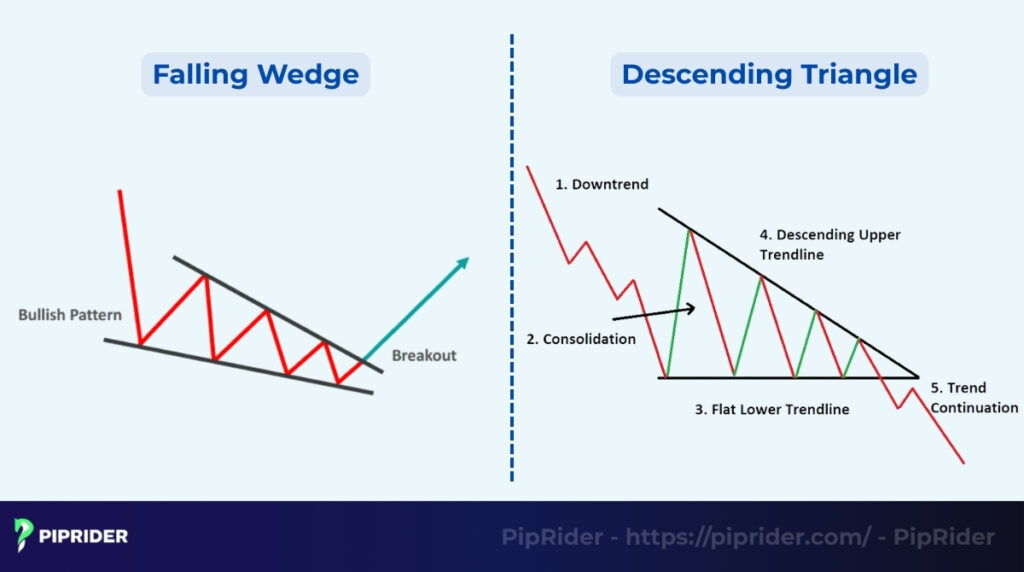
11.2. Falling Wedge vs Descending Triangle
This is a critical distinction because the two patterns often have opposite trade outcomes.
- The Difference: The Descending Triangle has a flat, horizontal support line, indicating that buyers are defending a fixed price floor. The Falling Wedge has a sloped support line, meaning the price floor is consistently moving lower as sellers lose momentum.
- The Signal: The Triangle usually resolves downward (bearish continuation), while the Wedge almost always resolves upward (bullish reversal), making the distinction vital for directional bias (Bulkowski, 2021).
- The Context: While a Falling Wedge often appears at the end of a downtrend as a bullish reversal, a Descending Triangle typically forms within a downtrend, acting as a sign of continued bearish dominance.
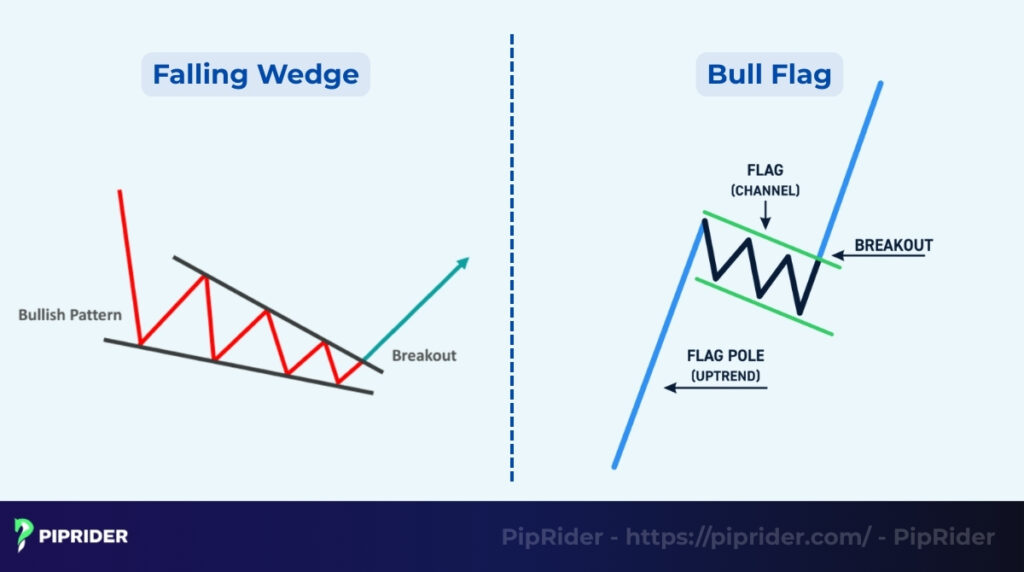
11.3. Falling Wedge vs Bull Flag
Both patterns are common bullish continuation signals, but they differ in their internal structure and subsequent potential volatility.
- The Difference: A Bull Flag (or Bear Flag) is defined by its parallel support and resistance lines. The Wedge, however, is defined by convergence.
- The Logic: Because the Wedge squeezes the price more tightly, it builds more energy, often leading to a more explosive breakout than a standard Bull Flag.
12. When a Falling Wedge Pattern Is Weak or Invalid
Even if a shape on your chart visually resembles a wedge, taking a flawed setup is the fastest way to lose capital. Professional traders don’t just look for reasons to enter a trade; they actively look for reasons to stay out.
Protect your portfolio by instantly abandoning the setup if you spot any of these 7 Red Flags:
- Parallel Lines (No Convergence): If the upper resistance and lower support lines run parallel to each other, you are looking at a Descending Channel, not a wedge. Without lines converging, the ‘price squeeze’ necessary for a wedge breakout is non-existent. (See Section 11.1 for a full comparison).
- The “Floating” Wedge (No Context): A pattern forming in the middle of nowhere is highly unreliable. If there is no clear prior trend, or if the wedge apex does not align with a major support level or institutional demand zone, the pattern lacks the context needed to force a reversal.
- The Low-Volume Fakeout: This is the ultimate trap for retail traders. If the price breaks above the upper trendline but trading volume remains flat or below average, “Smart Money” is not participating. This is a false breakout, and the price will likely collapse back into the wedge.
- Wick-Only Breakouts: A long wick piercing the resistance line is a liquidity grab, not a breakout. The pattern remains completely unconfirmed until a solid candle body strictly closes outside the wedge.
- Choppy, Sideways Markets: The Falling Wedge is a momentum pattern. If the broader market is trapped in a noisy, sideways consolidation range, the wedge loses its predictive edge and often generates false signals.
- A Blocked Runway (Poor Risk-to-Reward): Look left before you leap. If a major horizontal resistance level or a heavy Moving Average (like the 200 EMA) sits just a few pips above your breakout point, the trade is mathematically invalid. Never take a trade where your potential profit is blocked by immediate resistance.
- Major News Events Imminent: Technical patterns rely on normal market psychology. If a major economic event (like a CPI release, NFP, or Central Bank rate decision) is scheduled within hours, the wedge’s predictive power is temporarily overridden by fundamental volatility. Step aside and wait for the dust to settle.
Piprider Safety Rule: Treat this list as a strict filtration system. If your wedge setup has even one of these red flags, delete the drawing and move on to the next chart.
13. Frequently asked questions about Falling Wedge Pattern
14. Summary: Key Takeaways & Final Checklist
The Falling Wedge pattern is one of the most reliable bullish patterns in technical analysis, signaling that selling pressure is exhausted and a powerful rally is imminent. Success hinges on disciplined validation of the pattern’s geometry and volume.
Five Core Rules for Trading the Wedge
- Bullish signal & Context: Confirm the bullish signal forms at a key support level (Reversal or Continuation).
- Geometry is mandatory: The pattern is defined by two converging trendlines that both slope downward (Not parallel).
- The volume filter: Demand a volume spike on Breakout. Breakouts lacking volume are high-risk fakeouts.
- Execution strategy: Prioritize the retest entry after a confirmed candle close above resistance.
- Risk discipline: Always set a tight stop loss (Below the nearest swing low) and ensure a minimum 1:2 Risk-to-Reward Ratio.
Ready to master advanced chart patterns?
Don’t trade alone. Follow Piprider today for daily market insights and professional analysis to improve your trading decisions. Access our complete library of advanced trading strategies now.


