
The Bullish Harami is a foundational candlestick formation that signals a potential end to a bearish trend and the beginning of a bullish recovery. This guide provides a comprehensive breakdown of how to identify this pattern, understand its psychological drivers, and execute high-probability trades by filtering out market noise.
Key Takeaways
- The Bullish Harami is a reversal pattern that appears during a bearish trend.
- It features a large bearish “mother” candle followed by a small bullish or neutral “baby” candle completely contained within the mother’s body.
- The pattern signals that selling pressure is weakening and indecision has set in, often preceding a trend shift.
- Reliability increases significantly when combined with volume spikes, key support levels, or RSI divergence.
- This setup is effective across all major markets, including Forex, Crypto, and Stocks.
Quick Definition Box: The Bullish Harami
- Pattern Type: Bullish Reversal (Two-Candle Setup).
- Location: Found at the end of a clear downtrend or at key support levels.
- Visual: A large bearish “Mother” candle followed by a small “Baby” candle (bullish or neutral) completely contained within the Mother’s body.
- Core Message: Selling exhaustion has reached a climax, and buyers are beginning to absorb the remaining supply.
- Confirmation Needed: A breakout above the high of the Mother candle or supporting indicator signals (RSI/Volume).
1. What Is the Bullish Harami Pattern?
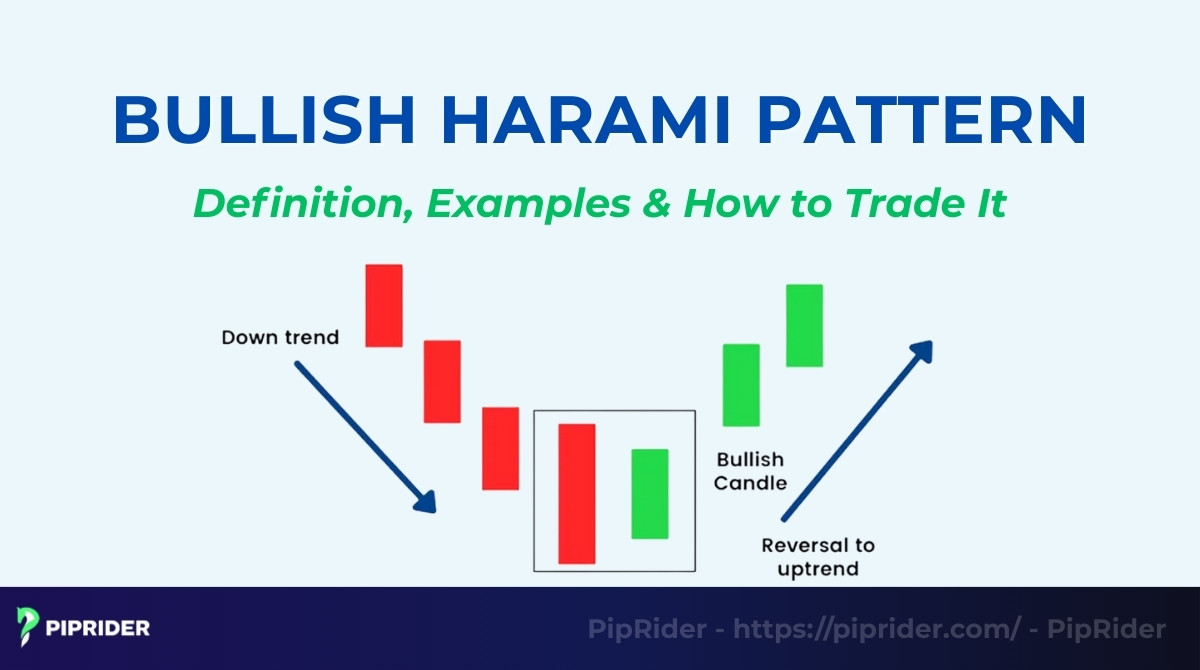
The Bullish Harami is a two-candle Japanese candlestick pattern that serves as an early warning sign for technical traders. Found typically at the conclusion of a downtrend, it illustrates a moment where the market’s aggressive downward momentum hits a wall of demand, resulting in a “pause” that often precedes a price rally.
1.1. Definition in Technical Analysis
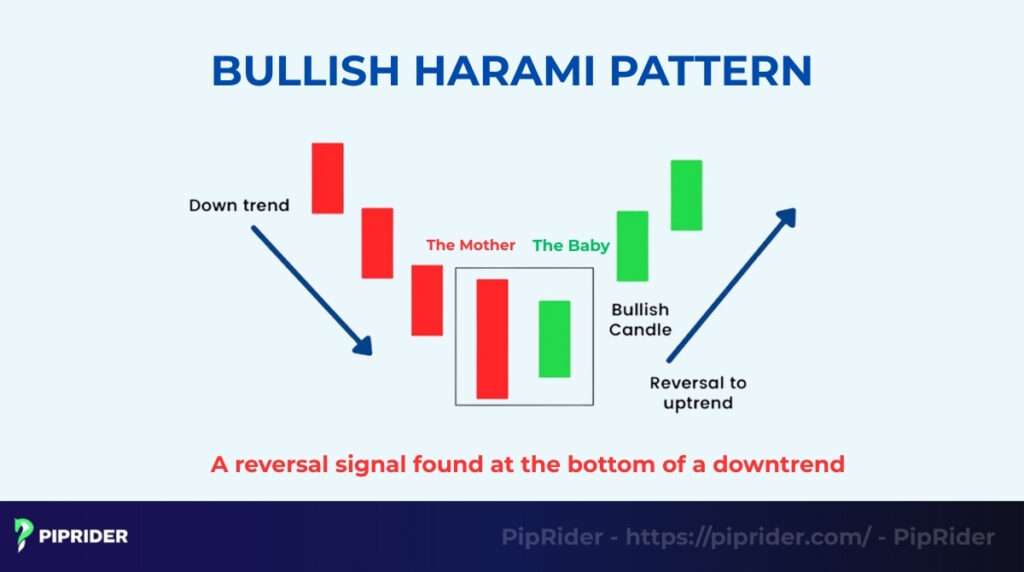
In the world of price action trading, the name “Harami” is derived from the Japanese word for “pregnant” (Chen, 2025), which describes the visual relationship between the two candles. The structure is composed of:
- The Mother (First Candle): A long, bearish (red/black) candle that represents the final stage of the existing downtrend. It shows that sellers were initially in complete control, pushing the price to a significant low.
- The Baby (Second Candle): A much smaller candle that opens and closes entirely within the vertical range of the first candle’s real body. This candle can be bullish (green/white) or neutral.
This visual metaphor represents the “birth” of a new market direction, where the dominant bearish energy is successfully contained and countered by emerging bullish interest.
1.2. Why It Indicates a Reversal
The Bullish Harami is more than just a visual oddity; it represents a fundamental shift in market psychology. To understand why it indicates a reversal, we must look at the transition between the two sessions:
- The Climax: The long red candle represents the peak of bearish sentiment. At this stage, most retail sellers are “all in,” often resulting in a selling climax.
- The Contraction: The second day shows a dramatic contraction in volatility. The fact that the price stays within the previous day’s range—and refuses to make a new low—suggests that sellers have run out of momentum.
- The Shift: When the market fails to follow through on the bearish momentum of the first candle, short-sellers begin to cover their positions (buy back), and “smart money” starts to accumulate, creating the necessary conditions for an upward move.
1.3. Bullish Harami vs. Harami Cross
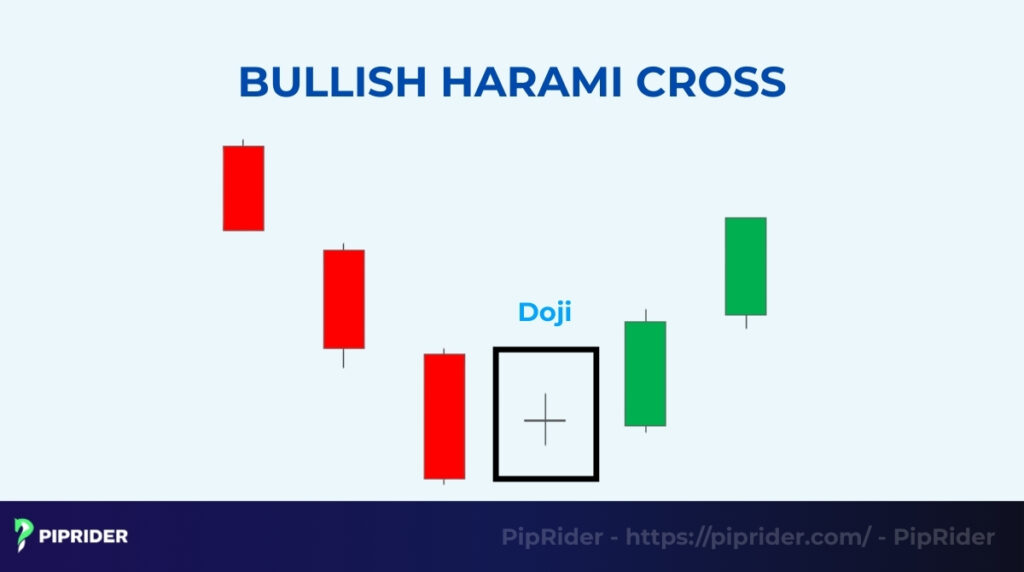
Traders often distinguish between the standard pattern and the Bullish Harami Cross. In the “Cross” variation, the second candle (the baby) is a Doji, meaning its opening and closing prices are virtually identical.
Because a Doji represents absolute equilibrium and extreme indecision after a period of high-intensity selling, the Harami Cross is generally considered a more potent reversal signal than the standard version. It implies that the bears have lost all ability to push the price lower, leaving the door wide open for buyers to seize control.
2. What Does a Valid Bullish Harami Look Like?
To distinguish a high-probability reversal from random market noise, traders must verify specific technical criteria. While the pattern may appear simple, its validity depends heavily on the preceding price action and the structural relationship between the two candles.
2.1. Core Identification Rules
- The Pre-Condition (Downtrend): Context is the most critical factor. A Harami pattern is meaningless if it appears in a sideways market or an existing uptrend. Traders must see a clear series of lower lows and lower highs leading into the pattern, confirming that a bearish trend is active immediately before the signal forms.
- The Mother Candle (Large & Bearish): The first candle represents the final, aggressive push of the sellers. It must be a long bearish candle with a substantial body, indicating that selling pressure was intense and the price closed near the session low.
- The Baby Candle (Small & Contained): The second candle signals that the trend has hit a wall. It must be a small candle (ideally bullish, though neutral is acceptable). The crucial rule is that its entire real body must be contained within the vertical range of the first candle’s body.
2.2. Market-Specific Nuances (The Gap Up)
In the stock market, a valid Bullish Harami typically features a Gap Up at the open of the second candle (opening higher than the previous close). This gap surprises the bears, who expected the price to continue falling.
However, in the Forex and Crypto markets, which trade 24/7, literal price gaps are rare. In these markets, the “surprise factor” is identified not by a gap, but by the price’s inability to move lower despite the strong bearish close of the mother candle. For non-equity markets, focus on the range containment rather than the presence of a gap.
3. What Is the Market Psychology Behind the Bullish Harami?
The Bullish Harami visualizes a critical moment of doubt in the market. It represents the transition from fear and panic selling to a state of equilibrium and potential recovery.
3.1. Selling Climax & Exhaustion (The Bear Trap)
The first large red candle represents the climax of bearish pressure. Bears are confident, dumping shares or contracts aggressively to close at the lows. However, the second small candle acts as a “brake.” The fact that the price refuses to drop lower shocks the remaining sellers. They realize the “easy money” on the short side has likely been made, leading to profit-taking and a reduction in selling pressure.
3.2. Buyers Step In at Key Demand Zones
The Harami rarely works in isolation; its power comes from its location. Institutional buyers often place large buy limit orders at key support levels or demand zones. As retail traders panic-sell during the first candle, these institutions absorb the liquidity. The second “inside” candle is the evidence that this demand wall has successfully halted the decline, suggesting that “smart money” is now defending the level.
3.3. Market Indecision and the “Short Squeeze”
The small inside candle represents a state of equilibrium where volatility contracts. The market is catching its breath after a plunge. This pause is dangerous for bears holding short positions; if the price breaks upward from this consolidation, it can trigger a cascade of short-covering. This “short squeeze” provides the initial fuel for the new bullish trend.
3.4. Psychology Summary: The Reversal Logic
- Climax: Sellers push the price to an extreme (The Mother Candle).
- Absorption: Buyers meet the sellers at a support zone, halting the move.
- Contraction: Volatility dries up as the market reaches a temporary balance (The Baby Candle).
- Confirmation: A break above the Mother candle’s high forces bears to exit and attracts new buyers.
4. What Are the Types of Bullish Harami Patterns?
The Bullish Harami is not a monolithic setup; its appearance and the surrounding market context dictate the strength of the reversal signal. By categorizing these patterns, traders can better assess whether a signal represents a minor pause or a high-conviction trend shift.
4.1. Standard Bullish Harami
The Standard Bullish Harami is the classic version characterized by a visible real body on the second candle. It represents a modest shift in sentiment where selling pressure has been neutralized but not yet completely overwhelmed.
- Signal Strength: Moderate.
- Best Context: Found at the conclusion of short-term pullbacks in a broader uptrend or at minor support levels.
- The Signal: Buyers managed to push the close higher than the open (if green), showing regained strength. This version typically requires a third “confirmation” candle to prove buyers have truly seized control.
4.2. Bullish Harami Cross
The Bullish Harami Cross is a more potent and volatile variation where the second candle is a Doji. This indicates that the market opened and closed at almost the exact same price after a massive bearish move.
- Signal Strength: Moderate to Strong.
- Best Context: Appears at major market bottoms or during high-stress “capitulation” events.
- The Signal: A Doji signifies a “complete freeze” in price action. This dramatic halt suggests the downtrend hit a brick wall, making it a statistically more reliable reversal signal than the standard version.
4.3. High-Probability Harami (Context-Driven)
This is not defined by a different shape, but by its alignment with multiple technical factors. Professional traders often ignore “floating” Haramis and wait specifically for this “Grade A” setup.
- Signal Strength: Strong.
- Best Context: Forms exactly at a historical “Value Area,” major psychological support, or a long-term moving average.
- The Signal: Combining a volume climax on the mother candle with volume exhaustion on the baby candle creates a high-win-rate scenario where the bears have clearly run out of ammunition.
5. Bullish Harami vs. Similar Patterns: How to Avoid Confusion
Misidentifying a candlestick pattern can lead to premature entries or missing a stronger reversal entirely. The following table and breakdown serve as a decision framework to help you distinguish the Harami from its “cousins” on the chart.
Candlestick Reversal Decision Table
| Pattern | Key Visual Difference (The “Tell”) | Signal Strength | Best Use Case |
|---|---|---|---|
| Bullish Harami | Small candle inside previous red body | Moderate | Early warning of a pause/reversal |
| Harami Cross | Doji candle inside previous red body | Moderate-Strong | Stronger signal of trend exhaustion |
| Bullish Engulfing | Huge green body covers previous red body | Strong | Immediate reversal confirmation |
| Piercing Pattern | Green candle closes above 50% of red body | Strong | Aggressive buyer comeback |
| Morning Star | 3-candle setup (Red → Star → Strong Green) | Very Strong | High-confidence bottom reversal |
5.1. Bullish Harami vs. Bullish Engulfing Pattern
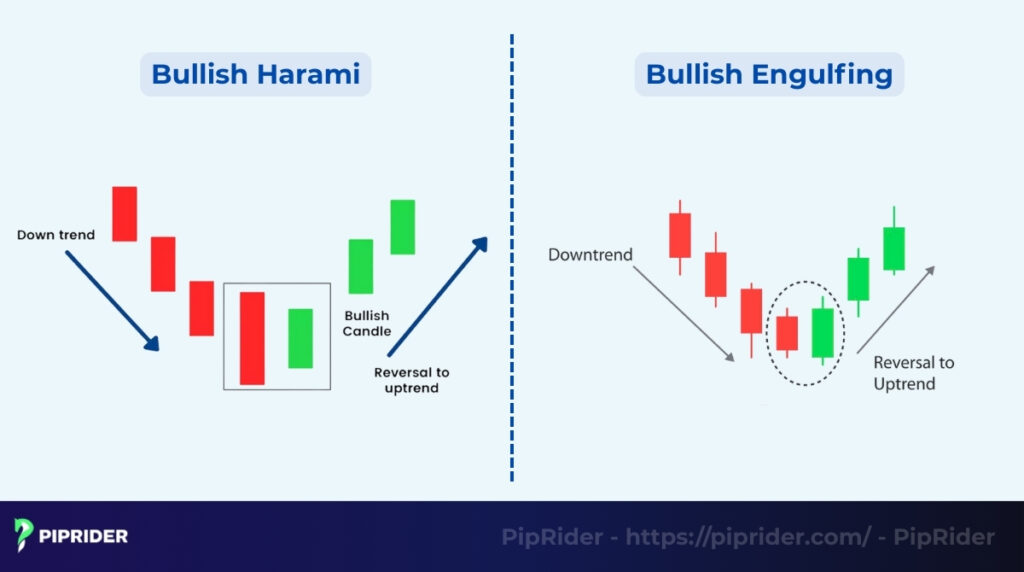
The primary difference lies in the aggressive nature of the buying pressure. In a Harami, the second candle is small and contained inside the first red candle, signaling a “pause” or stabilization in selling. In an Engulfing setup, the second candle is much larger and completely covers the first red candle, signaling that buyers have successfully overwhelmed the sellers. Consequently, the Engulfing pattern is considered a stronger and more immediate momentum signal.
5.2. Bullish Harami vs. Piercing Pattern
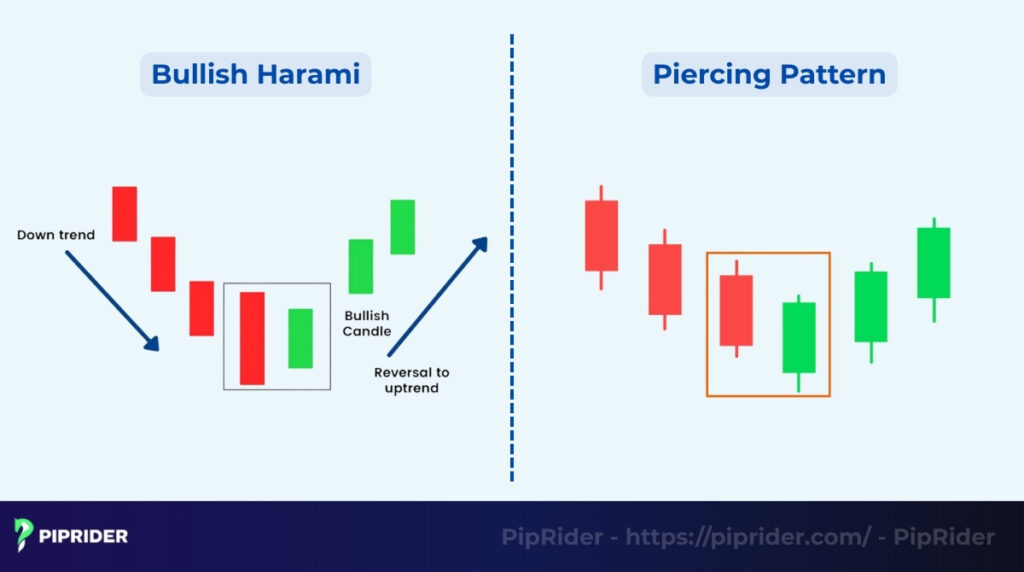
The distinction here is found in the opening and closing levels of the second candle. In a Harami, the price usually stays within the previous day’s range. In a Piercing candlestick pattern, the price actually gaps lower (at least initially) but then rallies strongly to close above the 50% midpoint of the first red candle. This “piercing” action indicates more aggressive bullish rejection of lower prices compared to the Harami’s passive absorption.
5.3. Bullish Harami vs. Inside Bar
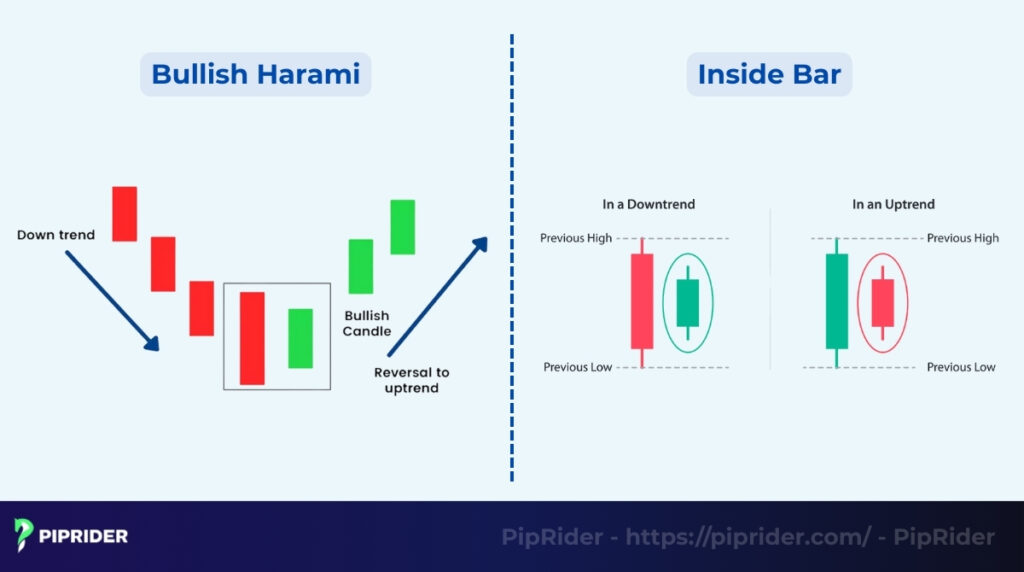
While every Bullish Harami is technically an Inside Bar, not every Inside Bar is a Bullish Harami. The term “Inside Bar” is a general market term used for any candle contained within the previous one, often appearing during an uptrend as a continuation signal. The Bullish Harami specifically requires a prior downtrend context; it is the location at the bottom of a bearish trend that defines the Harami as a reversal pattern rather than just a period of consolidation.
5.4. Bullish Harami vs. Morning Star
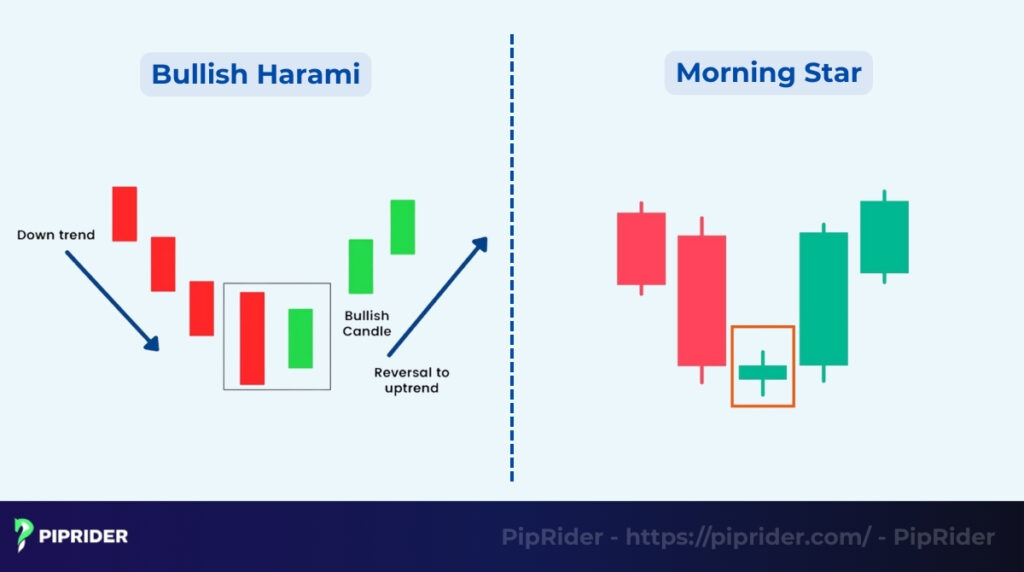
These two are often confused because they both signal a market bottom, but the Morning Star provides more built-in confirmation. The Harami is a 2-candle setup (Red → Small Green) indicating the selling has stopped. The Morning Star is a 3-candle setup (Red → Small Star → Strong Green), where the third candle serves as immediate proof that buyers have taken control. Statistically, the Morning Star is more reliable because of this third-candle confirmation.
6. How to Identify a High-Probability Bullish Harami
Not every Bullish Harami is worth trading. To maximize your success rate, you must move beyond simple “pattern spotting” and look for confluence. This section provides a detailed framework for filtering out weak signals and focusing only on setups where the market structure, volume, and momentum align for a reversal.
High-Probability Validation Checklist
Before placing a trade, ensure the setup meets these five critical criteria:
- Clear Downtrend: Is the market making distinct lower lows and lower highs? Avoid trading Haramis in “choppy” or sideways ranges.
- Support Confluence: Is the pattern forming at a major Support Zone, Demand Zone, or a key Moving Average?
- Volume Signature: Did the mother candle have high volume (climax) and the baby candle have lower volume (exhaustion)?
- Momentum Filter: Is the RSI oversold (<30) or showing a Bullish Divergence?
- Confirmation Ready: Is there a clear level (the high of the mother candle) where a breakout would confirm the shift?
6.1. The Importance of Downtrend Context
Context is the foundation of any reversal pattern. A Bullish Harami found in a choppy, sideways market is often just random price noise and carries a high risk of failure. To be valid, the pattern must follow a sustained bearish move where the “Mother” candle represents the final, desperate push by sellers. This context ensures that the subsequent “pause” represented by the baby candle actually signifies exhaustion rather than just a temporary breather in a ranging market.
6.2. Support Zone Confluence: “Location is Everything”
A Harami forming “in the middle of nowhere” (far from any historical support) is often a trap. Its reliability increases exponentially when it forms exactly at a key technical level, such as a prior swing low, a psychological round number, or a major moving average. When price hits a known demand zone and then forms a Harami, it proves that institutional buyers are actively defending that level, making the reversal much more likely to hold.
6.3. Volume Analysis: Identifying Exhaustion
Volume is the “fuel” of the market and provides the best confirmation of the Harami’s psychological shift.
- The Mother Candle: Should ideally see a spike in volume, representing a “Selling Climax” where late-comers panic sell into the hands of professionals.
- The Baby Candle: Should have noticeably lower volume. This “drying up” of volume indicates that there are no sellers left willing to push the price to new lows at these levels, setting the stage for a price bounce.
6.4. RSI Oversold and Bullish Divergence
Technical indicators act as a filter to measure the “internal health” of the trend. When a Bullish Harami forms while the RSI (Relative Strength Index) is below 30, it indicates the market is stretched too far to the downside. Even more powerful is a Bullish Divergence, where the price makes a new low on the Mother candle, but the RSI makes a higher low. This divergence is a clear signal that bearish momentum is hollow and a reversal is imminent.
6.5. The Breakout Confirmation
Even a perfect-looking Harami requires a trigger. The reversal is only “confirmed” once buyers prove they can push the price above the high of the Mother candle. Entering before this breakout occurs often called “anticipating the signal”, which is a common mistake that leads to losses if the market simply consolidates and continues its downtrend. Waiting for the high of the Mother candle to be taken out ensures that you are trading with the immediate momentum shift.
7. When the Bullish Harami Works Best (and When It Fails)
Successful trading is less about spotting a shape and more about identifying the environment where that shape has a statistical edge. To use the Bullish Harami effectively, you must apply a decision framework that separates high-probability reversals from low-quality market noise.
The Decision Framework
| Trade the Pattern When… | Avoid the Pattern When… |
|---|---|
| A clear, sustained downtrend exists (lower lows/highs) | The market is in a sideways, choppy, or ranging phase |
| The pattern forms at major historical support or demand | The pattern forms in the “middle of nowhere” (no support) |
| Selling volume peaks on the Mother and dries up on the Baby | Volume remains high or erratic on the second candle |
| RSI is oversold (<30) or shows a bullish divergence | RSI is in the middle of the range (neutral momentum) |
| A third candle breaks and closes above the Mother’s high | Price fails to break the high and continues lower |
8. How to Trade the Bullish Harami Pattern
Turning a candlestick observation into a profitable trade requires a disciplined execution plan. Depending on your risk tolerance and the current market momentum, you can choose between three primary entry strategies. Each is designed to balance the trade-off between “certainty” and “reward-to-risk ratio“.
8.1. Strategy 1: The Breakout Entry (Momentum-Based)
This strategy is best suited for traders who prefer to capture immediate momentum as buyers take control. It ensures you are in the trade as soon as the market confirms the shift in sentiment.
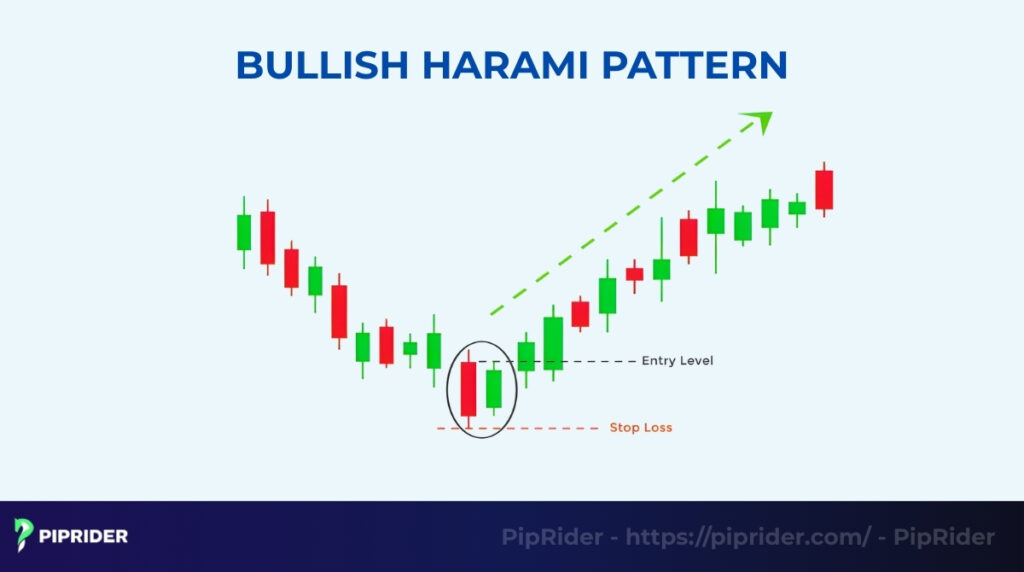
- The Logic: A break above the Mother candle’s high proves that the previous session’s selling pressure has been entirely negated.
- The Execution: Place a Buy Stop order 1–2 pips/ticks above the high of the large bearish Mother candle.
- Pros/Cons: You capture the move early, but you risk a “fakeout” if the breakout lacks sustained volume.
8.2. Strategy 2: The Confirmation Entry (Safety-First)
This is the most conservative approach, prioritizing high-confidence signals over entry price. It is ideal for beginners or those trading higher timeframes like the Daily or Weekly charts.
- The Logic: You wait for a third candle to close above the Mother candle’s high, confirming that the bulls have successfully defended the new support level.
- The Execution: Enter a Market Buy only after the candle following the Harami closes above the high of the Mother candle.
- Pros/Cons: Higher win rate due to triple confirmation, but you will often have a wider stop-loss and a lower reward-to-risk ratio.
8.3. Strategy 3: The Retest Entry (Risk-Averse)
This strategy focuses on achieving the best possible entry price by waiting for the market to “re-test” the strength of the breakout.
- The Logic: After a breakout, the price frequently pulls back to the “high” of the Harami structure (the Baby candle’s high or the Mother’s midpoint) before continuing higher.
- The Execution: Wait for the initial breakout, then place a Limit Order at the high of the Baby candle or the minor resistance level created by the pattern.
- Pros/Cons: Provides an exceptional reward-to-risk ratio and tighter stop-loss. However, you risk missing the trade entirely if the market rallies aggressively without looking back.
8.4. How to Manage Risk and Exit Your Trade
Managing the trade is just as important as the entry. A “static” exit rule often leaves money on the table or results in unnecessary losses during volatile reversals.
- Stop-Loss Placement (The Safety Net):
- Standard Placement: Place your Stop-Loss just below the absolute low of the Mother candle. If the price breaks this level, the reversal hypothesis is invalidated.
- Advanced Placement: If the Harami formed at a major support zone, place the SL slightly below the entire zone to avoid being taken out by “stop-hunting” wicks.
- Take-Profit and Scaling Rules:
- Initial Target (TP1): Set your first target at the most recent swing high or the nearest major resistance level.
- Extended Target (TP2): If momentum remains strong (e.g., rising volume on green candles), aim for the 1.272 Fibonacci extension of the Harami leg.
- The “Golden Rule” of RR: Always ensure the potential reward is at least twice your risk (1:2 Ratio). If the nearest resistance is too close to allow a 1:2 ratio, it is often better to skip the trade.
- Trailing Stops: Once the price reaches TP1, consider moving your Stop-Loss to “Breakeven” and trailing it behind new swing lows to capture a larger trend if the reversal turns into a sustained rally.
9. Which Indicators Best Strengthen the Bullish Harami Signal?
While price action is the primary driver of trading decisions, technical indicators serve as vital tools for building “confluence”. By combining the Bullish Harami with momentum and trend filters, traders can significantly reduce the risk of entering a trade based on a false reversal signal.
Indicator Confluence Table
| Indicator | What It Confirms | Best Use Case |
|---|---|---|
| RSI | Exhaustion or Momentum Divergence | Filtering reversals in extremely oversold conditions (<30) |
| MACD | Sentiment and Trend Shift | Confirming the direction of the trend after the Harami forms |
| EMA (50/200) | Institutional Dynamic Support | Identifying setups that align with long-term “Smart Money” levels |
| Volume | Real Buying Participation | Validating the strength of the breakout candle after the pattern |
- RSI Oversold or Divergence: The Relative Strength Index (RSI) is most effective when it signals that a downtrend has become overextended. A Bullish Harami that forms when the RSI is below 30 is statistically more reliable. However, the “gold standard” for confirmation is a Bullish Divergence. This occurs when the price makes a lower low (during the Mother candle), but the RSI makes a higher low. This mismatch proves that despite the price drop, the internal selling pressure has already dissipated.
- MACD Bullish Crossover: The MACD (Moving Average Convergence Divergence) helps traders verify that the “tide” of the market is actually turning. A bullish crossover where the MACD line crosses above the Signal line, occurring immediately after the Harami’s “Baby” candle provides a green light that momentum is now aligning with a potential upward move.
- EMA as Dynamic Support: Ideally, the Bullish Harami should form right on top of a key Moving Average, such as the 50-period EMA or 200-period EMA. These moving averages act as a “dynamic floor” rather than a static horizontal line.
- Institutional Alignment: Major institutions and algorithmic systems heavily monitor these levels. When a Harami forms on the 200 EMA, it suggests the long-term trend is being defended by “Smart Money”.
- Layer of Defense: The EMA adds an extra layer of protection against bears. Even if sellers attempt to push lower, the moving average provides a zone of liquidity that often halts the decline and springboards the reversal.
- Volume Analysis (The Institutional Footprint): Volume provides the necessary “fuel” for a reversal. While volume typically drops during the formation of the Baby candle (signaling indecision), a high-probability trade requires a visible Volume Spike on the breakout candle. This surge in activity confirms that institutional buyers are aggressively defending the support level and participating in the new uptrend.
10. Real Chart Examples: Seeing the Reversal in Action
Applying the Bullish Harami in live markets requires an understanding of how volatility and liquidity differ across assets. Below are three standardized case studies illustrating how the pattern manifests in Forex, Crypto, and Equities.
10.1. Case Study 1: Forex (EUR/USD H4 Chart)
- Context: The pair had been in a steady 5-day decline, dropping into a major historical support zone near 1.0500.
- Pattern: A large bearish Mother candle hit the support, followed by a small green Baby candle contained within the lower third of the Mother’s body.
- Confirmation: The third candle closed strongly above the high of the Mother candle, supported by an RSI bounce from the 25 level.
- Entry/SL/TP: Entry at the breakout of the Mother high; Stop-Loss below the support zone; Take-Profit at the next major H4 resistance level.
- Key Lesson: Harami patterns in Forex are most reliable on higher timeframes (H4/Daily) when aligned with “big figure” support levels.
10.2.Case Study 2: Crypto (Bitcoin Daily Chart)
- Context: Bitcoin experienced a sharp 15% weekly “capitulation” sell-off, pushing price into extreme fear territory.
- Pattern: A massive red candle (the climax) was followed by a tiny Harami Cross (Doji), signaling a total freeze in selling pressure.
- Confirmation: A high-volume bullish candle followed the Doji, breaking the immediate local resistance.
- Entry/SL/TP: Entry after the confirmation candle close; Stop-Loss below the Doji low; Take-Profit at the 1.272 Fibonacci extension.
- Key Lesson: In Crypto, the Harami Cross often marks the “bottom” of a panic dump because it represents a complete exhaustion of sellers.
10.3. Case Study 3: Stocks (Apple – AAPL Daily Chart)
- Context: AAPL was in a primary bull market but pulled back to test its rising 50-day Exponential Moving Average (EMA).
- Pattern: A red day was followed by a “Gap Up” open that remained within the previous day’s range, forming a classic Standard Bullish Harami.
- Confirmation: Volume on the Baby candle was significantly lower than the Mother candle, showing a “drying up” of supply.
- Entry/SL/TP: Buy Stop above the Mother high; Stop-Loss below the 50-day EMA; Take-Profit at the previous all-time high.
- Key Lesson: Stock market gaps add a “surprise factor” to the Harami that isn’t always present in 24/7 markets like Forex.
11. What Are Common Mistakes Traders Make?
The simplicity of the Bullish Harami often leads traders into traps. To maintain a high win rate, you must avoid these five critical errors that frequently turn a valid technical signal into a losing trade.
- Trading in Consolidation: The Bullish Harami is a reversal pattern. If the market is already moving sideways in a choppy range, the pattern has no trend to reverse. Trading Haramis in a range is essentially gambling on market noise.
- Ignoring Trend Context: Never trade the “shape” in isolation. If the overall market structure is still making aggressive lower lows without hitting a significant support level, a single Harami is unlikely to stop the momentum of a major crash.
- Forcing the Pattern Without Support Confluence: A Harami forming in the “middle of nowhere” (far from any historical demand or moving average) is highly prone to failure. The strongest setups always occur where buyers have a historical reason to step in.
- Mistaking an Inside Bar for a Harami: Every Harami is an Inside Bar, but not every Inside Bar is a reversal. An Inside Bar that forms during a strong uptrend is usually a continuation signal. Confusing these leads to “fighting the trend” by trying to short an uptrend or buy a mid-trend pause.
- Entering Without Confirmation: Jumping into a trade the moment the Baby candle closes is a high-risk move. Without waiting for a breakout above the Mother high or a volume spike, you are vulnerable to a “dead cat bounce” where the market pauses briefly before resuming its downtrend.
12. Which Scanners and Tools Can Automatically Detect the Pattern?
Manually searching for a Bullish Harami across hundreds of charts is inefficient and prone to human error. By integrating automated scanners into your trading workflow, you can instantly identify high-probability setups and focus your energy on analysis and execution rather than hunting for patterns.
The Automated Trading Workflow
To optimize your search, consider a tiered approach based on your specific market and trading style:
- Step 1: Manual Analysis & Visual Alerts (TradingView): For most traders, TradingView is the primary starting point. You can use the built-in “All Candlestick Patterns” indicator. By enabling “Bullish Harami” in the settings, the platform will automatically label the pattern (BH) on your chart. You can also set a “technical alert” to notify your phone the moment a valid pattern completes.
- Step 2: Forex & MetaTrader Optimization (MT4/MT5): If you are a specialized Forex trader, custom plugins like “Pattern Graphix” or “ZUP” are more effective. These tools run in the background of your MetaTrader terminal and can be configured to scan multiple currency pairs on higher timeframes (H4/Daily) simultaneously.
- Step 3: Large-Scale Stock Screening (FinViz): If you trade the US equity markets, FinViz offers a powerful free screener. Under the “Screener” tab, you can select “Harami” from the Signal dropdown. This instantly filters thousands of stocks, allowing you to quickly find those forming the pattern at key horizontal support levels.
- Step 4: Advanced Algorithmic Filtering (TrendSpider & LuxAlgo): For professional-grade filtering, TrendSpider allows you to build multi-condition queries (e.g., “Candlestick Pattern = Bullish Harami” AND “RSI < 30”). Similarly, the LuxAlgo premium script assigns a “Confidence Score” to patterns based on historical performance, helping you prioritize the strongest setups.
13. Frequently asked questions about Bullish Harami Pattern
This section addresses the most common technical and strategic questions traders ask when incorporating the Bullish Harami into their market analysis.
14. Conclusion
The Bullish Harami pattern is a sophisticated tool for identifying market bottoms, yet its simplicity on the candlestick chart can be deceptive for the untrained eye. A truly valid reversal requires more than just two candles; it demands the “Perfect Storm” of structural support, volume validation, and momentum exhaustion.
By prioritizing quality over quantity—waiting for clear confirmation instead of rushing to anticipate the move—you transform a common pattern into a professional-grade trading edge. Success in trading comes from the discipline to ignore the “noise” and trade only the setups where the confluence of indicators and price action is undeniable.
Ready to master the markets? Stop guessing and start trading with precision. Follow Piprider today for professional insights and advanced trading strategies to grow your portfolio.


