
In forex trading, navigating market volatility requires a mathematical framework, not subjective guesswork. Bollinger Bands are a premier technical indicator designed to measure standard deviation and identify absolute price extremes.
Professional traders use this tool to visually map volatility boundaries—transforming chaotic price swings into structured, tradable zones. Whether you are trading a low-liquidity squeeze or riding a massive macroeconomic trend, Bollinger Bands provide a definitive execution edge.
This guide deconstructs the exact mechanics of Bollinger Bands, delivering institutional-grade strategies for mean reversion, trend following, and intraday execution.
Key Takeaways
- The Core Mechanics: Built on a 20-period Simple Moving Average (SMA) and two outer bands set at two standard deviations, the indicator dynamically expands and contracts to map real-time volatility.
- Dual Market Regimes: Bollinger Bands dictate two distinct strategies: Mean Reversion (trading the band extremes in a sideways market) and Trend Following (riding band expansion during breakouts).
- The Bollinger Squeeze: A severe visual contraction of the bands signals historically low volatility, mathematically preceding an explosive institutional breakout.
- Dynamic Risk Management: The outer bands and the middle 20 SMA serve as dynamic, moving boundaries for precise stop-loss and take-profit placement.
- The Confluence Rule: To eliminate algorithmic fakeouts, Bollinger Bands must never be traded in isolation; they require secondary confirmation from momentum oscillators (like RSI or MACD) and structural price action.
1. What are Bollinger Bands?
In forex trading, Bollinger Bands serve as a key indicator for tracking price trends and measuring volatility. Created by John Bollinger in the 1980s, they’ve become a go-to for spotting potential trade setups.
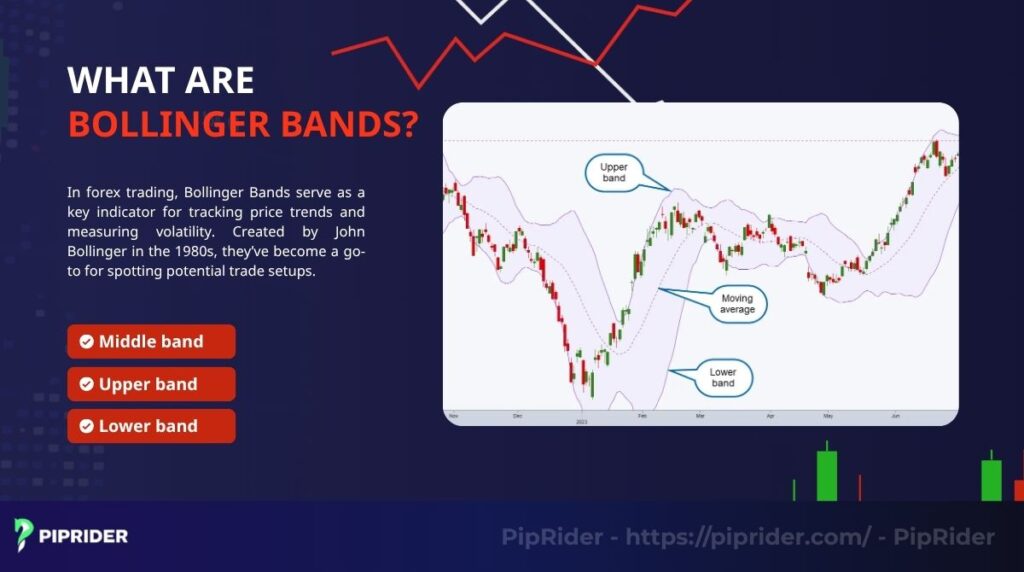
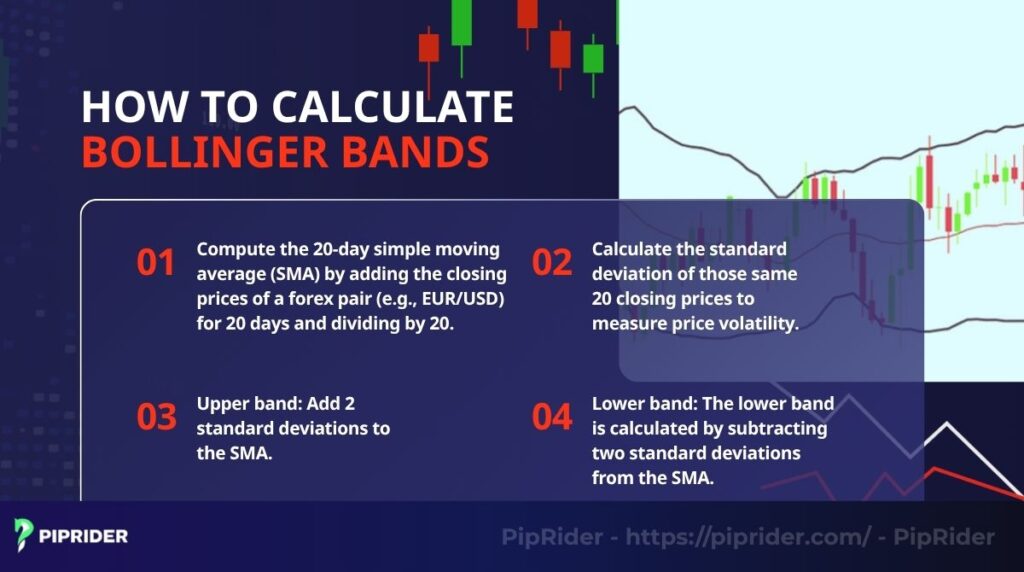
The structure of Bollinger Bands includes three lines:
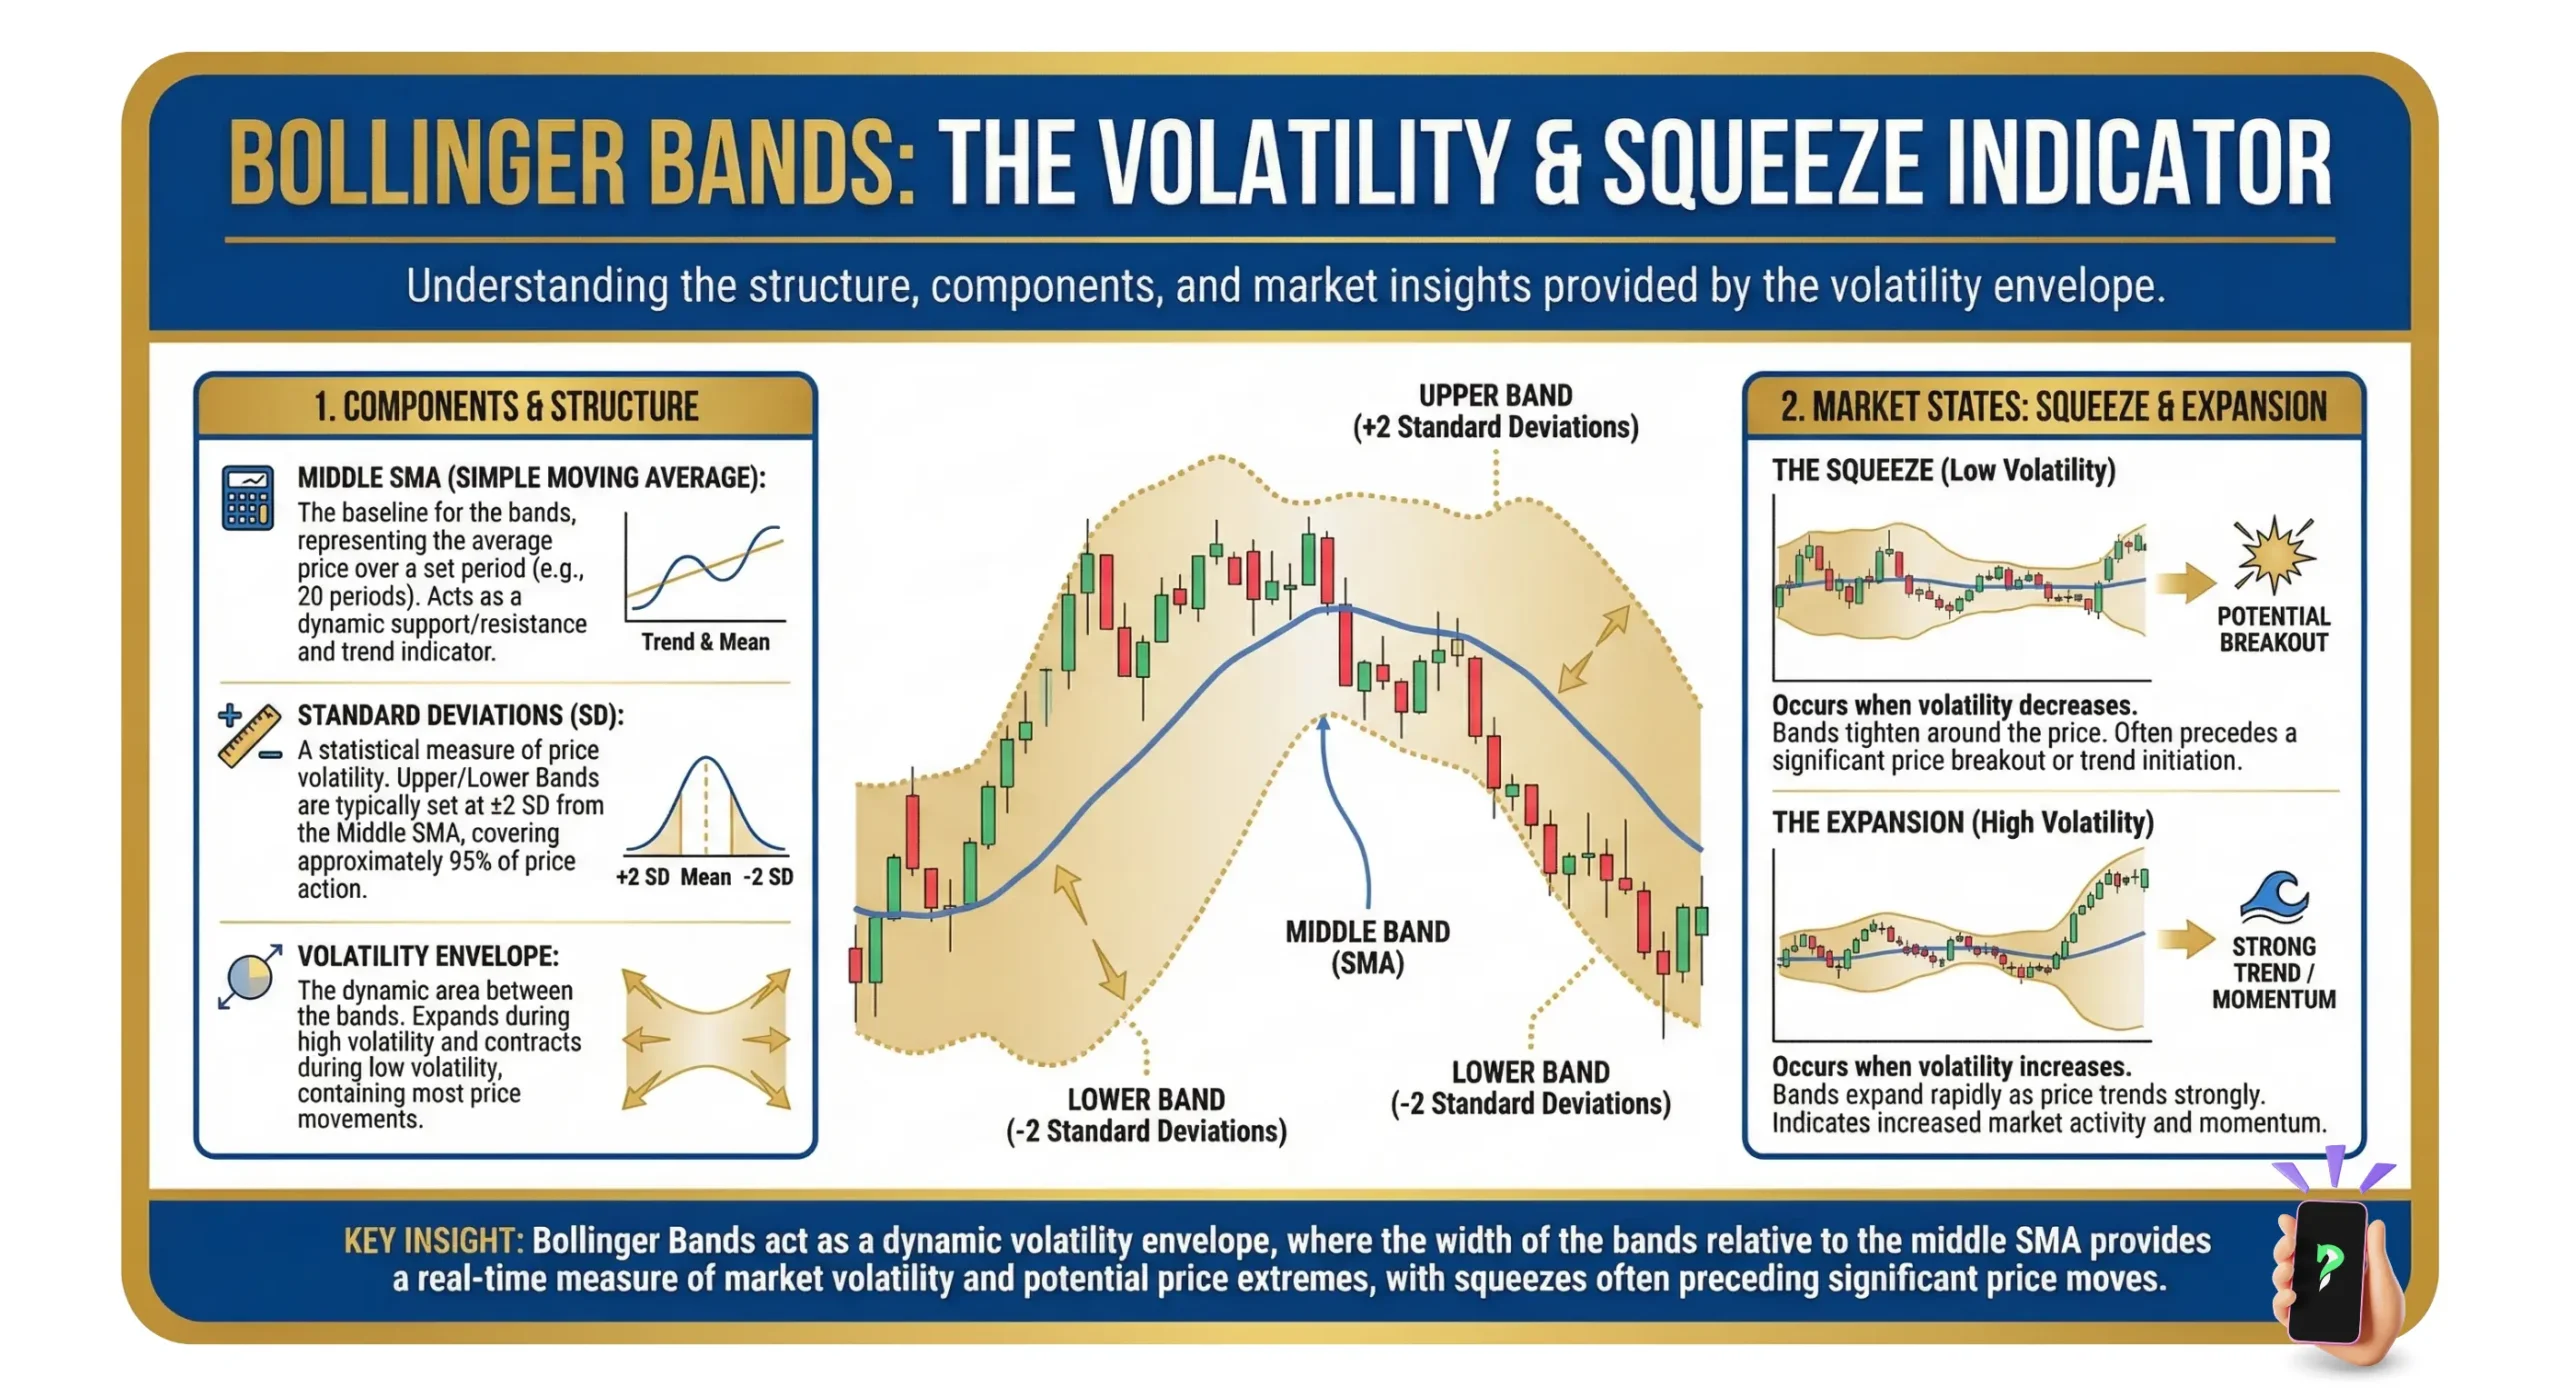
- Middle band (Simple Moving Average – SMA): A 20-period simple moving average that smooths out recent price data.
- Upper band: Plotted two standard deviations above the 20-day SMA. This band reflects the upper limit of normal price fluctuations in a volatile market.
- Lower band: Plotted two standard deviations below the 20-day SMA. It marks the lower boundary of expected price movement.
These bands adjust to market conditions. When prices swing wildly, the bands widen to reflect high volatility. When the market is quiet, the bands contract, indicating reduced volatility. This dynamic expansion is ideal for the Forex market. It accurately tracks rapid liquidity shifts in a global market now trading over 9.6 trillion daily (Bank for International Settlements, 2025).
Bollinger Bands help traders see if prices are high or low compared to recent trends. They’re not a standalone tool but shine when paired with other indicators. Think of them as a volatility map, helping you identify relatively high or low price zones based on recent price action.
2. The 2 Ways to Use Bollinger Bands: Mean Reversion vs. Trend Mode
The single biggest mistake amateur traders make is treating Bollinger Bands the same way in every market condition. To trade profitably, you must understand that this indicator operates in two entirely different “modes” depending on current market volatility.
If you apply the wrong strategy to the wrong mode, you will get trapped. Here is the definitive framework for classifying and trading these two environments:
2.1. Mean Reversion Mode (The Sideways Market)
When the market is consolidating, the upper and lower bands run almost parallel to each other horizontally. In this environment, price action acts like a rubber band—whenever it stretches too far from the average, it snaps back.
- Market Condition: Sideways price action, low-to-medium volatility, and a flat middle 20 SMA.
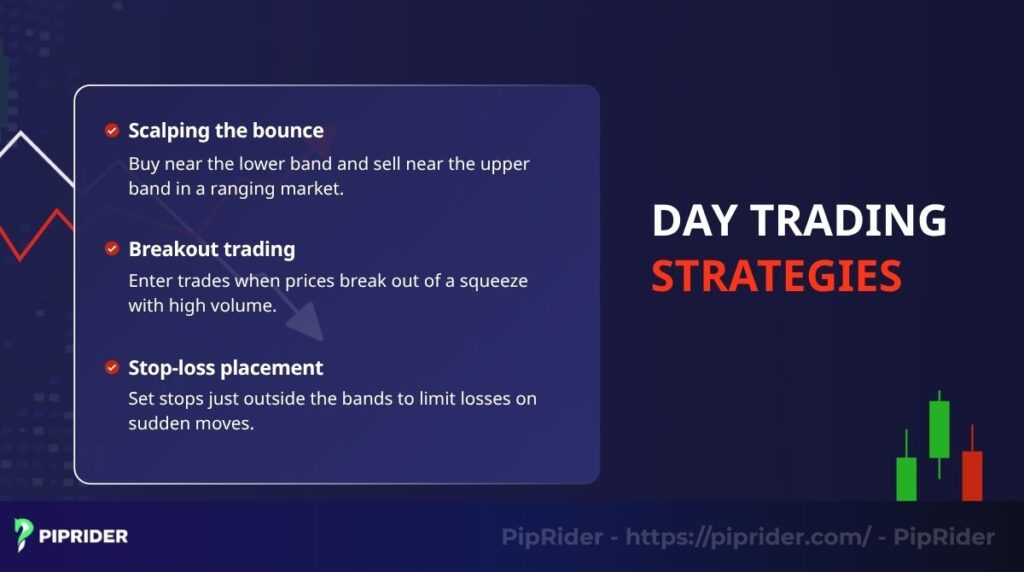
- The Strategy: Buy the lower band, sell the upper band.
- How to Execute: When the price tags the lower band and forms a bullish reversal candlestick (such as a pin bar or bullish engulfing), enter a long position. Your initial take-profit target is the middle 20 SMA, with a final target at the upper band.
- The Golden Rule: Only execute mean reversion strategies when the outer bands are flat and contracted.
2.2. Trend Mode (The Expansion Market)
When strong momentum enters the market, the bands will violently expand away from each other. This is the exact moment you must completely abandon the mean reversion mindset. In this mode, touching the upper band is not a “sell” signal; it is a sign of extreme structural strength.
- Market Condition: High volatility, rapidly expanding bands, and a steeply angled 20 SMA.
- The Strategy: Follow the trend and trade the “band hug.”
- How to Execute: If the price breaks out and starts “hugging” or “walking” up the upper band, the market is in a powerful uptrend. Do not attempt to short the market. Instead, look for buying opportunities on minor pullbacks to the middle 20 SMA, and ride the momentum upward.
- The Golden Rule: Never fade (trade against) an expanding band. A price hugging the outer band confirms institutional momentum, not market exhaustion.
2.3. Step-by-Step Guide to Configuring Bollinger Bands
To deploy Bollinger Bands effectively, you must configure them correctly and establish a structural bias before taking any trading signals.
Step 1: Apply Standard Parameters
Load the indicator on your platform (MT4, MT5, or TradingView). Ensure the baseline is set to a 20-period Simple Moving Average (SMA) with the outer bands set to 2 Standard Deviations (SD). This is the optimal mathematical baseline for most currency pairs.
Step 2: Identify the Market Regime
Before looking at individual candlesticks, analyze the macro structure. Look at the slope of the 20 SMA and the width of the bands. Determine if the market is in a Consolidation Phase (flat SMA, parallel bands) or an Expansion Phase (angled SMA, widening bands).
Step 3: Execute Contextual Signals
Align your entry strategy with the market regime. In a ranging market, trade the extremes (buy the lower band, sell the upper). In a trending market, buy pullbacks to the middle 20 SMA and use the outer bands to trail your stop-loss.
2.4. Core Signals and Execution Triggers
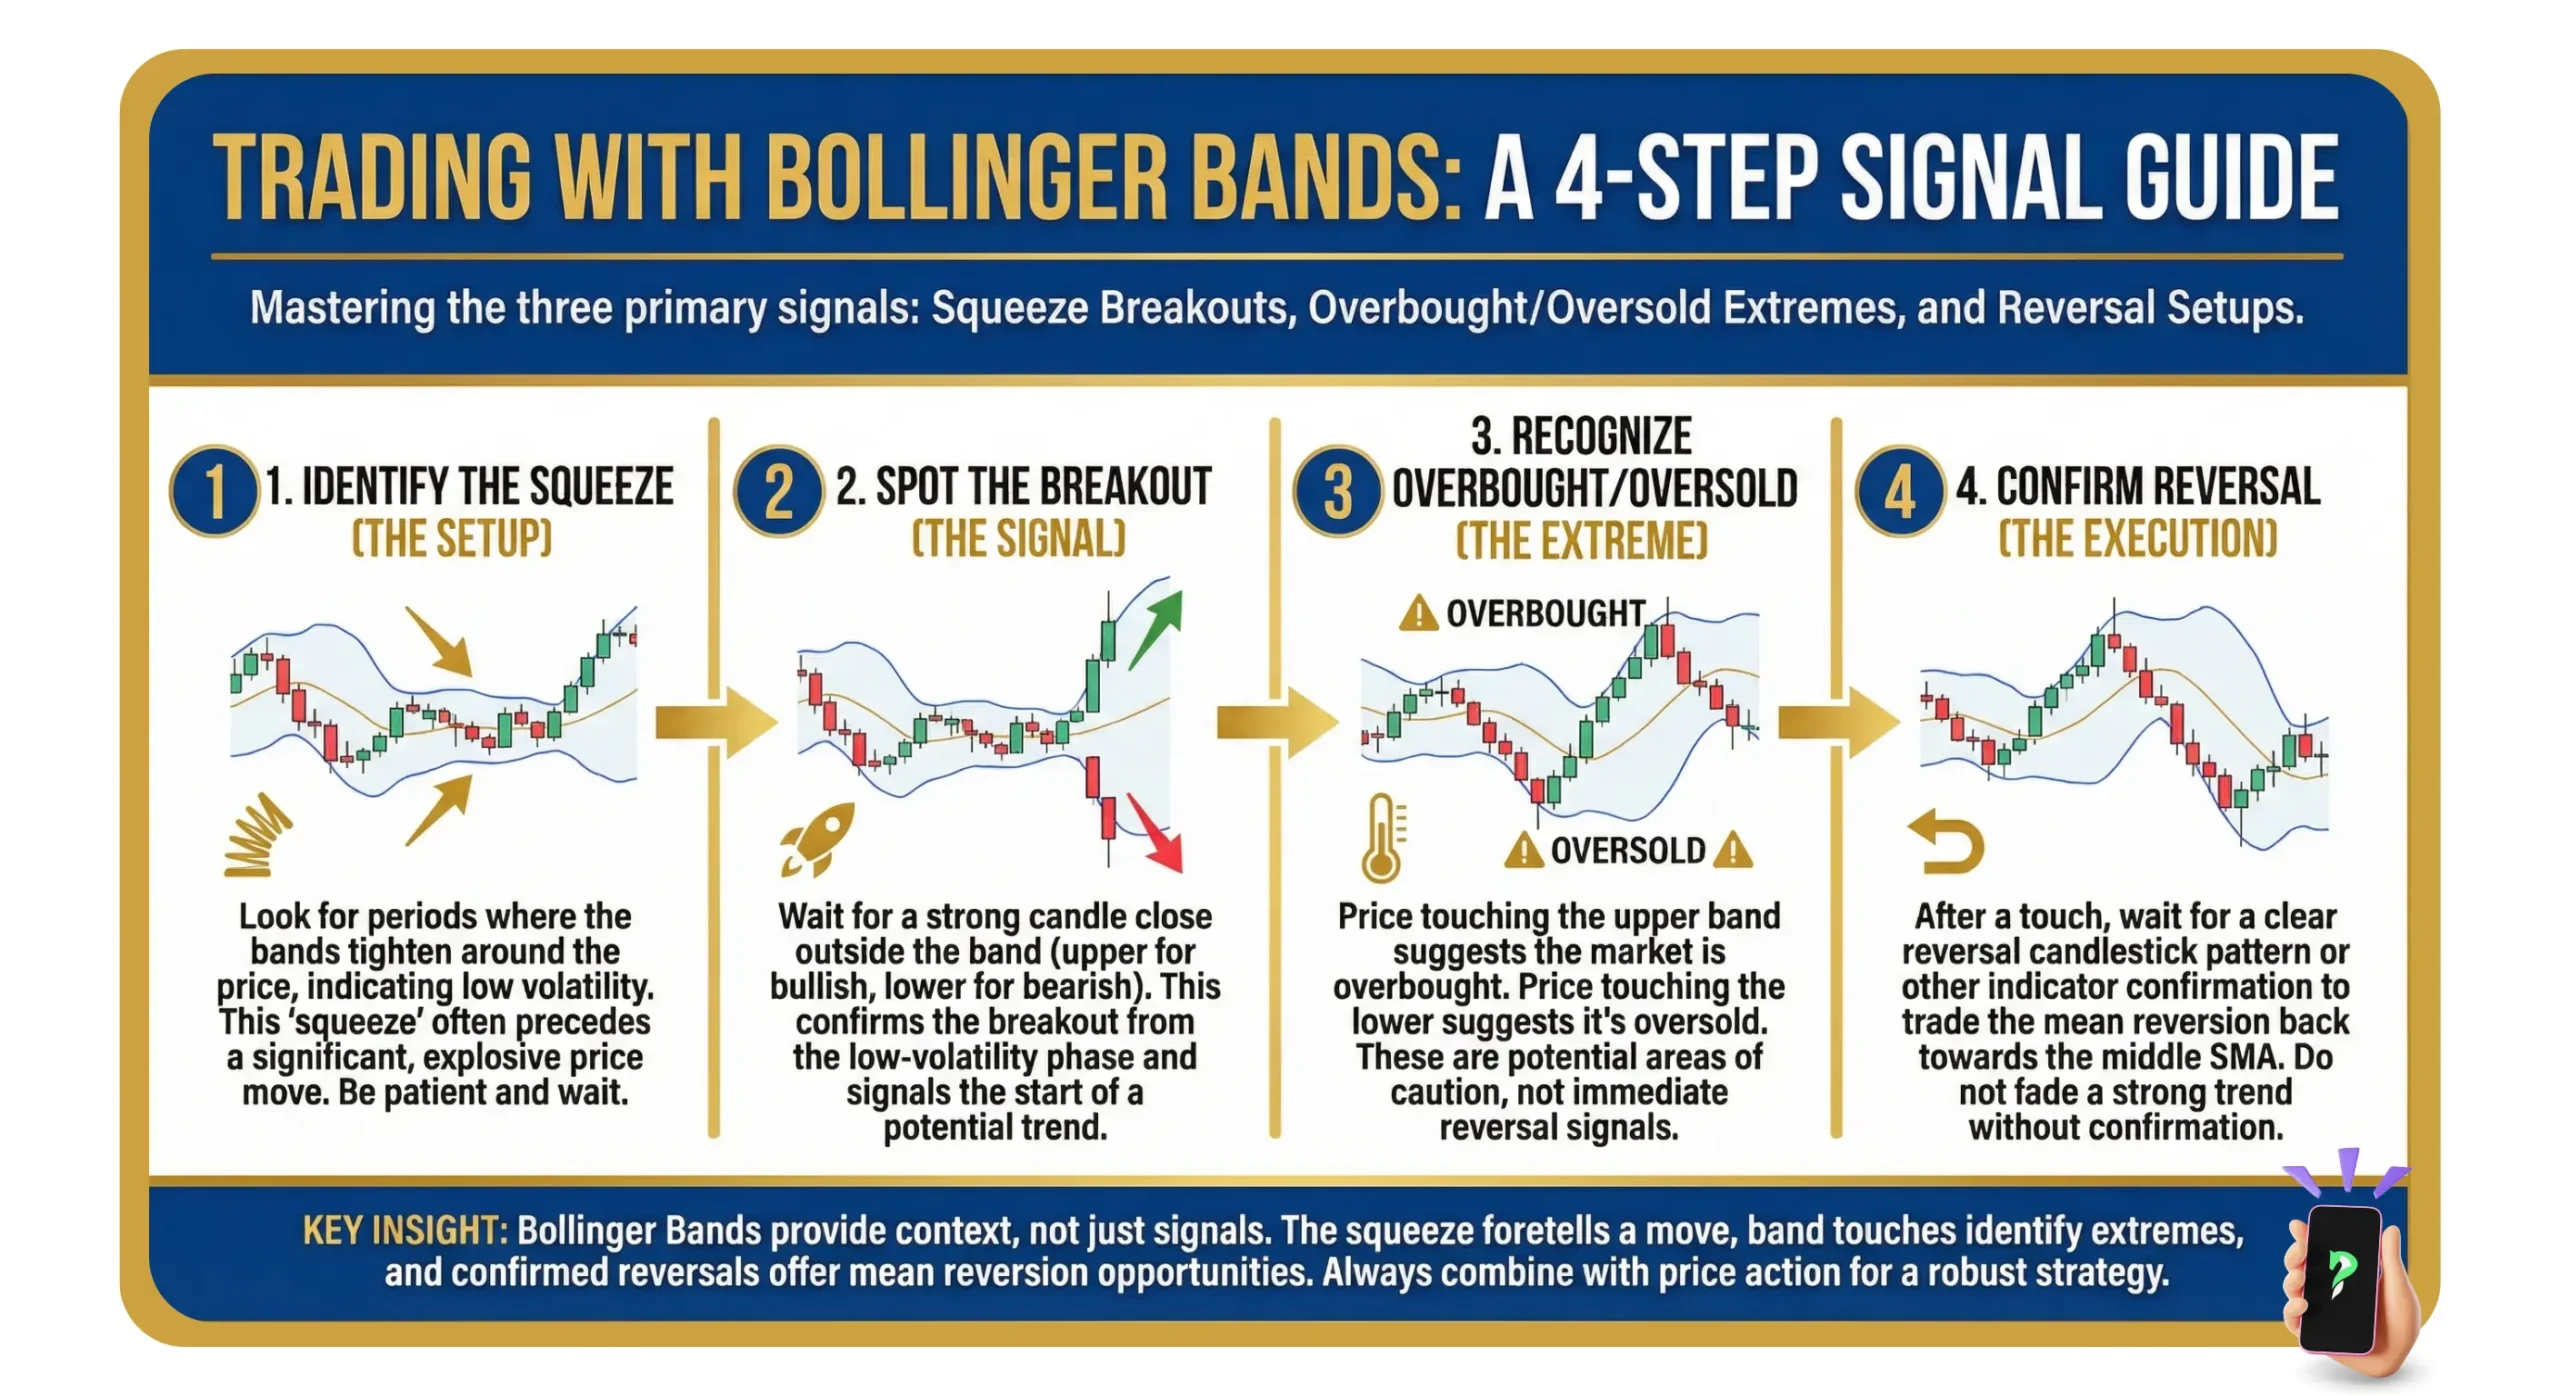
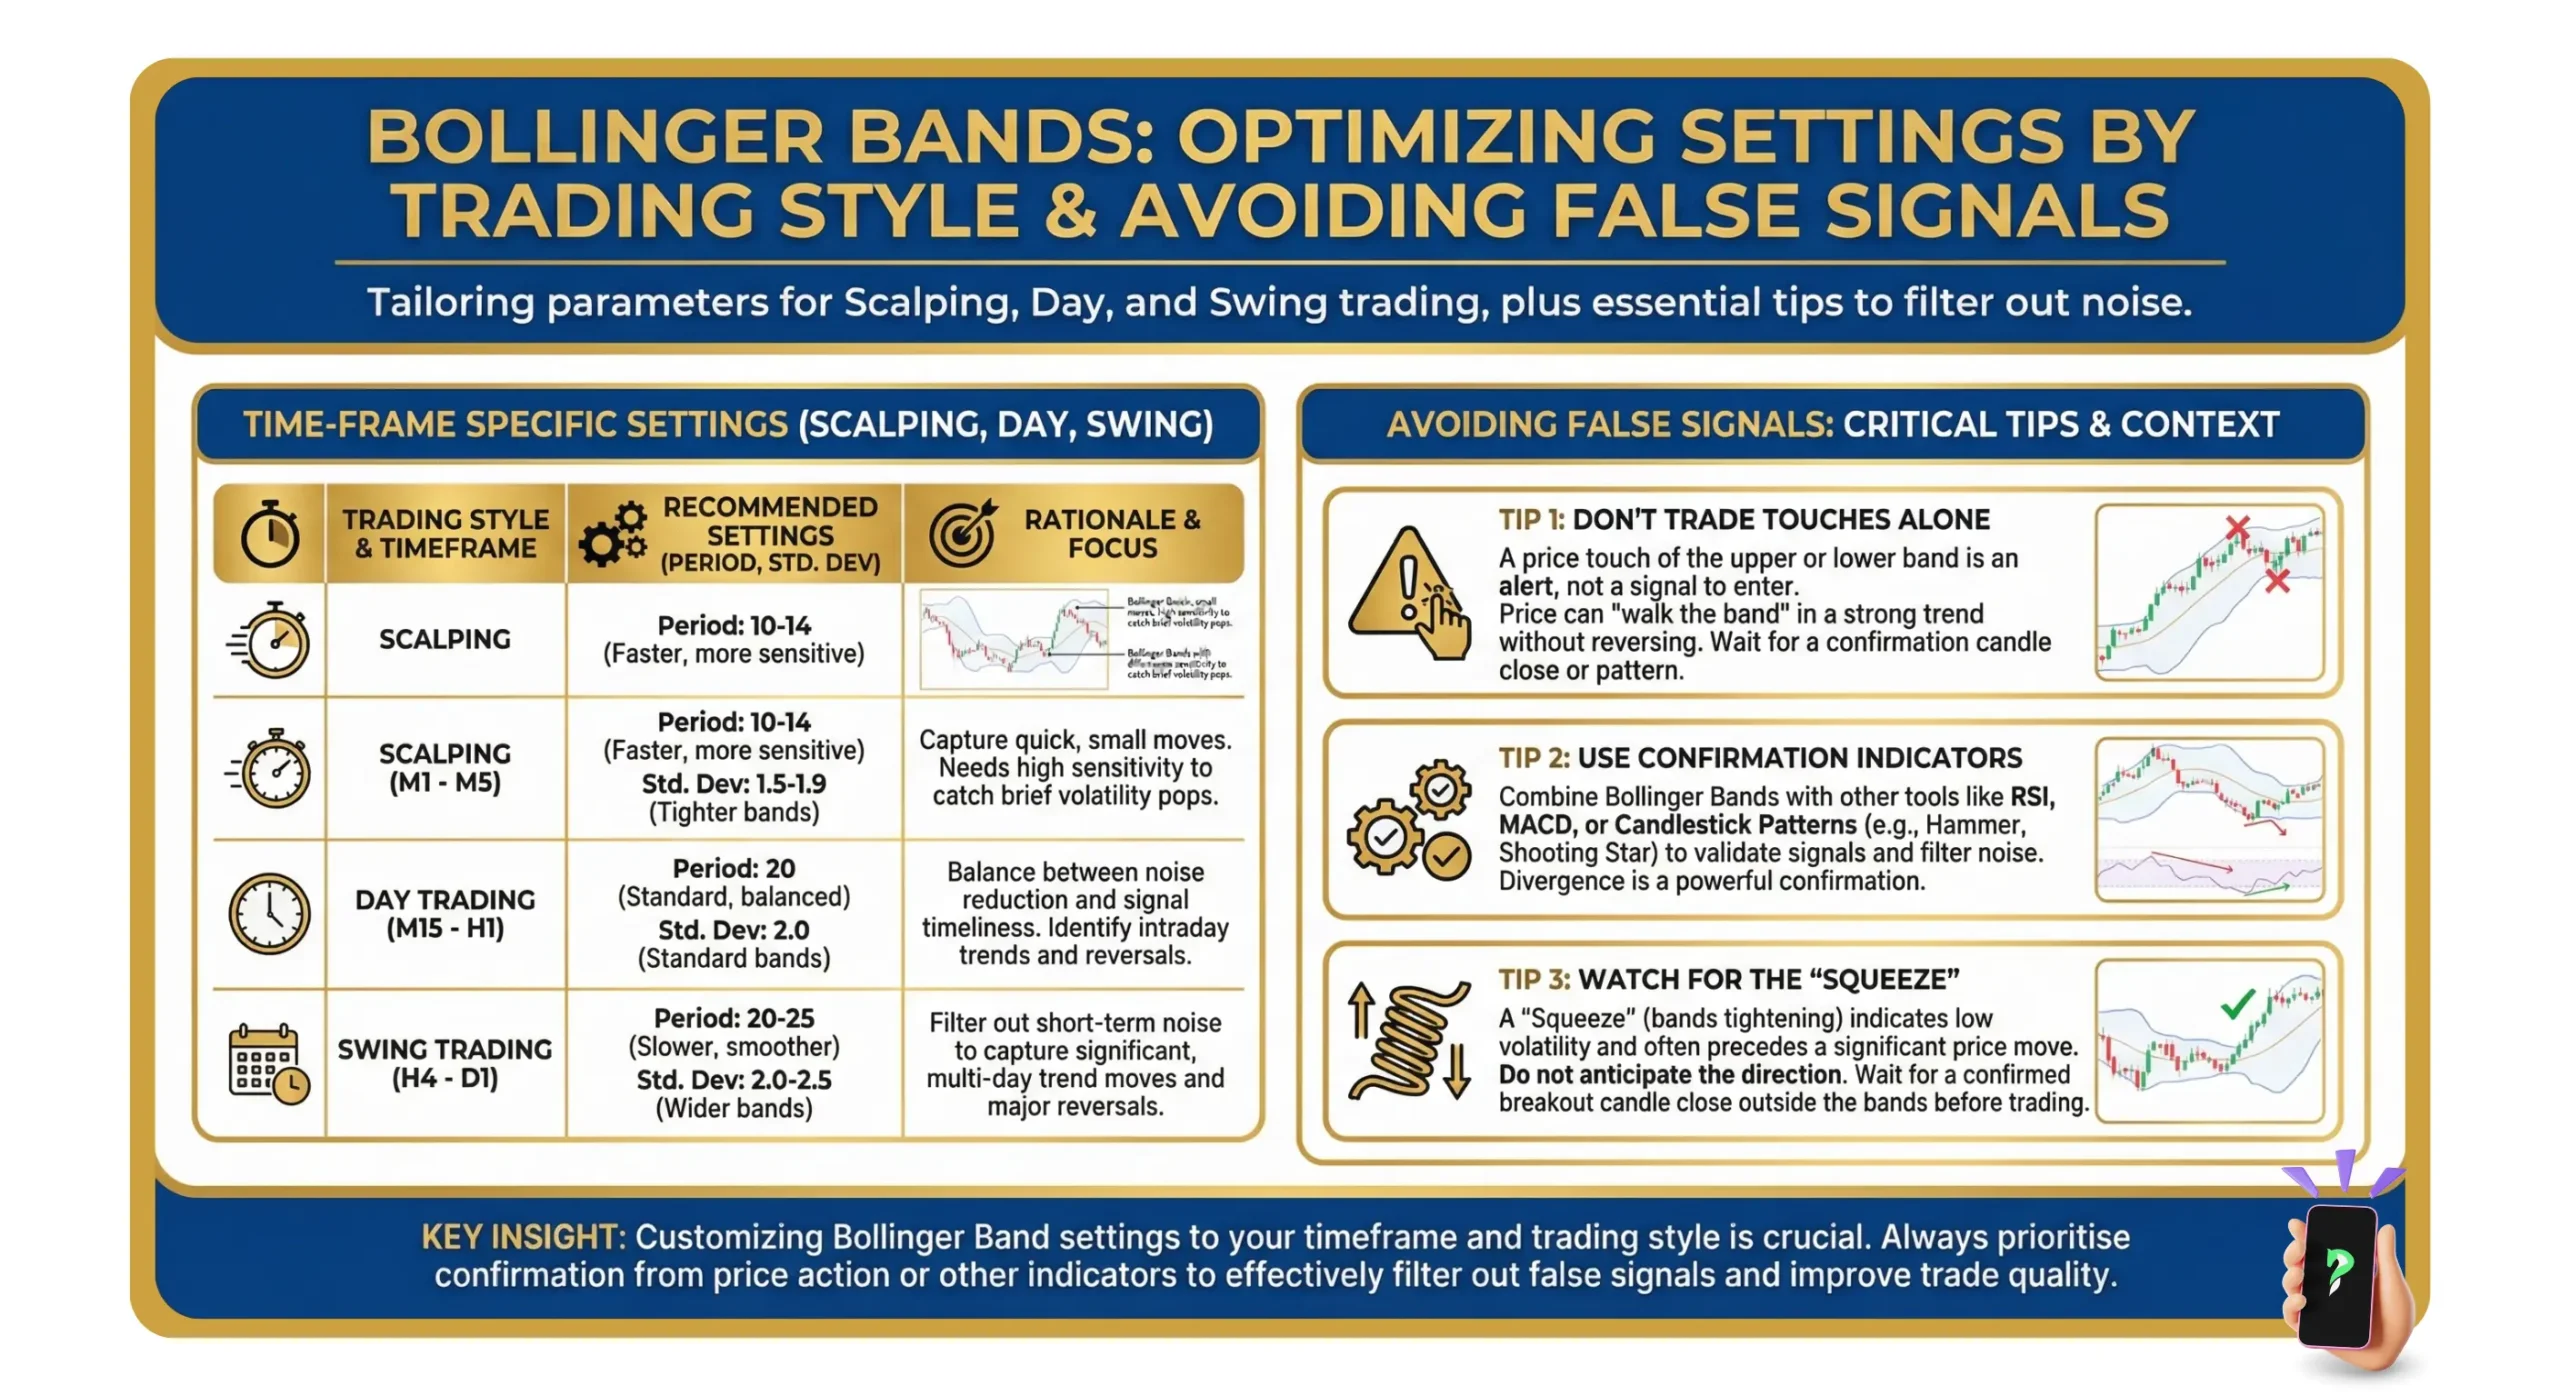
The most dangerous myth in retail trading is that an upper band touch is an automatic sell signal, and a lower band touch is an automatic buy signal. In reality, a band touch simply indicates a standard deviation extreme. Your reaction must be dictated entirely by the current market condition.
Use this execution matrix to avoid the most common beginner trap and trade with structural context:
| Price Behavior | Market Condition | Professional Action |
|---|---|---|
| Touching Upper Band | Strong Uptrend | Hold / Follow Trend: The trend is accelerating. Do not sell. Trail your stop-loss. |
| Touching Upper Band | Range Market | Look for Sell: Wait for a bearish reversal pattern to enter short. Target the middle SMA. |
| Touching Lower Band | Strong Downtrend | Hold / Follow Trend: The downtrend is robust. Do not buy. Maintain short positions. |
| Touching Lower Band | Range Market | Look for Buy: Wait for a bullish reversal pattern to enter long. Target the middle SMA. |
Beginner’s Shortcut: The Survival Rule
If you are new to trading, restrict your Bollinger Bands usage exclusively to ranging (sideways) markets. Focus entirely on buying the lower band and selling the upper band when the middle 20 SMA is flat. Strictly avoid trending markets. If the outer bands are rapidly expanding, stay flat (no open positions). Attempting to trade mean reversion during a strong structural trend is the fastest way to liquidate your account.
3. Bollinger Bands Squeeze Strategy
Volatility in the forex market is inherently cyclical; periods of extreme quiet are inevitably followed by explosive price movements. The Bollinger Squeeze (Bollinger, 2001) capitalizes on this mathematical certainty. Rather than just a passing observation, it should be treated as a complete, high-probability trading strategy designed to catch major trend shifts at their exact inception.
Here is the professional 3-step framework to trade the Bollinger Squeeze:
3.1. The Setup: Volatility Contraction
Before any major structural move, the market must build up kinetic energy.
- What to look for: The upper and lower bands narrow significantly, squeezing the price into a tight, horizontal range.
- Market Condition: Extremely low volatility. The market is in a strict consolidation phase, signaling that institutional players are quietly accumulating or distributing positions.
- The Rule: Patience is critical. The longer and tighter the bands remain squeezed, the more aggressive the eventual price expansion will be.
3.2. The Trigger: The Structural Breakout
A squeeze indicates that a massive move is imminent, but it does not dictate the direction. You must let the market reveal its hand.
- What to look for: A definitive candlestick expansion where the body closes completely outside the upper or lower Bollinger Band.
- The Action: If the price firmly closes above the upper band, it triggers a long (buy) bias. If it closes below the lower band, it triggers a short (sell) bias.
- The Warning: Do not anticipate the break. A wick piercing the band is not a trigger; it is merely a liquidity sweep. You must demand a solid candlestick body closure.
3.3. The Confirmation: Volume & Momentum Validation
The most common trap retail traders face when trading the squeeze is the “fakeout” (a false breakout). To protect your capital, the trigger must be strictly validated by secondary data.
- Volume Confirmation: The breakout candle must be accompanied by a massive spike in tick volume. This proves that real market participation is driving the move, rather than just low-liquidity retail noise.
- Momentum Confirmation: Align the breakout with a momentum oscillator like the MACD. For a valid bullish squeeze, the MACD histogram should show accelerating positive momentum simultaneously with the price breakout.
- The Action: Only execute the trade when all three elements—Setup, Trigger, and Confirmation—perfectly align.
4. Real-World Chart Examples: Applying Bollinger Bands
Theoretical frameworks are only valuable when strictly applied to actual price action. To understand how to dynamically switch between Mean Reversion and Trend modes, let’s examine how professional traders interpret Bollinger Bands in two entirely different market environments.
4.1. The Range Market Example (Mean Reversion)
In a low-volatility environment, major currency pairs often enter extended periods of consolidation. When the 20 SMA is completely flat, this structure provides highly predictable, low-risk mean reversion setups.
- The Setup: Imagine looking at a EUR/USD 1-Hour chart during the mid-Asian session. The 20 SMA is entirely horizontal, and the outer bands are moving parallel to each other, creating a strict volatility channel.
- The Execution: The price drops sharply, piercing the lower band. Immediately, a bullish pin bar (or hammer candlestick) forms, rejecting the lower boundary. This wick indicates that institutional buy limits are defending the liquidity zone. You execute a long position at the close of this candle.
- The Outcome: The price violently snaps back inside the bands, reverting to the mathematical mean. You take partial profits at the middle 20 SMA and close the remainder of the position as the price tags the upper band.
4.2. The Trending Market Example (The Band Walk)
When macroeconomic catalysts inject massive volume into the market, highly volatile pairs will aggressively break out and sustain long-term directional moves. Attempting to fade (trade against) these moves is a critical error.
- The Setup: Consider a GBP/JPY Daily chart following a major central bank interest rate decision. The Bollinger Bands, which were previously squeezed, expand violently away from each other. The 20 SMA angles steeply upward.
- The Execution: The price breaks and closes firmly above the upper band with strong momentum. Instead of selling this “overbought” signal, you recognize the structural shift. You enter a long position to follow the institutional order flow, using the middle 20 SMA as your dynamic support level.
- The Outcome: The price “walks” up the upper band for several consecutive weeks, barely pulling back. You trail your stop-loss progressively higher beneath the 20 SMA, capturing a massive macro trend. You only exit the trade when the price finally closes below the 20 SMA and the lower band begins to curl upward, signaling momentum exhaustion.
5. Timeframe Calibration: Matching Bands to Your Strategy
Volatility is fractal, meaning the mathematical principles of Bollinger Bands apply to any chart. However, the reliability of the signals is heavily dependent on the timeframe you select. Lower timeframes are dominated by algorithmic noise, while higher timeframes reflect true macroeconomic order flow.
To maximize your win rate, you must align your chosen timeframe with your specific trading style:
5.1. M5 (5-Minute) – Scalping & Micro-Momentum
The 5-minute chart is a high-speed battleground of algorithmic noise and rapid liquidity sweeps, requiring strict risk parameters and immediate execution.
- The Environment: The M5 chart is hyper-reactive and heavily distorted by algorithmic high-frequency trading (HFT) and sudden fundamental spikes.
- The Application: Used strictly by scalpers to capture rapid, fleeting momentum bursts or micro-mean reversions.
- Professional Tip: The default 20 SMA is often too lagging here. Recalibrate your settings to a 10-period SMA with a 1.5 Standard Deviation to stay tightly synced with intraday micro-fluctuations.
5.2. H1 (1-Hour) – Intraday Session Trading
Operating as the sweet spot for day traders, the 1-hour chart filters out micro-whipsaws while clearly defining the dominant momentum of the major trading sessions.
- The Environment: The H1 chart offers the optimal balance between signal frequency and structural reliability. It effectively smooths out the chaotic “noise” of the minute charts while still providing multiple actionable setups per week.
- The Application: The premier timeframe for intraday execution. It is exceptionally accurate for trading the Bollinger Squeeze or riding trend expansions during the high-volume London and New York session overlaps.
5.3. Daily (D1) – Swing Trading & Macro Structure
The Daily timeframe eliminates intraday manipulation, offering the highest mathematical probability by revealing the true, underlying footprints of institutional order flow.
- The Environment: The Daily chart is the gold standard for technical analysis. It completely neutralizes intraday algorithmic whipsaws and displays genuine macroeconomic momentum.
- The Application: Designed for swing traders and position traders. Signals on the D1 chart carry immense structural weight. A Bollinger Squeeze breakout on the Daily timeframe rarely results in a fakeout and will often dictate the macro trend for the next several weeks or months.
6. Bollinger Bands for Day Trading & Scalping
Day trading requires a hyper-responsive analytical framework. While the default Bollinger Bands settings are optimal for swing trading and macro-trend analysis, the intraday forex market moves with micro-fluctuations that demand precise recalibration.
6.1. Intraday Calibration: Aggressive Settings
The default 20-period SMA is often too lagging for a 1-minute or 5-minute chart. To capture rapid intraday swings, professional scalpers modify the mathematical baseline:
- The Settings: Change the Moving Average to a 10-period SMA and tighten the Standard Deviation to 1.5 (or 2.0 depending on the pair’s volatility).
- The Rationale: This aggressive configuration brings the bands closer to the price action, generating faster signals for micro-reversions (scalping the bounce) and early breakout detection.
- The Trade-Off: While it increases signal frequency, it simultaneously increases market noise. You must rigidly filter these signals with a secondary indicator, such as the RSI or VWAP, to avoid false triggers.
6.2. The Intraday Hazard: Algorithmic News Spikes
The most critical vulnerability of day trading with tightly calibrated Bollinger Bands is fundamental data releases (e.g., NFP, CPI, or Central Bank rate decisions).
- The Danger: During high-impact news, institutional algorithmic trading (HFT) injects massive, instantaneous liquidity into the market. This causes the bands to violently explode outward, completely invalidating technical support and resistance boundaries.
- The Rule: Never attempt to trade a Bollinger Bounce or Squeeze during a major economic announcement. Always consult the economic calendar and remain flat (no open positions) at least 15 minutes before and after Tier-1 data releases to protect your capital from algorithmic whipsaws.
7. When Bollinger Bands Give False Signals (The Danger Zones)
To achieve long-term profitability, knowing when not to use an indicator is just as crucial as knowing when to execute. Bollinger Bands are a mathematical derivative of historical price action; they do not possess predictive capabilities. If you blindly trade every band touch or squeeze breakout, you will inevitably fall victim to false signals.
Here are the four primary market environments where Bollinger Bands produce high-risk false signals, and how professional traders avoid them:
7.1. The “Band Walk” Trap in Strong Trends
When macroeconomic momentum takes over, price action will completely ignore standard deviation boundaries. Relying on mean reversion strategies during a structural trend is one of the fastest ways to drain a trading account.
- The Trap: In a ranging market, touching the upper band is a valid mean reversion (sell) signal. However, when a massive structural trend begins, the price will aggressively push against the outer band and “walk” along it for an extended period.
- The Reality: Amateur traders repeatedly try to fade (trade against) this move, assuming the market is “overbought” or “oversold.” This is a fatal flaw that leads to liquidated accounts.
- The Solution: Never apply mean reversion strategies when the upper and lower bands are rapidly expanding away from each other. In an expansion phase, an outer band touch is a sign of extreme institutional momentum, not market exhaustion.
7.2. The “Head Fake” Breakout (Liquidity Sweeps)
A tightening Bollinger Squeeze attracts thousands of retail breakout traders, creating a highly visible pool of liquidity. Smart money often exploits this by engineering a false breakout to absorb retail stop-losses before driving the market in the true direction.
- The Trap: Following a squeeze, the price violently breaks above the upper band, triggering retail long positions. Immediately after, the price reverses, crashes through the lower band, and initiates a strong downtrend.
- The Reality: This is a classic institutional liquidity sweep (often called a “head fake”). Institutions temporarily push the price outside the consolidation zone to trigger retail breakout buyers. This provides them with the necessary liquidity to fill their massive opposing orders.
- The Solution: Never trade a squeeze breakout based on a wick piercing the band. Demand a definitive candlestick body close outside the band, strictly confirmed by a massive surge in volume (such as OBV or Tick Volume).
7.3. Low-Liquidity Whipsaws
Bollinger Bands require sufficient trading volume and market participation to generate reliable boundaries. During off-peak market hours, the mathematical calculations become hyper-sensitive to minor, meaningless price fluctuations.
- The Trap: During low-volume periods, the bands contract naturally, creating the illusion of a valid Bollinger Squeeze setup. The price then sporadically breaches the bands, generating multiple false buy and sell triggers.
- The Reality: Without institutional backing, these micro-breakouts have zero structural follow-through. This typically occurs during the mid-Asian session or major global bank holidays.
- The Solution: Avoid trading breakouts during historically dead market hours. A true Bollinger Squeeze breakout requires the heavy participation and momentum found during the London open or the New York session overlap.
7.4. Algorithmic News Spikes
Macroeconomic data releases introduce sudden, extreme volatility that technical indicators are simply not built to process. Relying on Bollinger Bands during these fundamental events exposes your portfolio to unpredictable algorithmic price shocks.
- The Trap: Seconds after a major fundamental data release (e.g., U.S. Non-Farm Payrolls, CPI, or FOMC rate decisions), the price spikes violently, blowing past the outer Bollinger Bands before immediately retracting.
- The Reality: Bollinger Bands calculate standard deviation based on past data. They cannot price in instantaneous fundamental shocks. Algorithmic high-frequency trading (HFT) models react to macroeconomic data in milliseconds, rendering the mathematical boundaries of the bands completely useless.
- The Solution: Technical indicators are blind to fundamental catalysts. The safest professional approach is to stay flat (hold no open intraday positions) prior to Tier-1 economic releases. Wait for the initial volatility shock to subside and the bands to recalibrate before re-entering the market.
8. How to Combine Bollinger Bands With Other Indicators
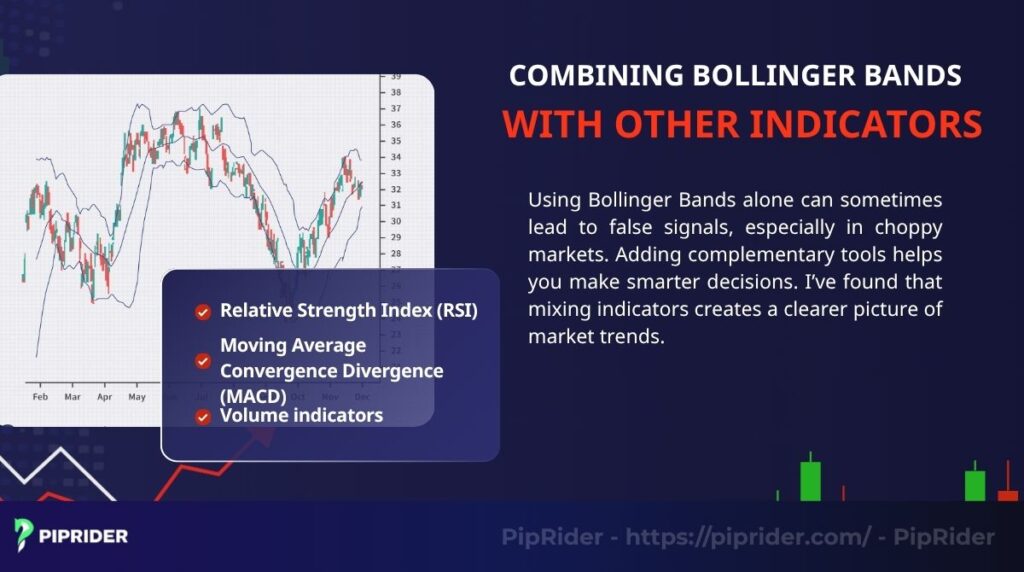
In professional trading, no single indicator provides a complete picture of the market. Bollinger Bands are exceptionally accurate at mapping standard deviation and volatility, but they do not measure momentum or structural liquidity. To build a high-probability trading edge, you must pair Bollinger Bands with complementary tools to create technical confluence.
Before diving into the detailed setups, use this summary matrix to identify which combination best fits your current trading objective:
| Indicator Combination | Primary Strategy | Key Confluence Signal |
|---|---|---|
| Bollinger + RSI | Mean Reversion | Overbought/Oversold levels at outer band touch. |
| Bollinger + MACD | Trend Expansion | MACD Histogram expansion (Appel, 1979) during a Squeeze breakout. |
| Bollinger + S/R | Structural Entry | Outer band overlapping with historical price levels. |
8.1. Bollinger Bands + RSI: The Reversal Confluence
When trading mean reversion, relying solely on a band touch is insufficient. You require proof that the momentum behind the price move is reaching exhaustion. The Relative Strength Index (RSI) (Wilder, 1978) serves as a critical momentum filter to validate potential market turnarounds.
- The Setup: Price pierces the upper or lower Bollinger Band during a ranging (sideways) market.
- The Confirmation: Observe the RSI. If the price tags the upper band while the RSI is above 70, or tags the lower band while the RSI is below 30, it confirms momentum exhaustion.
- Pro Tip (Divergence): A high-probability buy signal occurs when the price makes a lower low at the bottom band while the RSI creates a higher low. This structural divergence indicates institutional buying pressure.
8.2. Bollinger Bands + MACD: The Trend Validator
While the RSI is ideal for range-bound reversals, the Moving Average Convergence Divergence (MACD) is the primary tool for confirming trend strength during a volatility expansion. This combination ensures you are entering a trend with real institutional momentum.
- The Setup: A Bollinger Squeeze phase ends with a strong candlestick closing definitively outside the bands.
- The Confirmation: Check the MACD histogram and signal lines. For a bullish breakout, the MACD lines should cross upward, and the histogram bars should expand above the zero line simultaneously with the price action.
- The Warning: If the price breaks the upper band but the MACD histogram is flat or declining, the move lacks financial backing. This is a high-risk “fakeout” zone.
8.3. Bollinger Bands + Support/Resistance: Structural Validation
Technical indicators are mathematical derivatives of price; therefore, the underlying market structure must always be your primary filter. Bollinger Bands become significantly more powerful when they align with historical liquidity zones on the chart.
- The Setup: Identify your key macro support and resistance zones on the Daily or H4 timeframe before applying the indicator.
- The Confirmation: Wait for the outer Bollinger Bands to dynamically overlap with your pre-defined static support or resistance lines. This overlap creates a “High-Probability Confluence Zone.”
- The Execution: Entering a trade where the lower band meets a major historical support level allows for surgical precision and an exceptionally tight stop-loss, significantly improving your risk-to-reward ratio.
9. Bollinger Bands vs. Keltner Channels vs. ATR
A common point of confusion for developing traders is understanding the difference between volatility-based indicators. While Bollinger Bands, Keltner Channels (Keltner, 1960), and the Average True Range (ATR) all measure market volatility, their mathematical foundations and practical applications are distinctly different.
Using the wrong tool for your specific strategy will result in premature exits, missed breakouts, or widened stop-losses. Use this institutional comparative matrix to align the correct indicator with your trading objective:
| Indicator | Mathematical Basis | Primary Trading Application |
|---|---|---|
| Bollinger Bands | Standard Deviation (Std Dev) | Volatility Extremes & Mean Reversion. Best for identifying squeezes and range boundaries. |
| Keltner Channels | Average True Range (ATR) | Trend Following & Breakouts. Smoother bands make it superior for riding established trends. |
| Average True Range (ATR) | Absolute Price Range | Range Volatility. Used purely to measure pip movement for dynamic stop-loss placement. |
9.1. Bollinger Bands: The Standard Deviation Engine
Bollinger Bands are highly reactive to sudden price shocks because their outer boundaries are calculated using standard deviation. This mathematical sensitivity makes them expand and contract violently in real-time.
- The Strength: They are mathematically unparalleled at identifying absolute market extremes and periods of volatility contraction (The Squeeze).
- The Weakness: Because they are so mathematically sensitive, they can produce erratic and jagged bands during choppy markets, occasionally leading to premature exit signals during a strong directional trend.
9.2. Keltner Channels: The Trend-Following Filter
Unlike Bollinger Bands, Keltner Channels use the Average True Range (ATR) to set their upper and lower boundaries. The ATR is an average of historical price ranges, which heavily smooths out the data.
- The Strength: Keltner Channels do not expand as violently as Bollinger Bands. They maintain a relatively consistent width, making them the superior tool for Trend Following. A breakout above a Keltner Channel is a more reliable trend continuation signal than a Bollinger Band touch.
- The Weakness: They are significantly less effective at identifying mean reversion setups or predicting volatility explosions, as they do not visually contract as dramatically during low liquidity.
9.3. Average True Range (ATR): The Pure Volatility Gauge
The ATR is not an overlay channel mapped over price action; it is a standalone oscillator that measures the absolute range of price movement (i.e., how many pips a pair moves per day). It provides zero directional bias.
- The Strength: It is the ultimate tool for Dynamic Risk Management. Professional traders use the ATR to set stop-losses that breathe with the market. If a currency pair’s daily ATR is 80 pips, placing a rigid 20-pip stop-loss guarantees you will be stopped out by normal market noise.
- The Weakness: The ATR will not tell you if the market is trending up, trending down, or consolidating. It only dictates the numerical velocity of the current environment.
10. The Mathematics Behind Bollinger Bands (Formula & Calculation)
While modern trading terminals like MT4 and TradingView calculate Bollinger Bands instantly, understanding the underlying mathematical formula is a prerequisite for advanced quantitative traders. The indicator is built entirely on statistical variance and the normal distribution of price data (Bollinger, 2001).
Bollinger Bands consist of three distinct lines. Here is the standard institutional calculation framework:
10.1. The Base: Simple Moving Average (SMA)
The foundation of the indicator is an n-period Simple Moving Average, which establishes the baseline trend (the mathematical mean). The default parameter for n is 20 periods.
Middle Band = (Σ Pi) / n
10.2. The Volatility Measure: Standard Deviation
To calculate the outer bands, the formula measures the dispersion of price from the average using Standard Deviation. This ensures the bands dynamically react to absolute market volatility.
- Process: First, calculate the variance by taking the average of the squared differences from the mean, then find the square root to determine the Standard Deviation.
10.3. The Outer Bands: Upper and Lower Boundaries
Once the Standard Deviation is established, it is multiplied by a factor (k), which is typically set to 2. This mathematical boundary theoretically contains approximately 95% of all price action within the bands based on the empirical rule of normal distribution.
Upper Band = Middle Band + (σ × 2)
Lower Band = Middle Band − (σ × 2)
Parameter Adjustments: If you modify the baseline SMA to track faster market cycles, you must mathematically recalibrate the multiplier. For example, a 10-period SMA should be paired with a 1.5 multiplier, while a 50-period SMA requires a wider 2.5 multiplier to prevent excessive false signals.
11. The Professional Execution Checklist
Before executing any trade based on Bollinger Bands, professional traders run through a rigorous validation process. Use this checklist to filter out high-risk setups and ensure your trade aligns with institutional order flow:

| Critical Check | Professional Action |
|---|---|
| Market Context | Is the 20 SMA flat (Range) or angled (Trend)? Never fade a trend using mean reversion logic. |
| Confluence Filter | Has the RSI or MACD confirmed the momentum exhaustion or expansion? Never trade a band touch in isolation. |
| Volatility Pairing | Are the settings optimized? Use 2.5 Std Dev for volatile pairs like GBP/JPY or Gold (XAU/USD). |
| Risk Validation | Is the Stop-Loss placed outside the band with a liquidity buffer? Ensure the Reward-to-Risk ratio is at least 1:2. |
| Economic Calendar | Are there high-impact news releases (NFP, CPI) in the next hour? If yes, stay flat and wait for the volatility to settle. |
12. FAQs – Frequently asked questions about Bollinger Bands
Traders often have questions regarding the optimal mathematical application of Bollinger Bands in the forex market. This section addresses the most common technical queries to help you execute with confidence.
13. Conclusion
Bollinger Bands are not merely lines on a chart; they are a highly accurate visual representation of statistical variance and institutional order flow. By mastering the distinction between mean reversion environments and trend expansion phases, traders can mathematically quantify market extremes and capitalize on predictable volatility cycles.
Success with this indicator requires strict execution discipline—knowing exactly when to trade a Squeeze breakout and, equally importantly, knowing when to stay flat during algorithmic news spikes. Because professional trading relies on confluence, always pair your volatility analysis with structural price action and momentum validation.
To further refine your technical edge and build a robust trading system, explore the advanced strategies in the “Technical Indicators List“ article and “For Beginners” sections on PipRider. Equip yourself with the right data, rigorously test your parameters, and approach the markets with an institutional mindset.
Infographic Section
-
Bollinger Bands: The Volatility & Squeeze Indicator -
Trading with Bollinger Bands -
Optimizing Settings by Trading Style & Avoiding False Signals


