
When you’re a day trader, you’re constantly trying to figure out the market’s daily rhythm. The average daily range ADR technical indicator is one of those simple, no-frills tools that can genuinely give you an edge. It’s less about complex signals and more about giving you a solid dose of reality for the trading day.
In this guide, we will explore everything you need to know about the ADR. We will cover what it is, why it is a staple in institutional toolkits, and how you can use it to make smarter, data-driven decisions.
Key Takeaways
- The ADR tells you the average size of a daily price move, helping you understand an asset’s typical volatility, but it will never predict if the price will go up or down.
- Its greatest strength is helping you set logical stop-loss and take-profit levels, making it a powerful risk management tool for exits, not an entry signal generator.
- Choose your tool based on your trading style: use the ADR for day trading, and switch to the ATR to account for overnight price gaps if you hold positions longer.The ADR is a lagging indicator based on historical data, so be extra cautious on days with major news, as current volatility can far exceed the historical average.
- By showing you what a “normal” day’s range looks like, the ADR helps you manage your profit expectations and avoid chasing moves that are statistically unlikely.
1. What is the Average Daily Range ADR Technical Indicator?
The Average Daily Range (ADR) indicator measures how far an asset’s price typically moves from its peak to its trough on any given trading day. It calculates this by averaging the daily price movements over a specific period.
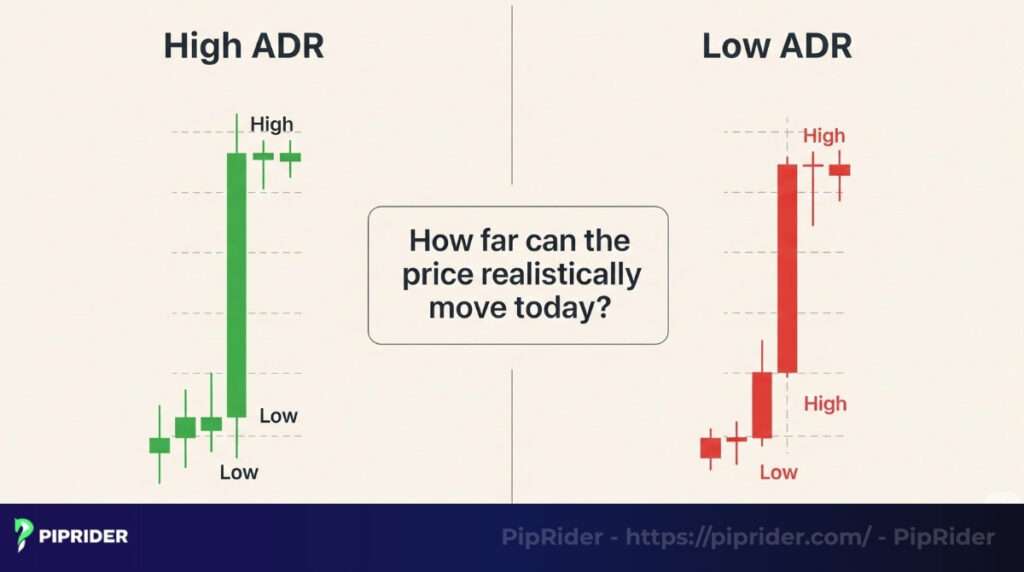
The primary purpose of the ADR is to help traders understand the potential daily volatility of a market. It answers the question, “How far can the price realistically move today?”
In institutional finance, measuring historical volatility is a core component of risk budgeting. As outlined in standard technical analysis frameworks, including the CFA Institute curriculum, defining the expected distribution of price returns allows traders to distinguish between normal daily market noise and statistically significant structural breakouts.
Important note:
- The ADR does not predict the direction of the market. A high ADR simply indicates that the market is experiencing significant volatility; it doesn’t tell you whether the price will go up or down.
- The ADR provides a practical guideline for price movement, which helps traders set more realistic profit targets and stop-loss levels.
A Practical Example: Managing Expectations
If the EUR/USD pair is displaying an ADR(14) of 75 pips, it instantly signals that targeting a 150-pip intraday profit is a statistical anomaly, barring a major macroeconomic news event. Instead of relying on hope, the ADR frames realistic, data-driven expectations for the entire trading session.
Pro Tip: Using ADR as a Pre-Trade Screener
Professional traders don’t just use the ADR for entries; they use it as a filter. If you want a low-stress session, scan the market for currency pairs with a lower ADR (e.g., EUR/GBP). If you are looking for explosive momentum and intraday action, filter for pairs with a high ADR (e.g., GBP/JPY or Gold). The ADR matches the market’s personality to your trading style.
2. What the ADR Really Tells You (Intraday Insight)
Knowing the Average Daily Range is one thing; knowing how to trade it is what separates professionals from amateurs. The ADR acts as a Statistical Map, answering the most critical question in day trading: “Is there still a high-probability ‘runway’ left for this move?”
Instead of guessing, the ADR allows you to execute based on three professional pillars:
2.1. Quantifying the Market’s “Runway”
The ADR reveals how much “space” an asset has left to travel before hitting its typical statistical limit.
The Logic: If the ADR is 100 pips and the price has only moved 30 pips from the daily open, you have a significant remaining runway.
The Formula:
Remaining Runway = ADR – Intraday Range (IR)
Decision Power: This calculation tells you if the “juice is worth the squeeze” for a trend-following entry.
2.2. The Exhaustion Filter: Stop Chasing the Move
The ADR is your primary tool for fighting FOMO (Fear of Missing Out). It acts as a technical “handbrake” to prevent you from entering a trade when the move is already mathematically exhausted.
- The 90% Rule: If the current Intraday Range (IR) has already reached 90% of the ADR, the market is “full.”
- The Warning: Entering a trend-following trade at this stage is a low-probability move. The price is statistically likely to either stall or suffer a sharp mean-reversion reversal.
2.3. Statistical Target Calibration
The ADR replaces “hope” with “probability” when setting profit targets. It provides a hard mathematical ceiling for what is realistically achievable within a single trading session.
- Precision Exits: Instead of aiming for a random round number, professional traders anchor their Take Profit (TP) within 80-90% of the ADR.
- The Edge: This ensures your exits are hit before the market runs out of momentum, leading to a significantly higher win rate.
2.4. The ADR Action Matrix: From Data to Decision
This matrix is the “heart” of the ADR strategy. By comparing the current Intraday Range (IR) against the ADR, you can instantly classify the market environment and dictate your next move with mathematical confidence.
| Current IR vs. ADR | Market Context (Meaning) | Professional Action |
|---|---|---|
| < 50% ADR | High Runway: The move is in its early stages with plenty of “fuel” left. | Green Light: Ideal for trend-following and high-RR setups. |
| 50% – 80% ADR | Mature Move: The asset has established a trend but is approaching its average. | Caution: Tighten stops; avoid adding heavy positions. |
| 80% – 100% ADR | Near Full Extension: Price is reaching its typical daily exhaustion point. | Avoid New Entries: Focus on trailing stops and exits. |
| > 100% ADR | Mathematically Exhausted: Move is overextended and statistically unsustainable. | Reversal Watch: Look for profit-taking or counter-trend signals. |
💡Pro Tip: Beware of the “Exhaustion Trap”
Never ignore a > 100% ADR reading. While a trend can occasionally go “parabolic” due to high-impact news, the laws of probability dictate that such moves are unsustainable. Professional institutional traders use this “Exhaustion Zone” to scale out and take profits into the strength. Conversely, retail traders often fall into the FOMO trap, entering precisely when the market has run out of gas.
Rule of thumb: If the tank is empty, don’t start the engine.
3. How to Accurately Calculate the ADR Indicator
While modern trading platforms calculate the Average Daily Range automatically, professional traders must understand the underlying math to trust the data. Fortunately, the formula is straightforward and relies on pure price action.
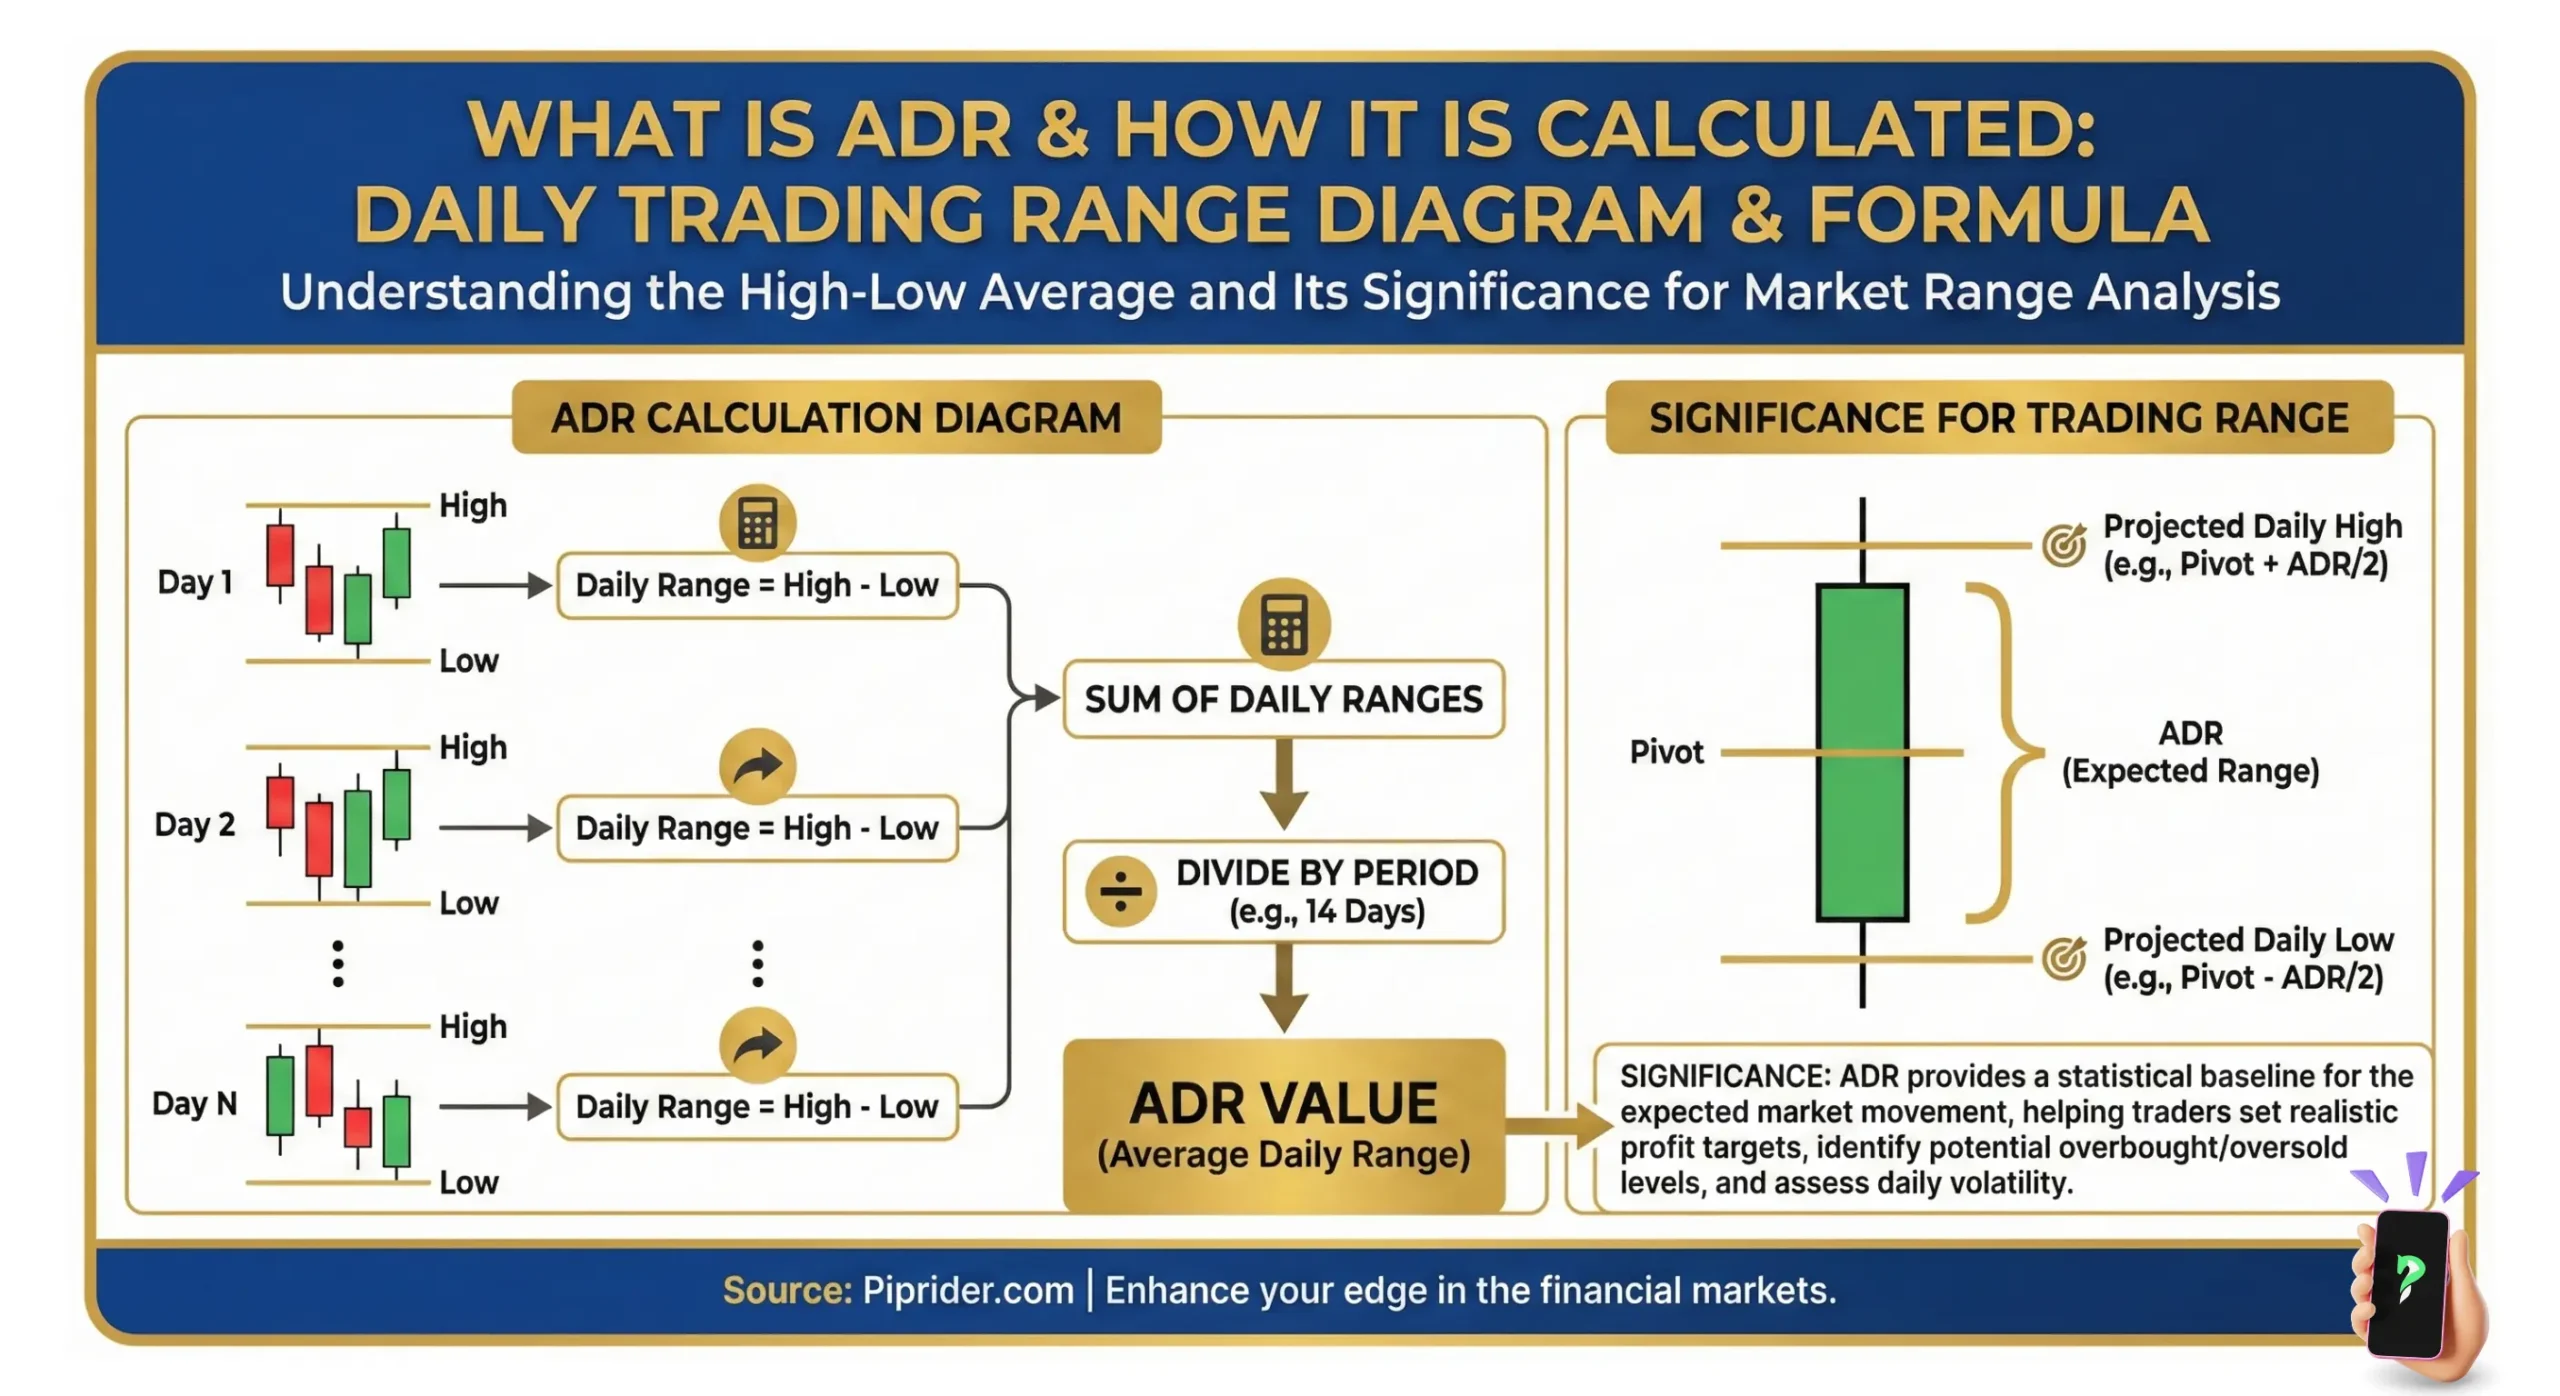
The calculation is a simple two-step process:
Step 1: Calculate the Daily Range
For each specific day in your chosen period, subtract the session’s absolute low from the session’s absolute high.
Daily Range = High – Low
Step 2: Calculate the Average
Sum the daily ranges over a specific number of days (n), and divide by that exact number to find the mean.
ADR = Sum of Daily Ranges / Number of Days (n)
The Industry Standard: The 14-Day Period
While the parameter (n) can be adjusted, the ADR(14) has become the institutional standard in Forex trading. A 14-day period perfectly encapsulates roughly two to three weeks of trading data. This strikes the optimal balance: it is fast enough to react to recent volatility shifts, yet slow enough to filter out the noise of a single erratic news day.
4. How to Use ADR in Intraday Trading: The Step-by-Step Workflow
Knowing the theory is fine, but executing it in real-time requires a strict, repeatable process. Before entering any intraday trade, run through this 4-step ADR workflow to ensure your capital is only deployed in high-probability environments.
Step 1: Identify the ADR Value (The Daily Limit)
Start your trading session by checking the asset’s current ADR. For example, if you are trading EUR/USD and the ADR(14) is displaying 100 pips, this is your baseline. It tells you that historically, this pair moves about 100 pips from high to low on an average day.
Step 2: Check the Current Intraday Range (The Current Move)
Look at the current session’s price action. Measure the distance from the absolute High of the day to the absolute Low of the day. This gives you the Intraday Range (IR). Let’s say EUR/USD has currently moved 70 pips from its daily low.
Step 3: Compare the Current Move vs. The ADR (The Runway)
Now, compare the two numbers to calculate the remaining “runway.”
- In our example: 100 pips (ADR) – 70 pips (Current IR) = 30 pips.
- The asset has already consumed 70% of its average daily energy, leaving only a 30-pip window before it hits statistical exhaustion.
Step 4: Execute the Decision (Action Plan)
Based on the comparison in Step 3, make an objective trading decision without emotional bias:
- Scenario A (Trade Continuation): If the asset has only moved 30% to 50% of its ADR, you have a green light. There is plenty of room left to enter a trend-following trade with a logical profit target.
- Scenario B (Avoid or Take Profit): If the asset has already moved 80% to 100% (like our 70-pip example above), the trend is mature. Do not enter new positions. Instead, use this zone to aggressively trail your stop-losses, take profits, or look for mean-reversion reversal setups.
Beginner’s Shortcut: The “Early & Under 80” Rule
If you are new to day trading, keep your execution as simple as possible. Skip the complex setups and strictly follow these two rules:
- Focus on the Early Session: Look for entries only during the first few hours of the London or New York opens, when the Intraday Range (IR) is still small and the “runway” is clear.
- The Hard Stop (Avoid > 80% ADR): If you open your chart and see the price has already consumed 80% of its ADR, simply walk away. Do not try to squeeze out the last few pips, and do not attempt advanced reversal trades. Protect your capital and wait for tomorrow’s reset.
5. Strategies for Using the ADR Indicator in Forex Trading
In Forex trading, understanding a currency pair’s Average Daily Range (ADR) is incredibly important. It provides a realistic view of typical daily volatility, helping traders make data-driven decisions. Here is how to practically apply the ADR in day-to-day Forex trading.
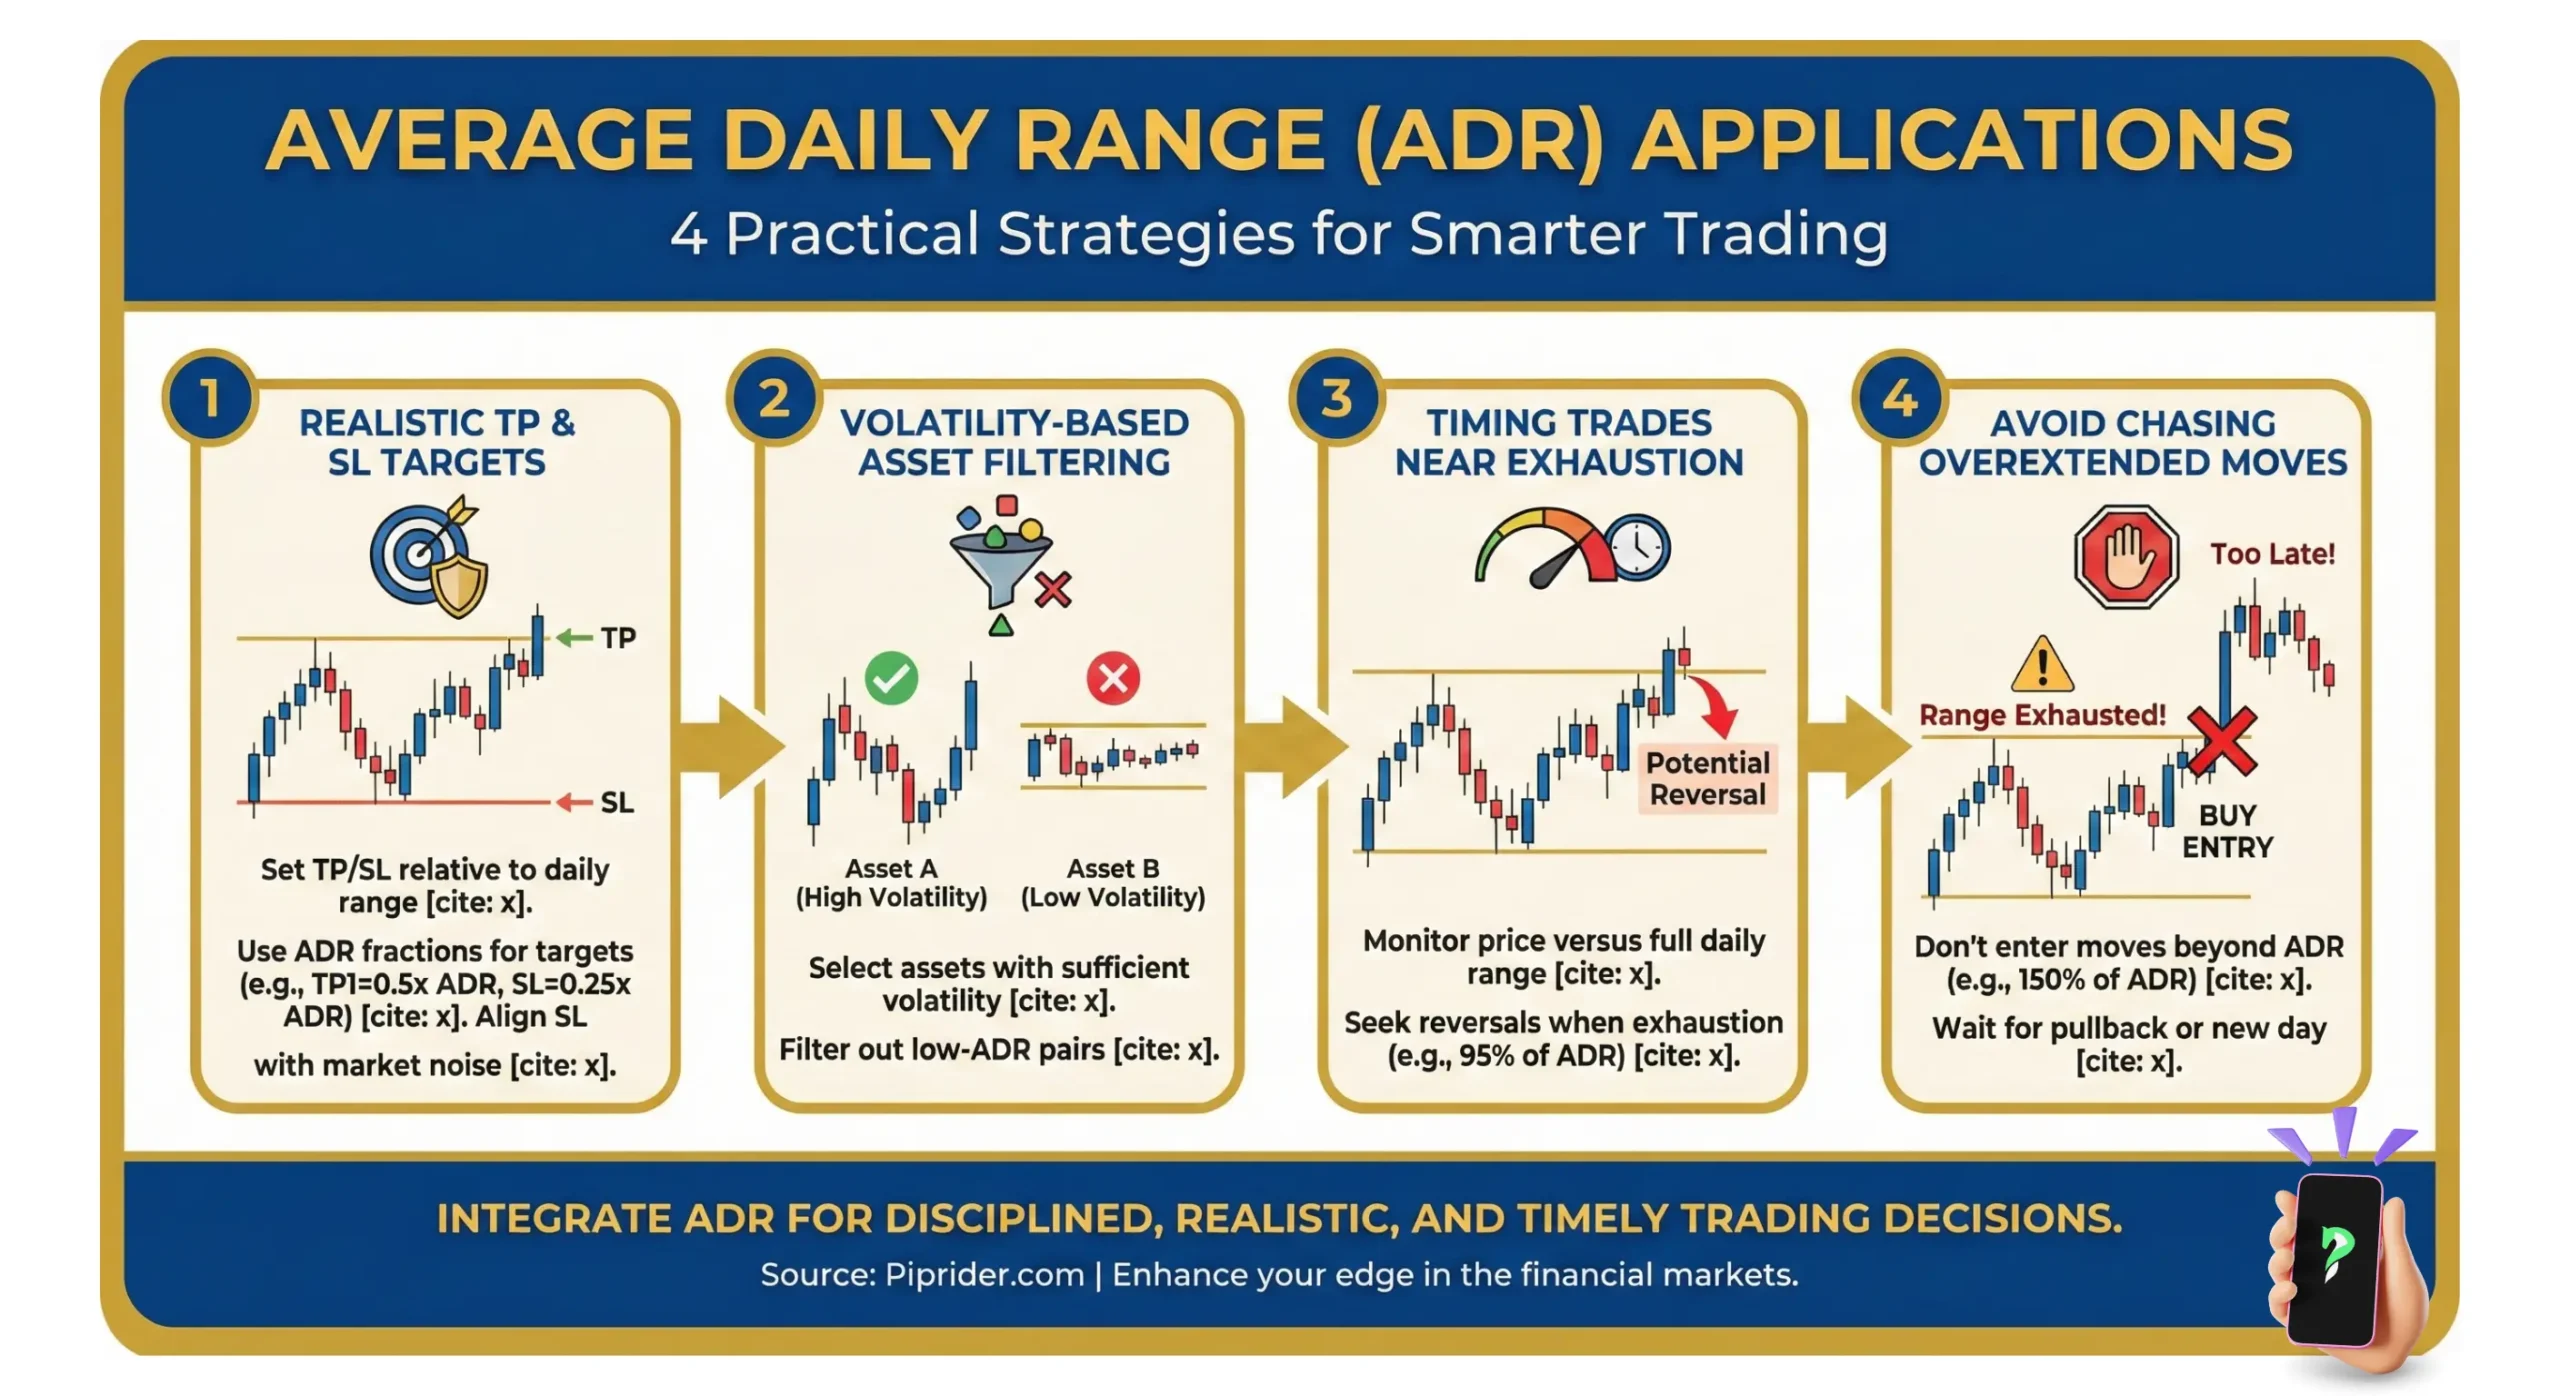
5.1. Setting Smart Profit Targets (The Mathematical Setup)
This is the core and most effective application of the ADR. By projecting the ADR from the daily extremes, you establish a highly probable target zone.
Let’s say you are trading EUR/USD, and its ADR(14) is 80 pips:
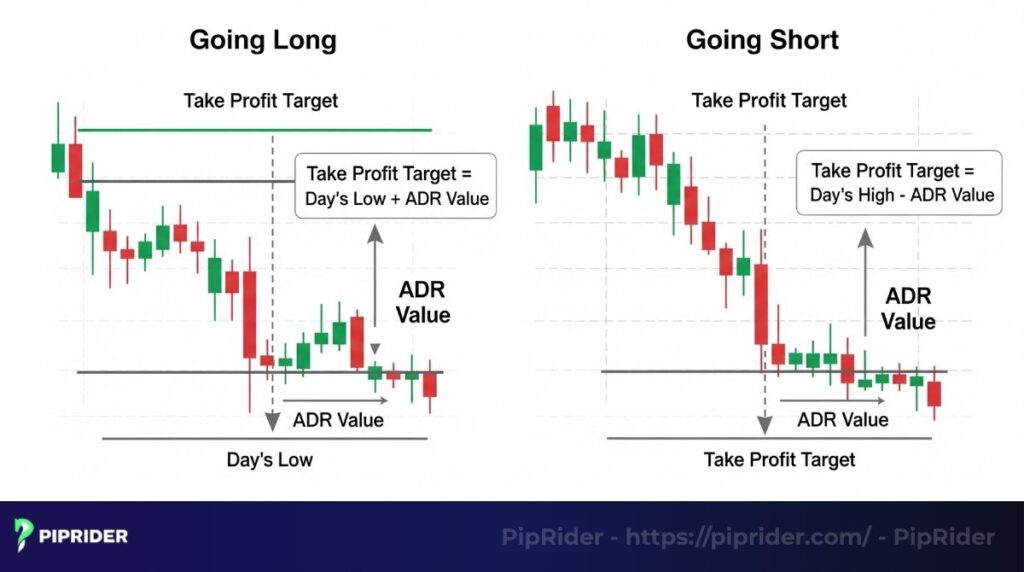
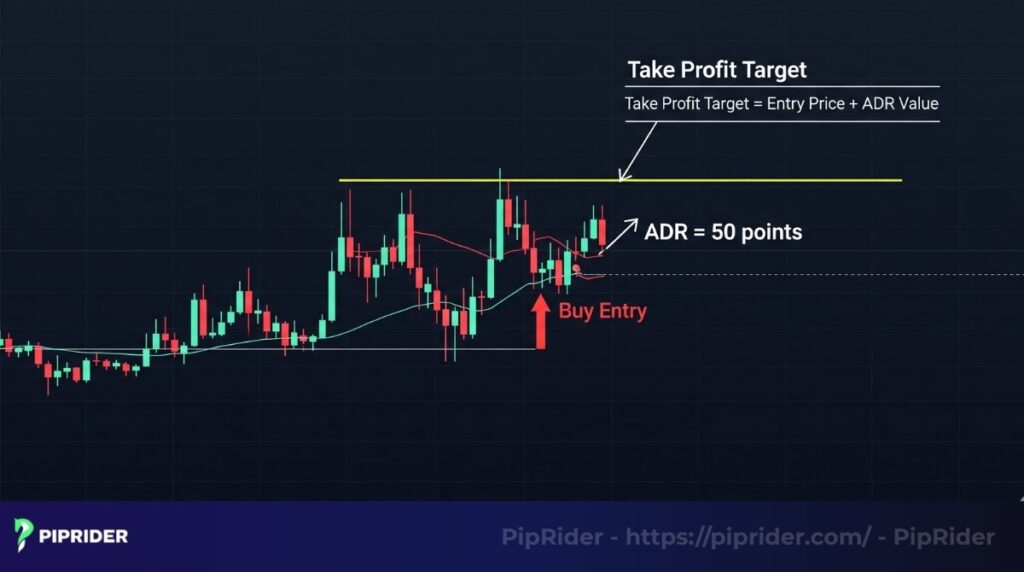
- For Long Trades (Buying): Add the ADR value to the daily low. If the daily low is 1.0700, adding the 80-pip ADR projects a potential high around 1.0780. However, professional traders rarely try to “eat” the full 100%. Aim for 80-90% of the ADR (e.g., 64–72 pips). This puts your realistic Take Profit between 1.0764 and 1.0772, significantly increasing your chances of getting filled before a reversal.
- For Short Trades (Selling): Subtract the ADR value from the daily high. If the daily high is 1.0850, subtracting 80 pips projects a potential low of 1.0770. Again, adjust your target to the 80-90% safety zone to secure profits effectively.
5.2. Strategy 1: Trend Continuation (ADR + Moving Averages)
When a currency pair’s Intraday Range (IR) is still low compared to its ADR, it means the asset still has “space” to move. This is the ideal environment for trend-following.
- The Strategy: Combine the ADR with a Moving Average (MA or EMA).
- Execution: If the price is trending above the 20 EMA (indicating a clear uptrend) and the IR has only consumed 30-40% of the daily ADR, the statistical edge favors entering a buy position on a pullback to the EMA. The remaining ADR provides the necessary “runway” to reach your profit target.
5.3. Strategy 2: Exhaustion Reversal (ADR + RSI)
Conversely, if the current Intraday Range has already reached or exceeded 80-90% of the ADR value, it is a glaring warning sign. The price movement has likely “run out of steam.”
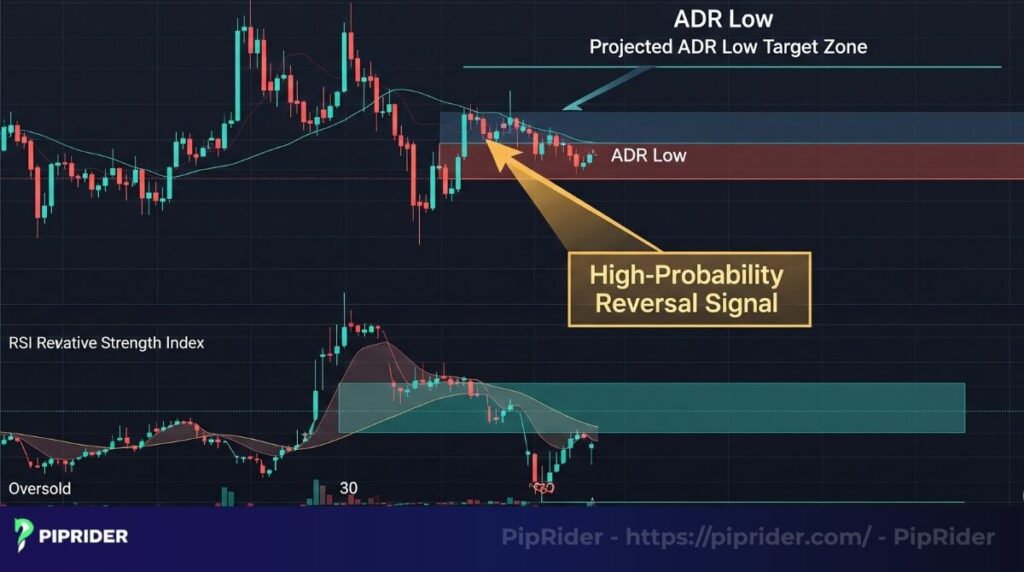
- The Strategy: Combine extreme ADR readings with the Relative Strength Index (RSI) to pinpoint high-probability reversals.
- Execution: When the price reaches the 90-100% ADR target zone, and the RSI simultaneously signals an extreme “overbought” (above 70) or “oversold” (below 30) condition, this creates a powerful confluence. It indicates a high probability of a reversal, making it the perfect time to take profits on existing trades or look for counter-trend entries.
5.4. Data-Driven Stop Losses
The ADR also prevents the common mistake of placing stop-losses too close to the market’s normal fluctuations. Instead of picking a random pip number based on emotion, set your stop-loss based on the market’s current volatility.
- The Application: Set your stop-loss at a specific percentage of the ADR—typically 25% or 50%—away from your entry price or the nearest swing high/low.
- The Benefit: If EUR/USD has an 80-pip ADR, a 25% ADR stop equals 20 pips. This mathematical approach gives your trade enough “breathing room” to survive minor intraday noise without premature liquidation.
6. The Time-Based Context: Timing Your ADR Setups
Price is only half the equation; time is the other. According to the Triennial Central Bank Survey by the Bank for International Settlements (BIS), the UK (London) accounts for 38.1% of global over-the-counter FX turnover, while the US (New York) drives 19.4%. To maximize your win rate, you must align your ADR analysis with these two massive institutional liquidity windows.
6.1. The London Open (The Ignition Phase)
The London session is the undisputed liquidity hub of the Forex market and typically where the true daily trend is established.
- The Setup: Coming out of the historically slow Asian session, the Intraday Range (IR) is usually very compressed (often < 30% of the ADR). The market has a full “tank of gas.”
- The ADR Edge: This is the optimal window for Trend Continuation entries. If a strong directional move breaks out at the London open, you have a massive statistical “runway” to capture the bulk of the day’s movement. Institutions aggressively build positions here because the math supports a sustained move.
6.2. The New York Session (The Overlap & Exhaustion)
The New York open brings a massive second wave of institutional volume, particularly during the highly liquid London-New York overlap (8:00 AM – 12:00 PM EST).
- The Setup: By the time the US session is fully underway, the asset has often already consumed 60% to 80% of its ADR due to the earlier European movement.
- The ADR Edge: The early New York session is often your last safe window to join a pre-existing trend. However, as the session progresses into the afternoon (after European markets close), the price will frequently hit its 90-100% ADR limit.
- The Shift: This makes the mid-to-late New York session the prime hunting ground for Profit-Taking and Exhaustion Reversals, rather than new trend-following entries.
The Professional Rule of Thumb: Expect the expansion of the ADR during the London session, and look for the completion (and potential reversal) of the ADR during the late New York session.
7. Trading with Confluence: The ADR Multiplier
The ADR is a highly accurate volatility map, but it is not a standalone entry signal. To maximize your win rate and filter out false setups, professional traders combine the ADR with core technical elements to create high-probability “Confluence Zones“.
7.1. ADR + Support/Resistance (The Hard Barrier)
The strongest trade setups occur when a mathematical limit (ADR) aligns with a structural limit (S/R).
- The Concept: You are pairing the asset’s maximum daily statistical reach with a physical price barrier where institutional orders are clustered.
- The Execution: Look for setups where the price hits the 90%–100% ADR exhaustion zone exactly at a major daily/weekly Support or Resistance level, or a psychological round number (e.g., 1.1000).
- The Trigger (Example): Let’s say EUR/USD has an ADR of 80 pips. Moving 80 pips upward brings the price exactly to the 1.0850 Daily Resistance. Do not sell blindly. Wait for a bearish Price Action trigger—such as a Pin Bar or a Bearish Engulfing candlestick—to print at this exact Confluence Zone before entering short.
7.2. ADR + Higher Timeframe Trend (The Directional Filter)
The ADR tells you how far the market can go today, but the Higher Timeframe (HTF) trend tells you which direction holds the true edge.
- The Concept: Never use the ADR to fight a strong macroeconomic trend. Trend is king; ADR is just the roadmap.
- The Execution: Determine the trend on the Daily (D1) or 4-Hour (H4) chart. If the HTF trend is strongly bullish, only use the ADR to find long continuation entries (buying the dip when the Intraday Range is < 50% of ADR) or to set Take Profit targets.
- The Rule: Strictly ignore short (reversal) signals even if the daily ADR hits 100%. In a strong institutional uptrend, the price can easily stretch to 120% or 150% of its average limits, crushing counter-trend traders.
7.3. ADR + Volume (The Momentum Validator)
Using tick volume alongside the ADR provides a real-time x-ray of institutional participation, confirming if a move is genuine or a trap.
- The Concept: Volume validates the price action. It tells you whether the market is pushing toward the ADR limit with real money or just algorithmic stop-hunting.
- The Execution for Continuation: If the price is moving toward the 50% ADR mark on rising, above-average volume, it confirms institutional support. The trend is healthy and likely to reach the full ADR target.
- The Execution for Reversal: If the price hits the 100% ADR limit accompanied by a massive, sudden volume spike (a volume climax), it strongly indicates retail FOMO buying/selling while smart money is unloading their positions. This volume anomaly at the ADR extreme is the perfect confluence for an immediate mean-reversion trade.
8. Real-Market Case Studies: ADR in Action
To master the Average Daily Range, you must see how the math translates into real-time price action. Below are two practical case studies showing how professional traders execute entries based on specific ADR percentages.
Case Study 1: The 95% Exhaustion Reversal (GBP/JPY)
- The Scenario: The price reaches 95% of its daily capacity, signaling statistical exhaustion.
- The Data: GBP/JPY has an ADR(14) of 120 pips. During the late New York session, the pair pushes 114 pips upward from its daily low (114 ÷ 120 = 95% ADR consumption).
- The Confluence: At this exact 95% limit, the price strikes a major Daily Resistance level (e.g., 190.50), and the 15-minute RSI spikes above 80 (Extreme Overbought).
- The Execution: The “daily fuel tank” is empty. Do not buy the breakout. Wait for a bearish reversal candle (such as a pin bar) at the resistance level and enter a short position. Target a regression to the session’s mean (e.g., the 20 EMA).
Case Study 2: The 40% Trend Continuation (EUR/USD)
- The Scenario: The price has consumed only 40% of its daily capacity early in the session, leaving a massive runway for profit.
- The Data: EUR/USD has an ADR(14) of 80 pips. Two hours into the London session, the price moves 32 pips upward from the daily low (32 ÷ 80 = 40% ADR consumption).
- The Confluence: The price is actively trending and holding above the 20 EMA on the 15-minute chart.
- The Execution: You still have 48 pips of “runway” remaining before the pair hits its statistical average. You have a mathematical green light to buy. Enter a long position on a minor pullback to the 20 EMA. Set your Take Profit conservatively at the 80%–85% ADR mark.
9. When ADR Fails
The ADR is a historical average, meaning it works best in “normal” market conditions. However, relying on it blindly during abnormal market environments can lead to significant losses. You must disregard standard ADR limits in these four specific scenarios:
- News Spikes: During high-impact macroeconomic releases (e.g., US NFP, CPI, or Central Bank decisions), historical averages become instantly irrelevant. As noted in market microstructure reports by the Bank for International Settlements (BIS), Tier-1 liquidity providers routinely withdraw quotes milliseconds before major data releases to protect their capital. This sudden drop in market depth (low liquidity) combined with massive institutional orders allows a single news candle to easily blow past the 100% ADR limit.
Professional Action: Never use the ADR to “fade” (trade against) a major news spike.- Professional Action: Never use the ADR to “fade” (trade against) a major news spike.
- Breakout Days: When an asset breaks out of a long-term consolidation phase, pent-up energy is suddenly released. Because the ADR is a lagging indicator (trailing the recent tight ranges), it will severely underestimate the explosive volatility of a true structural breakout.
- Strong Trend Days: On days driven by heavy institutional flows or black swan events, the market can trend aggressively without meaningful pullbacks. In these parabolic conditions, the price can easily stretch to 150% or 200% of the ADR.
- Professional Action: Attempting a mean-reversion trade simply because the ADR is “maxed out” during a strong trend day is a dangerous trap. Do not step in front of a freight train.
- Low Liquidity Environments: During bank holidays, late Friday sessions, or the December holiday period, the market lacks structural depth. This leads to two dangerous extremes: either artificially compressed ranges where the price barely moves, or erratic, algorithmic stop-hunting spikes that break ADR parameters without any real fundamental momentum.
10. ADR vs. ATR vs. IR: Which Indicator is Right for You?
It’s common for traders to get the ADR, ATR, and IR confused, as they all relate to volatility. Using the right tool for the job is critical. Let’s clear this up.
10.1. Defining the key differences
The main distinction is about what’s being measured and if it’s an average.
- ADR and ATR are averages calculated over a past period (like 14 days). They tell you what’s “typical.”
- IR (Intraday Range) is simply the High – Low of the current session only. It’s a real-time snapshot, not an average.
The fundamental distinction that every trader needs to grasp is how each indicator treats price gaps: the ATR factors them into its calculation, whereas the ADR completely disregards them.
10.2. Comparison table: ADR vs. ATR vs. IR
For a quick visual summary, the table below breaks down the key characteristics of each indicator.
| Feature | Average Daily Range (ADR) | Average True Range (ATR) | Intraday Range (IR) |
|---|---|---|---|
| Primary Focus | The typical range for a full day | An asset’s complete volatility, including gaps | The range of the current session so far |
| Is it an Average? | Yes, over a set period (e.g., 14 days) | Yes, over a set period (e.g., 14 days) | No, it’s a real-time, single-period value |
| Considers Gaps? | No | Yes | No |
| Best Used For | Intraday profit targets and stop-losses | Swing trading and overnight risk management | Real-time volatility checking |
The Professional Rule of Thumb: If you are day trading and will be flat by the end of the day, use the ADR. If you are swing trading and plan to hold overnight or through a weekend, always use the ATR to respect the risk of overnight gaps.
11. Answering common questions about the ADR indicator
Here are a few questions I get asked all the time by other traders.
12. Conclusion: Final thoughts and advice
The Average Daily Range ADR Technical Indicator is a tool that brings a dose of reality to your trading. It helps you stop guessing and start making data-driven decisions about your exits, which in turn helps manage both risk and expectations.
Stop ignoring daily volatility. Make checking the ADR a non-negotiable part of your pre-trade routine. By mastering this simple average daily range ADR technical indicator, you’re not adding a complex signal; you’re adding professional-level context. Go try it on a demo account until it becomes second nature.
Follow PipRider for a deeper dive and visit the Technical Indicators list article to explore more valuable insights.
Infographic Section
-
What is ADR & How it is calculated -
Average Daily Range (ADR): Applications -

ADR vs. ATR vs. IR


