
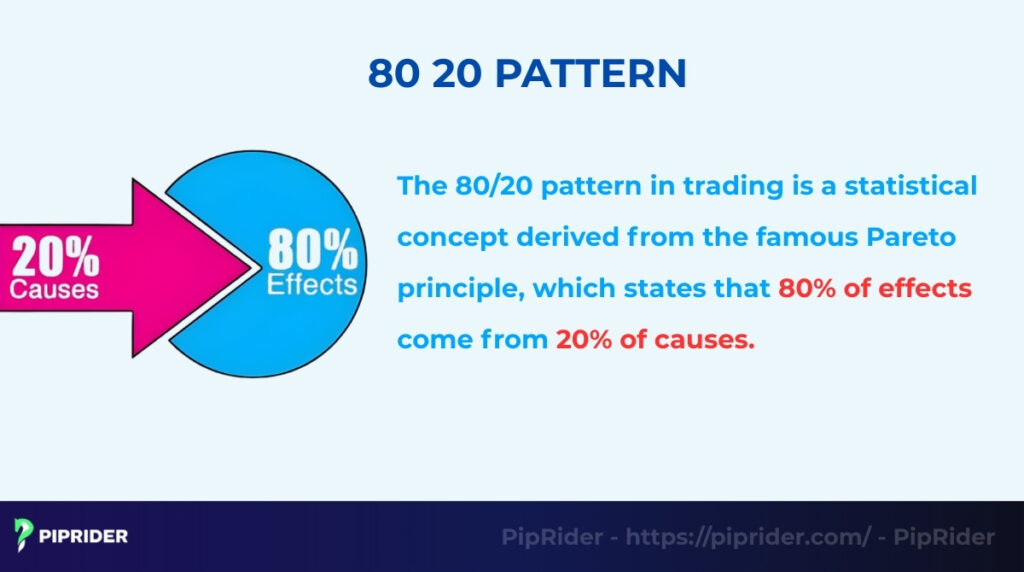
The 80/20 pattern is a powerful price action rule based on the Pareto principle. It states that 80% of breakouts from a trading range will fail, creating high-probability reversal opportunities for traders.
However, the 80-20 pattern is not a standalone signal. While excellent for capturing reversals after strong moves, it works best when combined with liquidity zones, structure breaks, or volatility expansion to filter out market noise.
This guide provides a complete breakdown of the Linda Raschke 80/20 setup, the psychology behind false breakouts, and the exact step-by-step playbook to trade it effectively.
Key Takeaways
- The 80/20 pattern suggests that 80% of breakouts from a trading range will fail, causing the price to reverse.
- It is highly effective when used in supply-demand zones, liquidity zones, and consolidation ranges.
- Traders use it to forecast false breakouts, liquidity sweeps, and genuine momentum shifts.
- For higher accuracy, combine this pattern with volume flow, ATR, EMA, and Fair Value Gaps (FVG).
- While effective on all timeframes, it produces the most reliable signals on the H1 and H4 charts.
1. What Is the 80 20 Pattern in Trading?
The 80-20 pattern is a statistical mean reversion strategy designed to identify price exhaustion and trap liquidity at the extremes of a trading range. While widely used by modern price action traders, this rule was originally codified by Linda Raschke and Larry Connors in their seminal book, ‘Street Smarts: High Probability Short-Term Trading Strategies’. It operates on the principle that when the market opens near its daily high or low, there is an 80% probability of a reversal back toward the mean.
The core rule states that 80% of attempts to break out of a consolidation range will fail, causing the price to reverse. Only 20% of breakouts will succeed in triggering a new trend. Instead of blindly chasing every breakout, professional traders use this statistical edge to trade the high-probability reversal.
1.1. Why the 80/20 Pattern Works (Market Mechanics)
Understanding what the pattern is means nothing if you don’t understand why it consistently happens. This setup is highly reliable because it exploits the mechanical nature of order flow and the predictable behavior of retail traders:
- The Overshoot and Revert: Markets rarely move in a perfectly straight line. When price rapidly approaches a key support or resistance boundary, it tends to “overshoot” fair value due to sudden momentum. Once that temporary energy is spent, the price inevitably snaps back (mean reversion) into the established range.
- The 80% Exhaustion: By the time a strong directional move has completed 80% of its push toward a breakout level, the participants who started the move are already exhausted. They begin taking profits, starving the trend of its underlying buying or selling pressure.
- The 20% Liquidity Grab: That final 20% of the price push is often an engineered illusion. Smart money pushes the price just past the boundary to sweep liquidity (stop-losses) resting above highs or below lows. This creates the “false breakout” spike.
- The Retail Trap: This is where the trap snaps shut. Retail traders typically suffer from FOMO (Fear Of Missing Out) and enter the market late, precisely during that final 20% extension. They buy the breakout just as institutions are selling into them, providing the exact exit liquidity the smart money needs to reverse the market.
2. How the 80/20 Rule Works in Market Structure
The 80/20 rule works by identifying the psychological tipping points in market structure. It relies on three core mechanisms: the tendency of price to reverse at range boundaries, the institutional need to sweep liquidity (false breakouts), and the cycle of compression versus expansion.
2.1. Price Behavior Near Range Boundaries
Markets spend a significant amount of time consolidating. When the price approaches the upper or lower boundary of a range, it enters a critical decision zone. Proper analysis of this zone is key. If the breakout attempt is weak (characterized by low volume or small candles), the 80/20 rule suggests the price will likely reject the boundary and return to the middle of the range.
2.2. False Breakouts and Liquidity Sweeps
Smart money often pushes price just outside a range to trigger stop losses from retail traders. This is known as a “liquidity sweep.” The 80 20 pattern helps you spot these traps. If price breaks a high but immediately falls back inside, it confirms that the breakout was a trap to gather liquidity.
2.3. Compression vs. Expansion
It is important to remember the “20%” part of the rule. While 80% of breakouts fail, the remaining 20% are powerful trend starters. These usually happen after a period of compression, where the price coils tightly.
This build-up of energy is one of the main causes of the explosive move that follows. Identifying the difference between a “loose” range (likely to reverse) and a “tight” coil (likely to break out) is key to finding real price movements.
3. What Are the Types of 80/20 (Pareto principle) Scenarios?
Traders will typically encounter three main scenarios when analyzing this pattern. Identifying which scenario is playing out allows you to predict the likely outcomes, whether the price will reverse or continue trending.
Here is a quick comparison of the three types:
| Pattern Type | Market Bias | What Happens |
|---|---|---|
| Breakdown Failure | Bullish (Buy) | Price breaks a low, fails, and reverses up. |
| Breakout Failure | Bearish (Sell) | Price breaks a high, fails, and reverses down. |
| Continuation | Momentum (Follow) | Price breaks with volume and stays outside the range. |
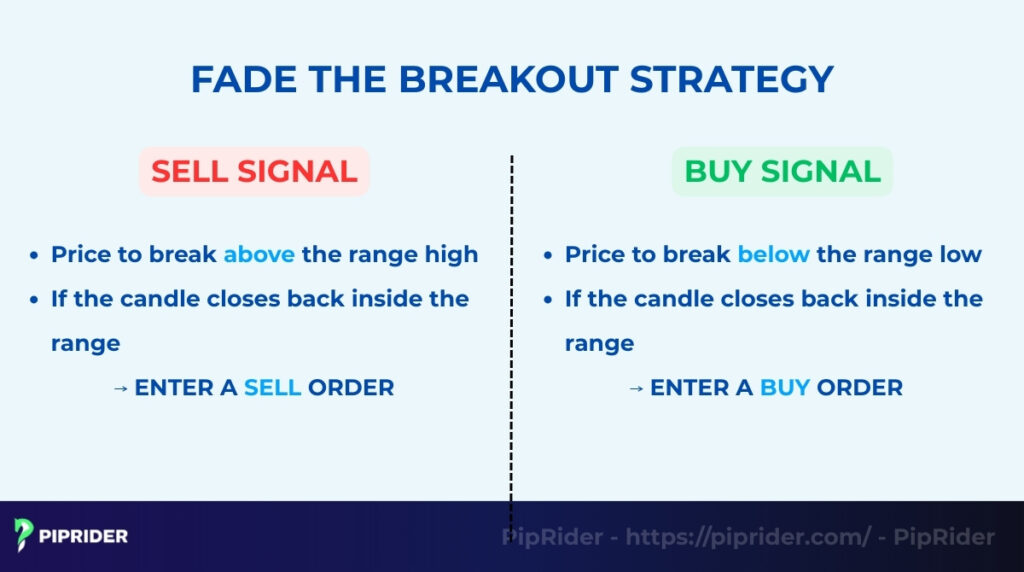
3.1. What Is a Breakdown Failure (Bullish Setup)?
A breakdown failure is a bullish reversal pattern that occurs when sellers attempt to push the price below a key support level or the previous day’s low.
Signal: The price dips below the low but cannot maintain the downward momentum. Instead of dropping further, it quickly reverses up and closes back inside the previous trading range. This indicates that sellers are exhausted and buyers are taking over.
3.2. What Is a Breakout Failure (Bearish Setup)?
A breakout failure is a bearish reversal pattern where buyers manage to push the price above a resistance level or the previous day’s high.
Signal: The price breaks the high but is immediately rejected. It closes back down inside the range, often leaving a long wick at the top. This “fakeout” suggests the bulls are weak, and a move back to the bottom of the range is likely.
3.3. What Is the 80/20 Continuation Pattern?
The continuation pattern is the rare (20% probability) scenario where the breakout is legitimate.
Signal: The price breaks the range boundary with a massive candle and high volume, and crucially, it does not return to the range. This signals a momentum shift, meaning the market has moved from a consolidation phase to a trending phase.
4. How to Identify the 80 20 Pattern (Step-by-Step)
Identifying this setup requires patience and a strict rule-based approach. You are not looking for random bounces; you are looking for a specific sequence of exhaustion and entrapment. Follow these five steps to find valid high-probability signals.
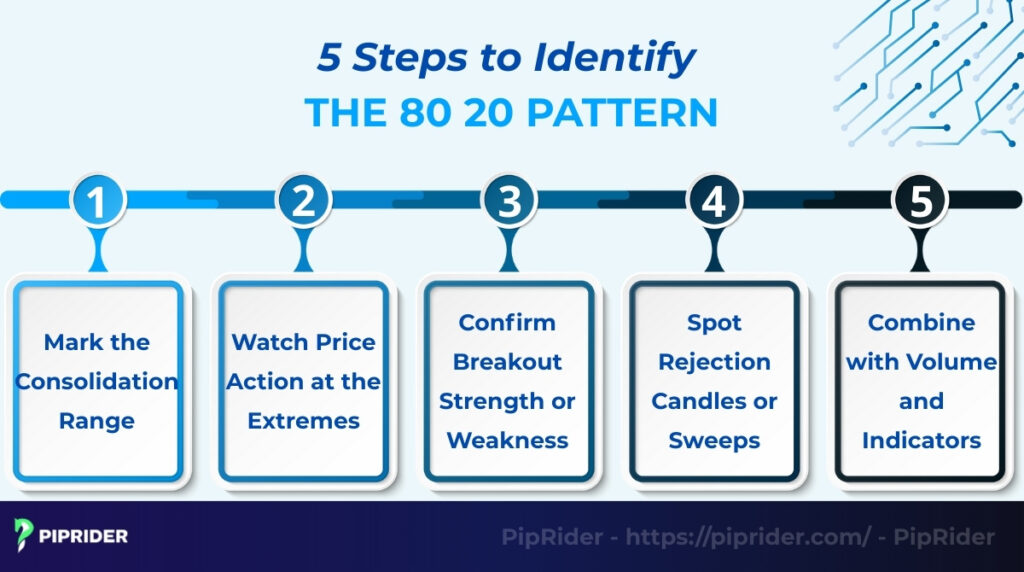
4.1. Step 1: Define the Consolidation Range and Extremes
Start by scanning for a market that is moving sideways rather than trending. You need to establish the battlefield.
- The Boundaries: Look for at least two clear touches at the top (Resistance) and two at the bottom (Support). Draw horizontal lines across these points.
- The Zones: Mentally divide this box. The middle 60% is the “chop zone” where random noise destroys accounts. Your focus must be exclusively on the top 20% and bottom 20%—the extreme zones where liquidity rests.
4.2. Step 2: Observe the “FOMO” Directional Move
A slow, lazy crawl toward the boundary rarely creates a good 80/20 setup. You need to see an impulsive, aggressive price leg pushing toward one of your extreme zones.
The Trap Logic: This aggressive momentum is necessary because it creates FOMO (Fear Of Missing Out). It convinces retail breakout traders that a massive trend is starting, tricking them into buying the top or selling the bottom right before the trap is set.
4.3. Step 3: Spot the Exhaustion at the Boundary
As the aggressive price leg hits the boundary, you must look for immediate signs of fatigue. The “smart money” is no longer pushing the price.
- Visual Cues: Look for the candle bodies shrinking as they touch the line.
- Indicator Cues: Watch for trading volume drying up on the push, or momentum oscillators (like the RSI) printing bearish/bullish divergence. This indicates the move is running out of fuel.
4.4. Step 4: Identify the Reversal Signal (The Sweep)
Do not enter a trade just because the price touched the boundary. You must see a specific rejection pattern confirming that liquidity has been swept.
- The Sweep: The price briefly pierces the boundary line, intentionally triggering the stop-losses of range traders and the entry orders of breakout traders.
- The Rejection: Almost immediately, the price snaps back violently, leaving a long wick sticking out of the range. Classic candlestick patterns here include Pin Bars, Shooting Stars, or Hammers.
4.5. Step 5: Wait for the Confirmation Close
This is where impatient traders lose money. The pattern is only mathematically valid when the trap officially snaps shut.
The Lock-in Rule: Never enter a trade while the breakout candle is still open. You must wait for that specific timeframe’s candle to definitively close back inside the established range. This close confirms that the breakout attempt has failed and the reversal is underway.
The 80/20 Pattern Checklist: Is the Setup Valid?
Before fading a breakout, ensure your chart meets these 5 strict criteria to avoid stepping in front of a real trend:
- [ ] Strong Directional Move: An impulsive price leg aggressively pushes toward the range boundary.
- [ ] Exhaustion Signal: Momentum fades exactly at the boundary (e.g., shrinking candles or declining volume).
- [ ] Extreme Zone Reached: The price taps or slightly pierces the top/bottom 20% of the consolidation area.
- [ ] Reversal Signal Appears: A clear rejection forms (e.g., a long-wick liquidity sweep or pin bar).
- [ ] Confirmation Candle: The subsequent candle closes decisively back inside the range, trapping the breakout buyers/sellers.
5. How Do You Trade the 80/20 Pattern?
Trading the 80-20 pattern is not about guessing market direction; it is about reacting to trapped liquidity with strict mechanical rules. Because this pattern deals with both failed breakouts (the 80%) and genuine momentum shifts (the 20%), professional traders use two distinct playbooks to capitalize on the price action.
5.1. Strategy 1: The Reversal Setup (Fade the Breakout)
This is the core setup that fades the initial breakout attempt. It capitalizes on the statistical edge that 80% of breakouts from a consolidation range are simply liquidity grabs engineered by smart money.
- Best for: Mean reversion traders who excel at identifying exhaustion and trading range-bound market conditions.
- Entry: Execute your trade strictly after the confirmation candle closes decisively back inside the established 80% range boundary. Do not front-run the market; the close is the only signal that the “trap” has officially snapped shut.
- Confirmation: Look for a prominent rejection wick extending outside the range (indicating a liquidity sweep). For higher accuracy, zoom into a lower timeframe (M5/M15) to spot a Change of Character (CHoCH) immediately after the sweep.
- Stop-loss: Place your stop-loss 5-10 pips beyond the extreme tip of the rejection wick.
- Pro Tip: Always adjust your SL buffer based on the current ATR (Average True Range). In high-volatility environments (like news events), a wider buffer is required to avoid being “wicked out” by secondary stop-runs.
- Target (Take Profit): Aim for a return to the mean. Your primary target should be the 50% midline of the range. If momentum remains strong, leave a “runner” to target the opposite 80% boundary.
- Avoid when: A strong trend continues with expanding volume and large full-bodied candles (Marubozu) closing outside the range. Never fade a breakout backed by massive institutional momentum.
5.2. Strategy 2: The Continuation Trap Setup (The 20% Scenario)
What happens when the 80% rule fails, or when a fake reversal itself traps the early sellers? This strategy catches the rare 20% scenario where the market resumes its breakout, punishing those who faded the move too early.
- Best for: Advanced traders who have the mental flexibility to quickly flip their directional bias when the initial reversal setup fails.
- Entry: Enter the market in the direction of the original breakout once the “fake reversal” is invalidated. This occurs when price fails to reach the 50% midline and aggressively pushes back past the initial breakout high/low.
- Confirmation: You need to see an Institutional Volume Spike. Wait for a strong candle to close completely outside the range, indicating that the liquidity hunt is over and the real trend has begun.
- Stop-loss: Place your stop-loss securely below the failed reversal zone (the recent swing point inside the range). This protects your capital from erratic whipsaws during the transition from range to trend.
- Target: Aim for trend continuation. Since the “trapped” counter-trend traders will be forced to cover their positions, the move is often explosive. Use a trailing stop (e.g., 20 EMA) to capture the full extension of the new trend.
6. Which Indicators Best Confirm the 80-20 Pattern?
While the 80-20 pattern is a pure price action concept, using technical indicators provides the necessary “confluence” to filter out low-quality setups. These tools act as a quality control system, helping you distinguish between a genuine trend expansion and a liquidity trap.
6.1. Volume & OBV: The Ultimate Lie Detector
Volume reveals the conviction behind a price move. In an 80-20 setup, volume is your most reliable confirmation tool.
- The Signal: Look for low or decreasing volume as price breaks the range boundary. This indicates retail-driven exhaustion rather than institutional participation.
- OBV (On-Balance Volume): If the price makes a new high outside the range but OBV fails to follow, you have a “Volume Divergence,” confirming the 80% probability of a reversal.
6.2. Bollinger Bands: Identifying the “Extreme” Zone
The 80-20 rule is built on the idea that price has pushed too far (the outer 20%). Bollinger Bands are mathematically designed to capture these extremes.
- The Signal: A high-probability 80-20 trade occurs when a candle pierces the Upper or Lower Bollinger Band but immediately closes back inside the band and the previous range boundary.
- Context: This suggests a “mean reversion” is imminent as the price was statistically overextended.
6.3. RSI & Stochastic: Spotting Momentum Divergence
Oscillators are perfect for 80-20 trading because they identify when momentum is slowing down despite price making a new (fake) high/low.
- The Signal: Look for Bearish/Bullish Divergence. If the price sweeps the range high but the RSI makes a lower high, the momentum is failing.
- Confirmation: The “trap” is confirmed when the oscillator crosses back from overbought (>70) or oversold (<30) levels.
6.4. ATR (Average True Range): The Exhaustion Gauge
ATR helps you determine if the market has “run out of gas” for the day.
The Signal: If the price reaches the range boundary and the move has already covered more than 100% of its Daily ATR, the probability of a successful breakout is extremely low. This is the prime environment for an 80-20 reversal.
6.5. Moving Averages & VWAP: The Magnet Targets
Once the 80-20 reversal is confirmed, you need to know where the price is headed.
The Targets: The 20 EMA or VWAP (Volume Weighted Average Price) act as magnets. In an 80-20 setup, the first major target is always a return to the mean (the 20 EMA/VWAP), which often aligns with the 50% midline of the range.
7. Real Chart Examples (Case Studies)
Seeing the pattern in theory is one thing, but executing it in real market conditions requires discipline. Professional traders backtest specific historical events to understand market mechanics. Here are two highly verifiable, real-world case studies showing exactly how the 80-20 pattern trapped retail traders (Historical chart data sourced from TradingView).
7.1. Case Study 1: 80-20 Pattern on EUR/USD (July 2023 Bull Trap)
This is a classic textbook setup where the 80% probability rule trapped impatient buyers at a major macroeconomic resistance level.
- Context: A strong bullish move dominated the market in mid-July 2023, driven by a weakening US Dollar. Retail traders were aggressively buying the breakout.
- Setup: The price reaches the extreme upper boundary, breaking above the psychological 1.1200 resistance level on July 18, 2023.
- Signal: A clear rejection candle (a daily bearish pin bar) forms. The price temporarily pierced 1.1270 to sweep buy-side liquidity but failed to hold, closing back below the 1.1200 boundary.
- Entry: Sell after confirmation is executed the moment the daily candle definitively closes back inside the range, confirming the false breakout.
- Stop: Placed safely above the high of the rejection wick (around 1.1280) to protect against secondary stop-hunts.
- Target: The previous structure support (the 1.0800 to 1.0900 zone), aiming for a deep retracement.
- Lesson: Avoid early entry. Traders who bought the breakout above 1.1200 without waiting for the daily candle to close provided the exact exit liquidity institutional sellers needed to reverse the market into a massive multi-month downtrend.
7.2. Case Study 2: 80-20 Pattern on NAS100 (October 2022 Bear Trap)
Indices like the Nasdaq 100 are notorious for volatile stop-hunts during major news events. This case study demonstrates how to fade a panic breakdown during a CPI release.
- Context: A sharp bearish sell-off occurs pre-market on October 13, 2022, following a hot US CPI inflation report, driving extreme panic.
- Setup: The price reaches the extreme lower boundary, crashing below the critical 10,500 major support zone.
- Signal: A massive bullish rejection candle emerges. The index swept the sell-side liquidity (stop-losses) down to 10,440 before violently snapping back up by the end of the day.
- Entry: Buy after confirmation is triggered once the daily candle closes firmly green and back inside the support zone (above 10,500), confirming the breakdown was a trap.
- Stop: Placed securely below the extreme low of the trap zone (under the 10,440 wick).
- Target: The 50% midline for partial profits, with the final target at the opposing previous structure (Resistance around 11,500).
- Lesson: Wait for the trap to spring. Retail traders who aggressively shorted the CPI breakdown were trapped at the exact bottom of the 2022 bear market. Recognizing the exhaustion signal at the extreme zone allowed smart traders to ride the massive reversal.
8. When NOT to Trade the 80-20 Pattern (Why It Fails)
Knowing when to stay out of the market is just as important as knowing when to enter. The 80-20 pattern relies heavily on mean reversion and the presence of trapped liquidity. If you try to force this setup in the wrong environment, the pattern will fail, and your stop-loss will become the exit liquidity for institutional traders.
Here are the four specific market conditions where you must avoid trading this reversal pattern:
- The Trend is Too Strong (Runaway Momentum): If the price breaks the range boundary with massive, full-bodied candles and expanding volume, do not attempt to fade it. This indicates genuine institutional momentum (the 20% continuation scenario). Standing in front of a runaway trend to catch a reversal is highly dangerous.
- No Clear Confirmation (Premature Entry): Merely touching or slightly piercing a support/resistance line is not a valid entry signal. If the candle does not leave a clear rejection wick and definitively close back inside the range, the trap has not snapped shut. Entering early without this structural confirmation is gambling, not trading.
- Low Liquidity Environments (Choppy Markets): The 80-20 reversal requires trapped retail traders to fuel the price swing back to the opposite side of the range. In low-volume or “choppy” markets (such as late Friday afternoons or bank holidays), price action becomes erratic. While the breakout might fail, the reversal will also lack the momentum needed to hit your take-profit targets.
- High-Impact News Events (Macro Volatility): During major macroeconomic releases (like CPI, NFP, or FOMC rate decisions), traditional technical boundaries are routinely ignored. High-frequency trading algorithms will hunt liquidity aggressively in both directions, creating massive whipsaws that will trigger your stop-loss regardless of how perfectly you placed it.
9. Who Should Use This Pattern?
The 80-20 pattern requires discipline, emotional control, and an understanding of order flow. Because “fading” a breakout goes against the natural human instinct of following momentum, traders must approach this strategy based on their exact experience level.
Should Beginners Use the 80-20 Pattern? The short answer is no—at least not with real capital. Here is the exact roadmap for how different traders should utilize this setup:
- Beginner (Observation Only): Novice traders should strictly observe. Beginners often struggle with FOMO and lack the patience to wait for the confirmation candle to close. If you are new, do not trade this live. Instead, mark out consolidation ranges on your chart, watch how price reacts at the extreme boundaries, and study how liquidity traps are engineered by smart money.
- Intermediate (Trade the Reversal): Traders who have mastered basic risk management and emotional discipline should focus strictly on the Reversal Setup. Waiting for the exhaustion sweep and trading the 80% probability back into the range provides a highly structured, rule-based edge with clearly defined stop-losses.
- Advanced (Trade the Trap): Veteran traders have the psychological fortitude to exploit the Continuation Trap Setup. Catching the rare 20% momentum breakout requires extreme mental flexibility—the ability to instantly flip your directional bias, admit the initial reversal failed, and aggressively enter a momentum trade in the direction of the true breakout.
10. 80-20 Pattern vs. Other Trading Setups
To build a versatile trading system, you must distinguish the 80-20 pattern from other common price action setups. While they may appear similar on a chart, their underlying mechanics, intent, and execution goals are fundamentally different.
The following table provides a quick reference to help you identify which strategy to deploy based on the market environment:
| Pattern | Type | Market Context | Primary Use |
|---|---|---|---|
| 80-20 Pattern | Mean Reversion | Ranging / Exhausted | Reversal (Statistical) |
| Breakout | Momentum | Volatility Expansion | Continuation |
| False Breakout | Trap | Range Boundaries | Reversal (General) |
| Pullback | Trend Following | Strong Trending | Continuation |
| Liquidity Sweep | Trap (SMC) | Extreme Highs/Lows | Reversal (Institutional) |
| Order Block | Institutional Zone | Supply / Demand Levels | Point of Interest (POI) |
Deep Dive: Decoding the Relationships
Many traders get confused because different methodologies use different names for the same price behavior. The 80-20 pattern acts as the statistical bridge that connects the original work of Linda Raschke with modern institutional concepts:
- 80-20 vs. Order Blocks (The Location): This is about cause and effect. Price often respects the 80-20 rule at range edges because it has hit an Order Block—a concentration of institutional limit orders. The order block acts as the “concrete wall” that triggers the 80-20 reversal on your chart.
- 80-20 vs. False Breakout (The Action): Fundamentally, they are the same. However, a “false breakout” is a random observation, while the 80-20 rule (Raschke & Connors, 1995) quantifies it. It turns a chart event into a probability-based strategy, reminding you that 80% of these attempts are likely to fail.
- 80-20 vs. ICT Liquidity Grab (The Intent): The 80-20 rule describes what happens (price reverses), while the concept of a “Liquidity Grab”—popularized by Michael J. Huddleston (The Inner Circle Trader – ICT)—explains why it happens. Smart money pushes price past boundaries specifically to hunt retail stop-losses. An 80-20 trader sees a reversal; an ICT trader sees institutions “fueling up” their positions.
11. What Are Common Mistakes When Trading the 80/20 Pattern?
Even with a statistical edge, traders often lose money by misidentifying the setup or managing risk poorly. Avoiding these specific traps through better prioritization of high-quality setups is just as important as finding the pattern.
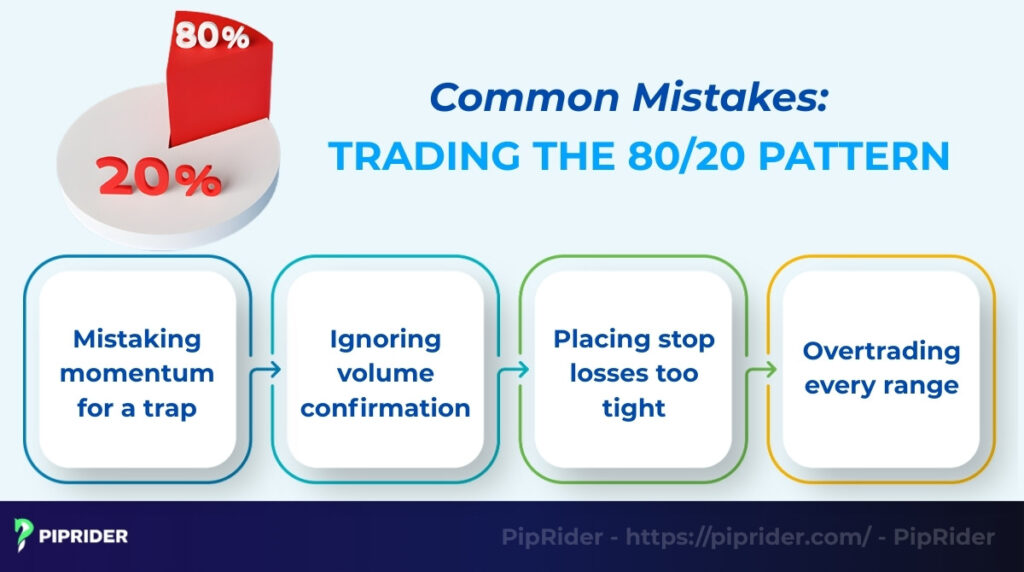
- Mistaking momentum for a trap: Not every breakout fails. A common error is trying to “fade” (bet against) a breakout that has massive momentum and huge candles. If the price closes far outside the range with strength, do not stand in front of it. Fighting this momentum is one of the leading causes of trading losses.
- Ignoring volume confirmation: Volume acts as the ultimate “lie detector.” Attempting to trade an 80/20 reversal without checking volume is risky. Remember: low volume suggests a trap; high volume suggests a real breakout.
- Placing stop losses too tight: Since this pattern relies on volatility and “stop hunts,” placing your stop loss exactly at the range edge is a mistake. You must give the trade “breathing room” (using ATR or the wick tail) to avoid being swept out just before the reversal happens.
- Overtrading every range: Not every consolidation creates a valid 80/20 setup. Beginners often force trades in messy, undefined ranges. You should only trade when the range boundaries are clear and the rejection signal is obvious.
12. What Tools Can Help You Detect the 80/20 Pattern?
Manually drawing ranges on every chart can be time-consuming. Fortunately, modern trading platforms offer specific tools and scanners to automate this efficiency process.
- TradingView range scripts: The TradingView community library offers thousands of free Pine Script indicators. You can search for “Range Detector” or “Previous Day High/Low” to automatically plot the boundaries where the 80/20 pattern is most likely to occur.
- MT4 range indicators: For MetaTrader 4 users, custom indicators like “High-Low Boxes” or “Session Breakout” tools are essential. These visually highlight the consolidation zones on your chart, allowing you to spot the 20% extremes instantly.
- TrendSpider consolidation scanner: This AI-powered platform allows you to scan the entire market for “Tight Consolidations” or “Squeezes.” It finds stocks that are currently coiling, alerting you before the breakout or reversal happens so you don’t have to watch the screen all day.
13. Frequently asked questions about the 80/20 Pattern Trading
Traders often ask about the reliability of this pattern across different markets and timeframes. Here are the answers to the most common questions.
14. Conclusion
The 80 20 pattern states that 80% of breakout attempts statistically fail in a consolidation or trading range. Its primary purpose is to shift a trader’s focus from chasing price to patiently waiting for a reversal entry after the initial failure.
However, no pattern is perfect. To achieve the best outcomes, you should always combine the 80/20 rule with volume analysis, ATR, and EMA confirmation. Identify the vital few setups that meet all your criteria, and ignore the rest. Ready to master more price action secrets? Explore the expert trading guides and trading strategies at Piprider today.


