Learning how to trade fair value gaps (FVG) involves identifying a specific 3-candle imbalance where the price moved too quickly. This price action leaves a “Fair Value Gap” (FVG). The core trading strategy is to wait for the price to retrace into this FVG, using that zone (especially the 50% level) as a high-probability entry to rejoin the original trend.
This guide details the step-by-step rules for identifying and trading Fair Value Gaps (FVGs). It shows traders where to set their entry, stop-loss, and take-profit, and how to filter out bad signals by combining FVGs with market structure.
Key Takeaways
- A Fair Value Gap (FVG) is a 3-candle pattern that signals a price imbalance or inefficiency.
- FVGs act as “magnets,” attracting price back to “fill” the gap (a core Smart Money Concept).
- The main strategy is to wait for the price to retrace into the FVG and use it as an optimal entry point.
- Crucial: An FVG is only a reliable signal when it aligns with the current trend.
- A complete FVG trade requires clear Entry (e.g., 50% fill), Stop-Loss, and good risk management rules.
1. What Is a Fair Value Gap (FVG)?
A Fair Value Gap (FVG) is a specific three-candle pattern that highlights a price imbalance between buyers and sellers on a chart. It occurs when the price moves very quickly and aggressively in one direction, causing aggressive displacement that leaves inefficient pricing in the market.
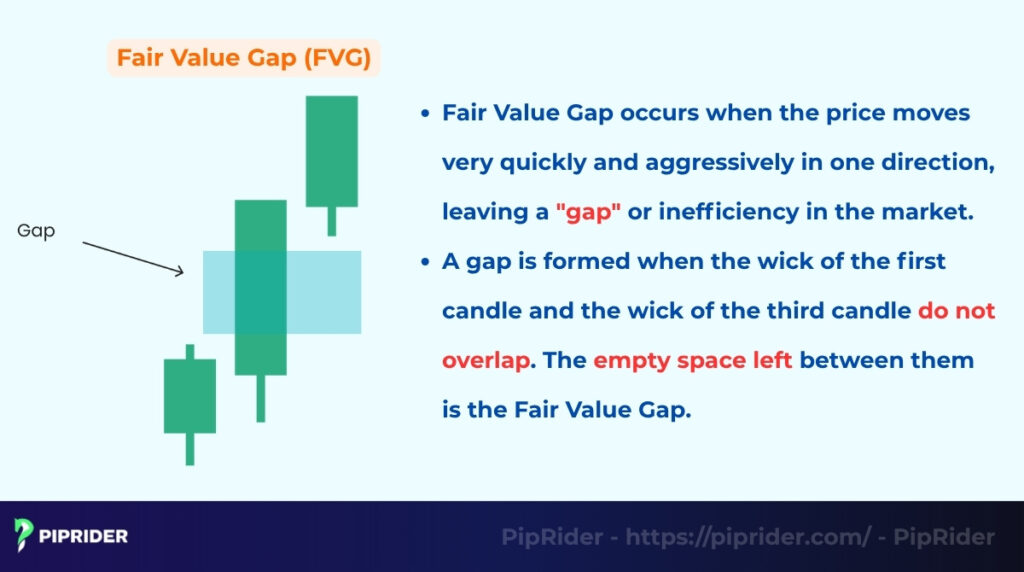
You can visually identify this imbalance by looking at the wicks of the three candles. A gap is formed when the wick of the first candle and the wick of the third candle do not overlap (Alchemy Markets, n.d.). The empty space left between them is the Fair Value Gap.
A related concept is the Inverse Fair Value Gap (IFVG). An IFVG occurs when an FVG fails to hold price and is aggressively broken. Once broken, the old imbalance “flips” its role, acting as new support or resistance for the opposite move. This signals a significant shift in market momentum.
Within the Smart Money Concepts (SMC) methodology, a framework heavily popularized by Michael J. Huddleston (Inner Circle Trader, or ICT), an FVG represents a structural “imbalance” or “inefficiency.” Traders using this theory monitor the FVG as a prime retracement zone, anticipating that the market algorithms will return to mitigate the imbalance before continuing in its original direction.
2. What Is the Structure of a Fair Value Gap?
The structure of an FVG is always identified using a three-candle formation. It’s the specific alignment of these three candles that reveals the imbalance.
2.1. The Three-Candle Formation
A Fair Value Gap is formed by the price action of three consecutive candles:
- Candle 1: The starting candle that provides the first boundary (High or Low).
- Candle 2: The strong displacement candle that moves aggressively, creating the gap.
- Candle 3: The follow-through candle that provides the second boundary.
The gap itself is the space between the high of Candle 1 and the low of Candle 3 (in a bullish FVG) or the low of Candle 1 and the high of Candle 3 (in a bearish FVG).
2.2. A Simple Example
Imagine a market with a strong bullish bias. The price suddenly undergoes aggressive displacement to the upside, creating a technical imbalance (the FVG).
The core concept is that the market rarely moves in a straight line forever. It will often pull back, or retrace, to mitigate or rebalance a portion of that Fair Value Gap. This process allows the market to “collect” liquidity before resuming its original upward trend. For a trader, this mitigation zone, specifically the area where the price returns to test the gap, serves as an optimal entry point to rejoin the dominant momentum.
2.3. Bullish vs. Bearish Fair Value Gaps
FVGs are categorized as bullish or bearish, indicating the direction of the imbalance and the potential trade.
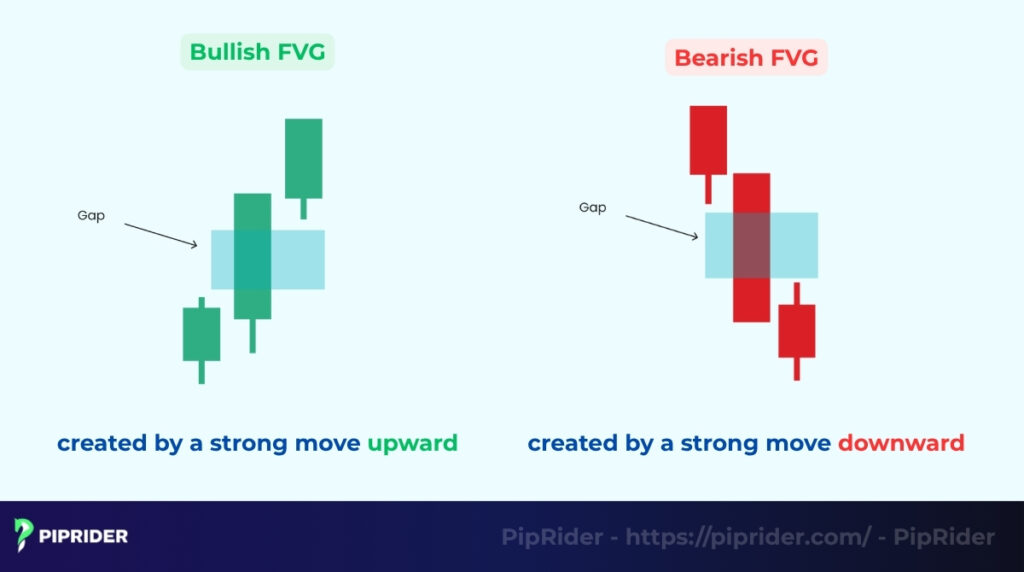
- Bullish FVG (A Buy Zone): This bullish gap is created by a strong move upward. It leaves a gap that traders watch as a potential retracement zone to buy. The market often dips back down to “fill” this imbalance before continuing higher.
- Bearish FVG (A Sell Zone): This bearish gap is created by a strong move downward. It leaves a gap that traders watch as a potential retracement zone to sell. The market often rallies back up to “fill” this imbalance before continuing lower.
2.4. FVG vs. Traditional Gaps (Mitigation vs. Fill)
It is crucial to understand that an FVG is a technical imbalance (non-overlap between wicks), not a literal “blank space” on the chart. Unlike traditional gaps in the stock market, where no trading occurs due to weekend closes or news, trading in an FVG did happen, but it was too aggressive to allow for balanced pricing.
In SMC terminology, when the market returns to an FVG, it is called “Mitigation.” This process balances the price inefficiency. A “full fill” (covering 100% of the gap) is a common misconception and is not always required.
Often, a partial mitigation, such as a simple wick touch of the zone boundary or a 50% Equilibrium tap, is all the market needs before continuing its aggressive displacement. Recognizing this prevents you from missing high-probability entries while waiting for a “perfect” 100% fill.
3. Why Do Fair Value Gaps Matter?
Fair Value Gaps are a critical concept because they highlight areas of inefficient pricing caused by aggressive market displacement. In SMC theory, these gaps act as a roadmap, showing where the price is likely to revisit to re-balance the market.
Traders use FVGs to:
- Identify “liquidity voids”: A Fair Value Gap represents a “void” or “vacuum” in liquidity. Mastering the process of identifying liquidity in trading allows you to see where price is most likely to be drawn next.
- Track aggressive displacement: To understand this displacement, consider that the global foreign exchange market processes over $9.6 trillion in daily trading volume (Bank for International Settlements, 2025). When major institutions execute massive orders in this highly liquid environment, their sheer volume can temporarily outpace available counterparties at a specific price level, leaving pricing inefficient. SMC traders theorize that price is drawn back to this zone to re-balance the market before the main trend continues.
- Pinpoint precise entries: Instead of chasing a fast-moving price, traders can patiently wait for the price to retrace into the FVG. This often provides a much safer, lower-risk entry point.
- Determine take-profit targets: If you are in a trade heading toward an old FVG, that gap can act as a magnet. The “gap fill” area often serves as a logical place to take profits.
- Establish confluence: Fair Value Gap becomes an even stronger signal when it lines up with other technical tools. An FVG that forms inside a major demand zone or right next to forex order blocks is considered an A-grade setup.
4. Phase 1: How to Identify Fair Value Gaps (The 4-Step Process)
Identifying a Fair Value Gap is a mechanical, four-step process. It requires a disciplined eye to distinguish between normal price action and true market inefficiency. By following these steps, you ensure that you are only mapping zones with the strongest potential for significant market displacement.
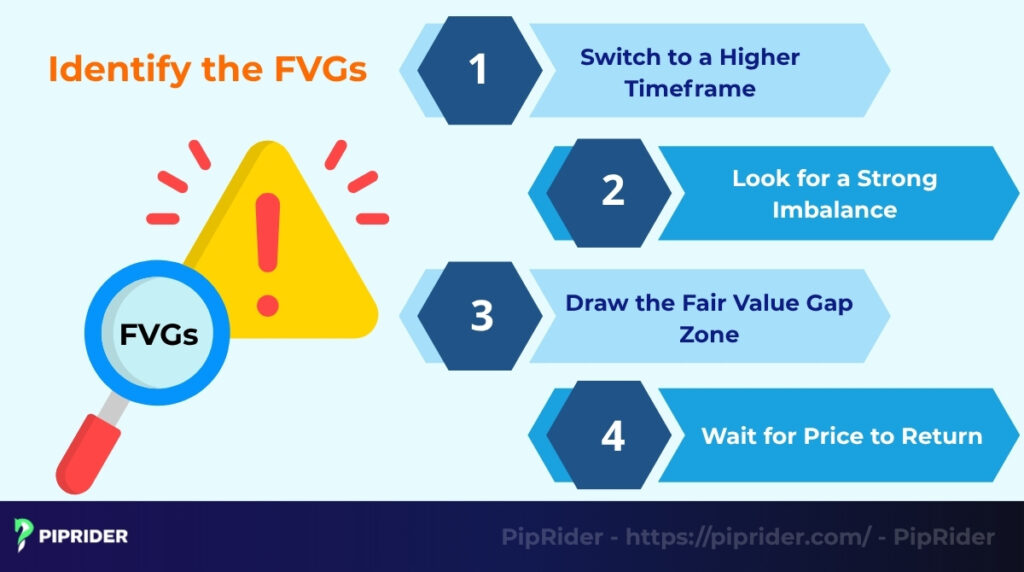
4.1. Step 1: Switch to a Higher Timeframe (HTF)
While FVGs appear on all charts, the most reliable “magnets” are found on higher timeframes. Traders typically prioritize the 1-Hour (H1), 4-Hour (H4), and Daily (D1) charts. Identifying zones on these timeframes filters out “market noise” and highlights the primary displacement where the market bias is most authoritative.
4.2. Step 2: Spot the Aggressive Displacement
Search for a powerful, fast move characterized by long-bodied candles (displacement candles). This indicates a period where the market moved so aggressively in one direction that “two-way trading” was bypassed, leaving a technical void. This is the hallmark of an imbalance that the market will eventually seek to rebalance.
4.3. Step 3: Draw the FVG Zone Mechanically
The FVG is the specific “empty space” between three consecutive candles. The key is the non-overlap between the first and third candle’s wicks.
- Bullish FVG (Buy Zone): Draw the zone from the High of Candle 1 to the Low of Candle 3. The gap exists because Candle 2 moved up too fast for the wicks of 1 and 3 to meet.
- Bearish FVG (Sell Zone): Draw the zone from the Low of Candle 1 to the High of Candle 3. The gap exists because Candle 2 dropped too fast for the wicks of 1 and 3 to meet.
4.4. Step 4: Wait for Mitigation (The Return)
Identifying the gap is only half the battle; the setup is not active until the price retraces into the zone. Professional traders focus on the 50% Equilibrium level (the “consequent encroachment”) of the FVG. While a simple touch of the boundary can be enough (partial mitigation), a return to the 50% level often provides a higher-probability entry with a better Risk/Reward ratio.
5. Phase 2: How to Trade Fair Value Gaps (The Execution)
Trading Fair Value Gaps involves identifying the main trend and finding a Fair Value Gap that moves with that trend. This trading strategy requires waiting for a retracement into the FVG, and then setting a clear entry, stop-loss order, and take-profit. Here are 5 steps that instruct you on how to trade Fair Value Gaps effectively.
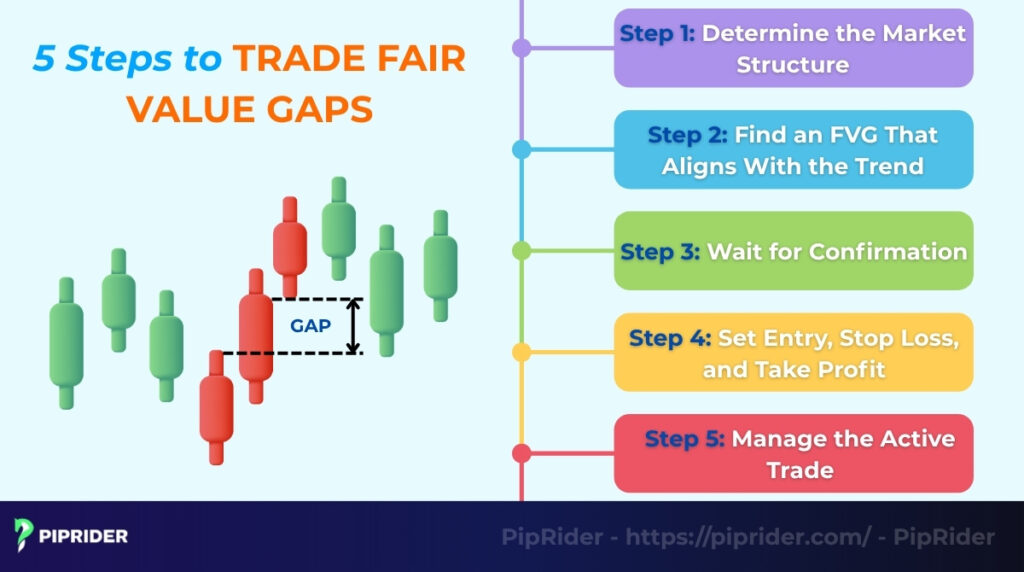
5.1. Step 1: Determine the Market Structure
This is your primary filter. An FVG is only a reliable signal if it respects the current market bias. Before identifying a gap, you must establish the dominant Higher Timeframe (HTF) trend. Is the market bullish (making Higher Highs and Higher Lows) or bearish (Lower Lows and Lower Highs)? Trading without a clear structural bias significantly increases the risk of being caught in a trap.
5.2. Step 2: Find an FVG That Aligns With the Trend
Filter your signals to match the HTF bias. In a bullish market, focus exclusively on Bullish FVGs located in “discount zones” (areas below the 50% equilibrium of the recent swing) for buy opportunities. Conversely, in a bearish market, seek Bearish FVGs in “premium zones” as high-priority sell areas. Aligning with the trend ensures you are trading alongside the dominant order flow.
5.3. Step 3: Wait for Confirmation
Avoid entering a trade blindly just because the price touches the FVG zone. Waiting for confirmation ensures the retracement has likely ended and the aggressive displacement is resuming. The most robust setups include:
- Candlestick Patterns: A clear pin bar, engulfing candle, or strong rejection wick forming within the FVG boundaries.
- Lower Timeframe Shift: A Market Structure Shift (MSS) or Change of Character (CHoCH) on a lower timeframe (e.g., M5 or M15) to confirm the reversal.
- Confluence: The signal is strongest when the FVG overlaps with a high-priority Order Block or appears immediately after a Liquidity Sweep.
5.4. Step 4: Set Entry, Stop-Loss, and Take-Profit
Executing an FVG trade requires strict, pre-defined parameters. To remove emotional guesswork, you must define your exact entry, a buffered stop-loss, and a logical take-profit target before entering the market.
- Entry: You can enter as soon as the price taps the Fair Value Gap or wait for a deeper fill to the 50% “Equilibrium” level. Alternatively, enter after your confirmation signal (like the close of an engulfing candle).
- Stop-Loss (with Buffer): The stop-loss is placed at the logical invalidation point. For a bullish setup, set it below the FVG’s low, but you must add a small buffer (e.g., factoring in the pair’s spread plus a fractional Average True Range – ATR value) to survive normal market noise. For a bearish setup, add this same buffer above the FVG’s high. Placing it exactly on the technical line is a recipe for premature stop-outs.
- Take-Profit: The logical target is the next pool of liquidity. This is typically the next major swing high or low, or another significant, unfilled Fair Value Gap.
- Trade Invalidation Rule: A setup is officially invalidated if a candle firmly closes below a Bullish FVG or above a Bearish FVG. While a wick piercing the zone is acceptable (and often just a liquidity sweep), a solid body close on the opposite side of the zone signals that the imbalance has failed to hold price. This is your immediate signal to accept the loss and move on; never “hold and hope” it reverses.
5.5. Step 5: Manage the Active Trade
Once the trade is active and moving in your favor, you can manage your risk. Good risk management is key. A common technique is to move your stop-loss order to your entry price (break-even) once the trade has moved significantly in your favor. Many traders also scale out (take partial profits) at key structure levels on the way to the final take-profit target.
5.6. The 2 Standard FVG Setup Cards
To simplify your execution, here are the two most reliable FVG setups used by professional SMC traders. You can treat these as your daily trading flashcards.
Setup 1: The Trend Continuation FVG
- Condition: The Higher Timeframe (HTF) structure is clearly bullish (Higher Highs/Lows) or bearish (Lower Lows/Highs).
- Entry: Limit order at the 50% equilibrium level of the FVG zone.
- Trigger: A lower-timeframe Market Structure Shift (MSS) or a clear engulfing candle inside the zone.
- Stop-Loss: Placed just outside the FVG zone boundary, plus a small ATR/spread buffer.
- Take-Profit: The next major liquidity pool (prior swing high/low or an unmitigated FVG).
- Fail Case: A candle body closes completely outside the FVG zone.
Setup 2: The Liquidity Sweep to FVG (Reversal-to-Trend)
- Condition: Price sweeps a prominent swing high/low (stop hunt) and aggressively reverses, creating a new FVG in the opposite direction.
- Entry: The 50% equilibrium fill of the newly formed FVG after the sweep.
- Trigger: A clear lower-timeframe MSS or Change of Character (CHoCH) confirming the reversal.
- Stop-Loss: Placed safely behind the extreme high or low of the liquidity sweep candle, plus a spread buffer.
- Take-Profit: The opposing liquidity pool (the origin point of the sweep move).
- Fail Case: A candle body closes completely beyond the sweep’s extreme wick.
6. How to Combine Fair Value Gap with Other Smart Money Tools
A Fair Value Gap is a powerful tool, but it should never be used in isolation. The most successful trades occur when an FVG forms in “confluence” with other Smart Money Concepts. These confirmation signals help filter out weak signals and identify where high-probability order flow is concentrated.
| Combination | Signal Type | How It Helps |
|---|---|---|
| FVG + Order Blocks | Location | Confirms the FVG is in a valid demand/supply zone. |
| FVG + Liquidity Sweep | The Setup | Uses a “stop hunt” to fuel the move into the FVG. |
| FVG + Breaker Block | Confirmation | Confirms the trend is likely to continue after the FVG fill. |
6.1. Fair Value Gap + Order Block
An order block (OB) represents a significant accumulation or distribution zone, often acting as a strong demand or supply area. When a Fair Value Gap forms directly adjacent to or inside an order block, it signals an extremely high-priority zone. This confluence indicates that both a price inefficiency (the FVG) and concentrated liquidity (the OB) are present at the same level, creating a high-probability entry point for a retracement.
This aligns with the mechanics of institutional trading, where large entities must split their massive orders into smaller blocks to avoid slippage, creating these visible zones of concentrated liquidity (Harris, 2003).
6.2. Fair Value Gap + Liquidity Sweep
This is a hallmark “Smart Money” setup. It occurs when the price first sweeps liquidity (a “stop hunt”) below a prominent old low or above an old high. Immediately after this sweep, the price reverses with aggressive displacement, leaving an FVG in its wake. Traders then wait for the price to retrace and mitigate that FVG, as the prior sweep has effectively “fueled” the market for its real move.
6.3. Fair Value Gap + Breaker Block
A breaker block is essentially a failed order block that the price has aggressively sliced through. In the SMC framework, you can use this to confirm a trend continuation after an FVG has been mitigated. For example, in an uptrend, the price taps a bullish FVG and then breaks through the nearest bearish resistance, turning it into a bullish Breaker Block. An inverse fair value gap (IFVG) often forms in this same area, providing further confirmation of the trend shift.
7. What Does an Example Bullish FVG Trade on EUR/USD Look Like?
This example shows how all the concepts: Trend, Liquidity, and Fair Value Gap work together for a high-probability setup. This framework is particularly effective for identifying high-probability swing setups built around fair value gaps on higher timeframes like H4 or Daily.
| Component | Setup Detail |
|---|---|
| Instrument | EUR/USD |
| Analysis (HTF) | The H4 (4-hour) chart is in a clear uptrend (making higher highs). |
| The Setup | Price pulls back, sweeps liquidity below a recent low, then reverses, creating a Bullish FVG on the H1 chart. |
| Confluence | Price taps a Higher Timeframe (H4) Order Block that aligns perfectly with the H1 Bullish FVG zone. |
| Entry | A buy-limit order is placed at the 50% “Equilibrium” level of the H1 Fair Value Gap. |
| Stop-Loss (SL) | Placed just below the low of the Fair Value Gap zone (the 3-candle pattern). |
| Take-Profit (TP) | Set at the nearest major swing high, targeting a 1:2 or 1:3 Risk/Reward (R:R) ratio. |
This is considered a high-conviction setup because it combines all three key elements: it follows the trend (HTF structure), uses a liquidity sweep as “fuel,” enters at a confirmed imbalance zone (the FVG), and uses proper risk management.
8. What Are the Most Common Mistakes When Trading FVGs?
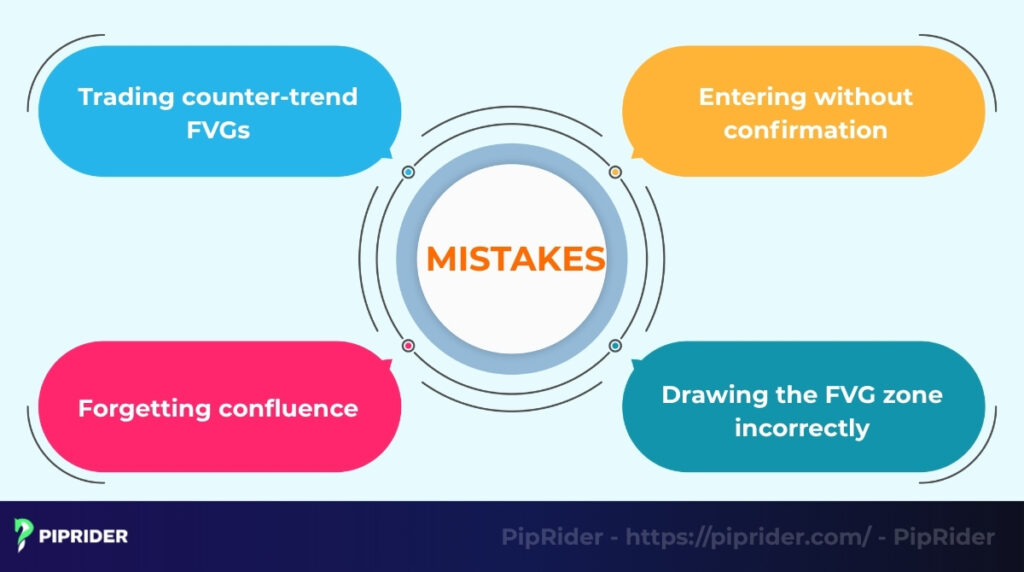
The most common mistakes traders make when using Fair Value Gaps (FVG) fall into two categories: failing to confirm the context and executing prematurely. This includes trading against the main trend, entering the gap without confirmation, and identifying the FVG pattern incorrectly from the start.
- Trading counter-trend FVGs: A Fair Value Gap that forms against the primary Higher Timeframe (HTF) market structure is a low-probability signal and is more likely to fail or “run through.”
- Entering without confirmation: Traders often see price touch the FVG and enter immediately. This price action is a common trap and can lead to catching a “fake move” where the price simply slices through the zone. Waiting for a confirmation signal (like trading patterns) is a crucial filter.
- Forgetting confluence: An FVG by itself is just one piece of the puzzle. A signal becomes much weaker if it is not supported by other factors. Forgetting to check for confluence in trading (like one of the order blocks, a liquidity sweep, or breaker) is a common error. A standalone FVG is a weak trading strategy.
- Drawing the FVG zone incorrectly: A simple technical error is misidentifying the gap. A Fair Value Gap must be a clean three-candle pattern where the wicks of candle 1 and candle 3 do not touch. If they overlap, it is not a valid FVG.
9. What Are Some Tips to Trade FVGs More Effectively?
To trade Fair Value Gaps more effectively, you must filter your signals based on premium/discount zones and the Higher Timeframe (HTF) structure. Furthermore, it is critical to account for volatility and avoid low-timeframe noise.
- Prioritize FVGs in premium/discount zones: This is a powerful filter. Use the Fibonacci retracement tool. In an uptrend, only look for bullish Fair Value Gaps that form below the 50% level (the “discount” zone). This trading strategy filters for the most reliable price swings.
- Align with HTF structure: This is the golden rule. A bullish Fair Value Gap on the H1 chart is only a high-probability signal if the H4 and Daily market structure is also bullish. Never trade a Fair Value Gap that goes against the main trend.
- Use alerts: Instead of staring at the chart, set alerts on your trading platform (like TradingView). Place an alert at the start of the Fair Value Gap so you are notified when the price returns to the zone, saving you time and preventing impatience.
- Avoid low timeframes (below M5): Timeframes like the M1 or M5 are filled with many small Fair Value Gaps and “market noise”. Focus on the clean, clear FVGs on higher timeframes (M15 and above), as these are more likely to reflect genuine market displacement rather than intraday noise.
10. What Tools and Indicators Can Detect Fair Value Gaps?
While manual identification is the best way to develop a professional eye for price action, automated tools can significantly enhance your charting efficiency. These indicators allow you to monitor multiple pairs and timeframes simultaneously, ensuring you never miss a prime trading opportunity. However, to maintain accuracy and security, you must use a rigorous selection process before trusting any automated script.
10.1. 5-Point Checklist for Choosing a Reliable FVG Indicator
The trading community is flooded with automated “SMC toolkits.” However, a poorly coded indicator can lead to false signals or even compromise your trading terminal’s security. Before adding any FVG plotter to your charts, verify it against this professional checklist:
- Strict Mathematical Logic: Ensure the script defines an FVG by the 3-candle wick non-overlap formula. It should not simply highlight large momentum candles without verifying the structural imbalance.
- Active Mitigation Tracking: A professional tool must distinguish between “Unmitigated” (fresh/active) and “Mitigated” (already tested/filled) zones. This prevents you from taking “stale” setups that no longer hold an edge.
- No-Repaint Guarantee: The indicator must draw zones based on confirmed candle closes. “Repainting” tools that change their past signals after price moves are deceptive and dangerous for live execution.
- Security & Source Verification: Avoid downloading unverified
.ex4or.ex5files for MT4/MT5 from unknown sources. Prioritize open-source scripts (like those on TradingView’s Public Library) where the code is transparent and peer-reviewed. - Customization Options: Look for tools that allow you to toggle on/off specific timeframes or highlight the 50% Equilibrium level. This level is critical for the optimal entries we discussed in Step 4.
10.2. Automated Indicators and Software for FVG Detection
While you can identify Fair Value Gaps manually, many traders use automated indicators to spot them quickly. These tools range from simple plotters on TradingView to advanced “Smart Money” toolkits for MT4/MT5 and liquidity heatmaps.
- TradingView FVG Indicators: Many community-built indicators on TradingView can automatically find and draw Fair Value Gap zones on your chart. Popular search terms include “ICT FVG Auto Plotter” or “FVG Indicator,” which save time and help confirm the zones you find manually.
- Smart Money Concepts Toolkits (MT4/MT5): For the MetaTrader platforms, traders often use custom-coded “Smart Money Concepts” indicators. These all-in-one toolkits frequently include Fair Value Gap detection along with order blocks, breaker blocks, and other elements of the SMC trading strategy.
- Liquidity Heatmaps: While not a direct FVG finder, advanced tools like liquidity heatmaps (often found in specialized platforms) are used to visualize where liquidity was left behind. These “voids” on the heatmap often align perfectly with Fair Value Gap zones, giving you another layer of confirmation.
11. FAQs About Fair Value Gaps
12. Conclusion
Fair Value Gaps (FVGs) are powerful price action tools that help traders understand the footprints of aggressive market displacement. When you combine an FVG with liquidity, order blocks, and a market structure shift, you can identify high-quality trading opportunities within the SMC framework.
The secret to how to trade fair value gaps is not finding every gap but finding the right gap (or inverse fair value gap) in the right context. This means managing volatility with a proper stop-loss order. To stay updated with more useful trading knowledge and strategies, be sure to follow Piprider.com.