Swing trading in Forex is about capturing those multi-day price movements, or “swings,” that occur within larger market trends. But how do you know when to enter and exit? That’s where forex swing trading signals come in. These signals are specific technical clues, ranging from chart patterns to indicator readings. They help traders pinpoint high-probability moments to capitalize on market momentum.
This guide will break down the most reliable signals, provide a step-by-step swing trading strategy for beginners, and show you how to confirm them.
Key Takeaways
- Specific technical triggers (like patterns or indicator signals) are used to find entry and exit points for trades lasting days to weeks.
- Signals aim to catch the beginning of a new “swing” within a larger trend or identify potential trend reversals.
- Reliable signals often combine swing trading patterns, technical indicators (such as MAs, RSI, MACD), and candlestick analysis.
- The strongest signals happen when multiple technical factors align (“confluence”) and are confirmed on higher timeframes.
- Even the best signal is useless without proper stop-loss placement and position sizing.
1. What Is Swing Trading in Forex?
Swing trading is a popular style of Forex trading that aims to capture profits from medium-term price movements, often called “swings.” Unlike day trading, where positions are closed within the same day, swing traders typically hold their trades for several days to a few weeks.
The core goal is to identify a developing trend and capitalize on a single “leg” or “swing” within that trend. According to Investopedia, swing trading relies heavily on technical analysis as the primary tool for identifying entry and exit points. This makes it a good fit for traders who have other commitments (like a full-time job) and cannot monitor the market minute-by-minute.
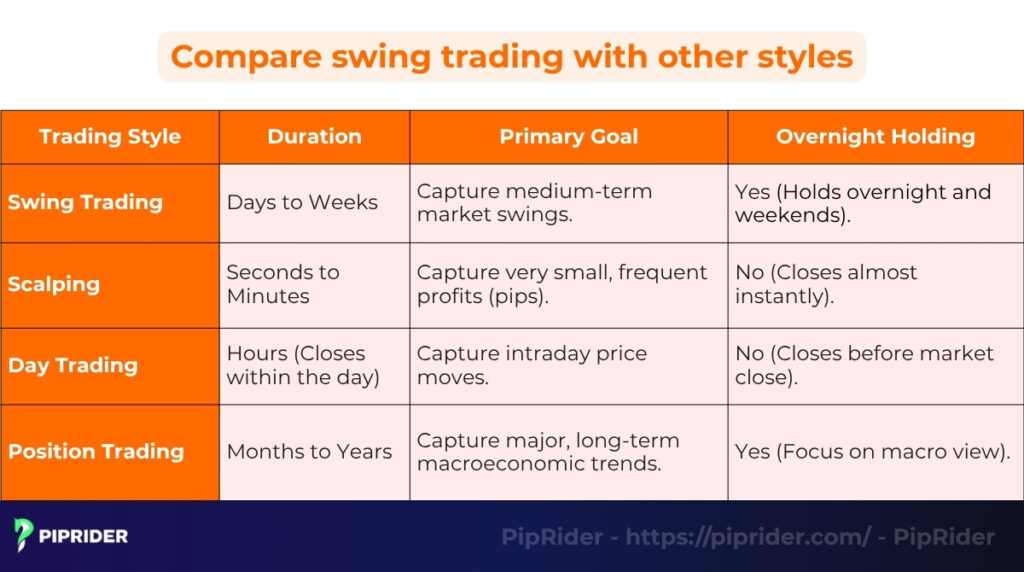
Here’s how it differs from other styles:
- vs. Scalping: Scalpers hold trades for seconds to minutes, aiming for tiny profits (a few pips). Swing trading holds for much longer to capture larger moves.
- vs. Day Trading: Day traders must close all positions before the market closes for the day. Swing traders hold positions overnight and over weekends.
- vs. Position Trading: Position traders hold trades for months or years, focusing on major macroeconomic trends. Swing trading focuses on shorter-term technical trends.
2. What Are Swing Trading Signals?
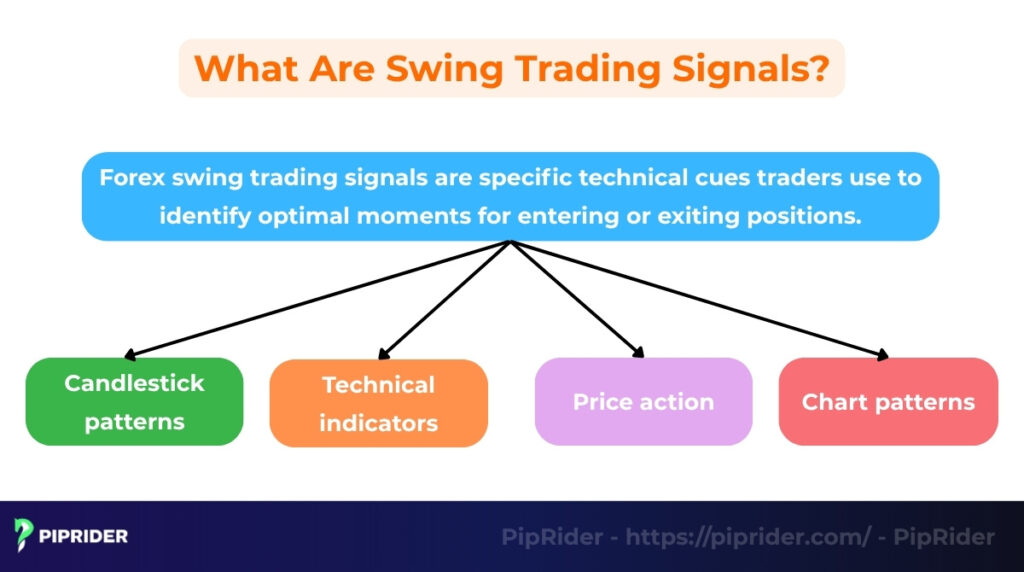
Forex swing trading signals are specific technical cues traders use to identify optimal moments for entering or exiting positions. These are not guaranteed predictions but rather high-probability indications that the price might be about to start a new “swing” in a particular direction.
These signals can originate from various sources within swing trading technical analysis, including:
- Candlestick patterns: Formations of single or multiple candles suggesting reversals or continuations.
- Technical indicators: Readings from oscillators (like RSI, Stochastic) or trend indicators (like MACD, Moving Averages).
- Price action: How the price behaves at key support and resistance levels.
- Chart patterns: Signals derived from larger formations like triangles, flags, or head and shoulders.
The primary purpose of these signals is to confirm a momentum shift or trend continuation, helping traders make informed entry decisions.
In modern markets, many traders are now using AI to refine swing trading signals to filter out noise and improve their entry accuracy.
3. How Swing Trading Signals Work
Swing trading signals aren’t random; they emerge when the price action clearly indicates a potential reversal or continuation of a trend. A reliable signal is typically a confluence of several technical factors working together.
These signals are usually built from a combination of:
- Market structure: The sequence of swing highs and swing lows provides the underlying context. A signal to buy is stronger if it appears within an established uptrend (higher highs and lows).
- Indicator confirmation: Technical indicators like the RSI, MACD, or Moving Average crossovers help confirm the signal. For example, a bullish candlestick pattern is more reliable if the RSI is rising or the MACD shows a bullish crossover.
- Volume and momentum: A surge in volume during a breakout signal validates the move’s strength. Similarly, weakening momentum shown by an indicator during a price rally can signal an impending reversal.
Crucially, experienced swing traders almost always use multi-timeframe analysis to confirm signals. A promising buy signal on the 4-hour chart is much more reliable if the daily chart also shows a clear uptrend. This helps filter out market noise and focus on higher-probability trade setups.
4. The Role of Technical Analysis in Swing Trading
Swing traders rely almost exclusively on charts and technical tools to identify potential entry and exit points. Their focus is on capturing medium-term price momentum, rather than a company’s long-term fundamentals. Technical analysis swing trading is the engine that drives this style.
4.1. Key Tools for Signal Confirmation
A reliable swing trading signal rarely comes from a single tool in technical analysis. Instead, traders look for confluence, where multiple tools point to the same conclusion. Key tools include:
- Support & Resistance levels: These horizontal price zones show where buying or selling pressure has historically been strong. They provide clear areas to look for entries, place stop-losses, and set profit targets.
- Trendlines & Channels: Diagonal lines connecting swing lows (in an uptrend) or swing highs (in a downtrend) help visualize the trend and identify potential swing point trading opportunities when the price touches these lines.
- Candlestick patterns: Formations like the hammer, bullish/bearish engulfing, doji, or shooting star provide immediate visual clues about market psychology and sentiment and potential reversals, especially when they form at key levels.
- Technical indicators: Swing trading technical indicators like the RSI, MACD, and Stochastic Oscillator, which are all popular oscillators, help quantify momentum, identify overbought/oversold conditions, and confirm trend direction.
4.2. Price Action as a Signal Generator
Beyond specific tools, the overall analysis of raw price movements—known as Price Action—generates the most direct and leading signals. In the decentralized Forex market, professional traders prioritize how price interacts with levels over secondary indicators.
- Reversal Candles at Key Levels: The location of a candle is more important than its shape. A bullish reversal candle (like a hammer or pin bar) is a high-probability signal only when it forms at a major support level. If the same candle appears in the middle of a trading range, it is often considered “market noise” and ignored. Context is the primary filter.
- Volume as a Secondary Proxy (Tick Volume): Unlike centralized markets (Stocks/Futures), Spot Forex lacks a central exchange to record total volume. Traders use Tick Volume, a measure of price update frequency, as a proxy for institutional activity. While a surge in tick volume can suggest conviction, it is used as a secondary confirmation rather than a primary requirement.
- Structural Validation of Breakouts: Instead of relying solely on volume to validate a move, swing traders look for a Decisive Candle Close beyond a key level. A breakout is considered valid when the candle body closes firmly outside the range, ideally aligned with the Higher Timeframe (HTF) trend, rather than just leaving a “wick” (which often signals a fakeout).
5. Common Forex Swing Trading Signals & No-Trade Filters
While these signals are highly effective, they are prone to “whipsaws” (false signals) if traded blindly. Below is the refined list, combining technical theory with professional filters to ensure you only take high-probability setups.
5.1. Moving Average Crossovers (20/50 EMA)
Moving averages act as the “heartbeat” of a trend, smoothing out price noise to reveal the underlying direction. A crossover represents a shift in medium-term momentum where the faster-moving average begins to dominate the slower one.
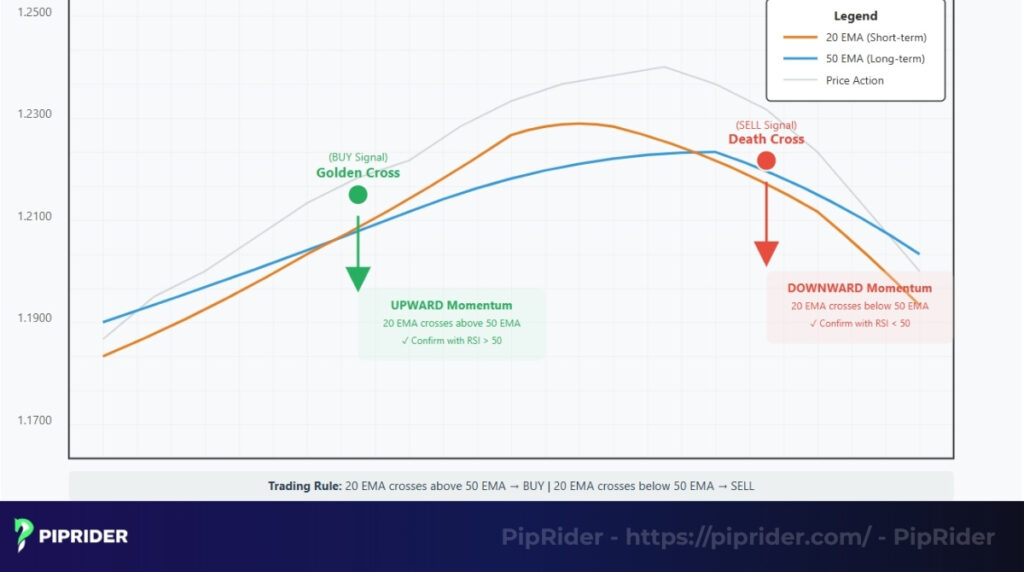
- The Signal: A Bullish Crossover (Golden Cross) occurs when the 20 EMA crosses above the 50 EMA. A Bearish Crossover (Death Cross) is the opposite.
- No-Trade Filter: Avoid entering if the EMAs are “tangling” or moving horizontally. This indicates a sideways market where crossovers are meaningless. Only trade when both EMAs are clearly sloping in the direction of the cross.
5.2. RSI Divergence
The Relative Strength Index (RSI) measures the velocity and magnitude of price changes. Divergence occurs when the “engine” of the move (momentum) begins to fail even though the price is still making new extremes, signaling an impending exhaustion.
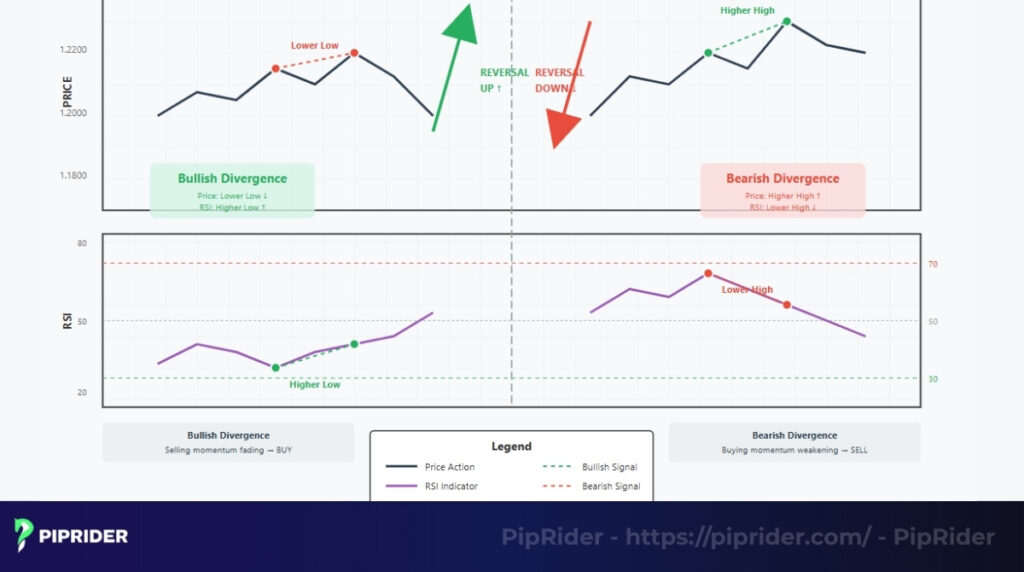
- The Signal: Price makes a new high/low, but the RSI makes a lower high/higher low.
- No-Trade Filter: Do not trade a divergence if the price is in a “parabolic” trend (an extremely steep, near-vertical move). In hyper-strong trends, RSI can remain overbought/oversold for a long time, leading to multiple failed signals. Wait for a structural break (a shift in Market Structure) before entry.
5.3. MACD Line Cross
The Moving Average Convergence Divergence (MACD) is a trend-following momentum indicator that shows the relationship between two moving averages. A crossover between the MACD line and the Signal line indicates a potential “change in power” between buyers and sellers.
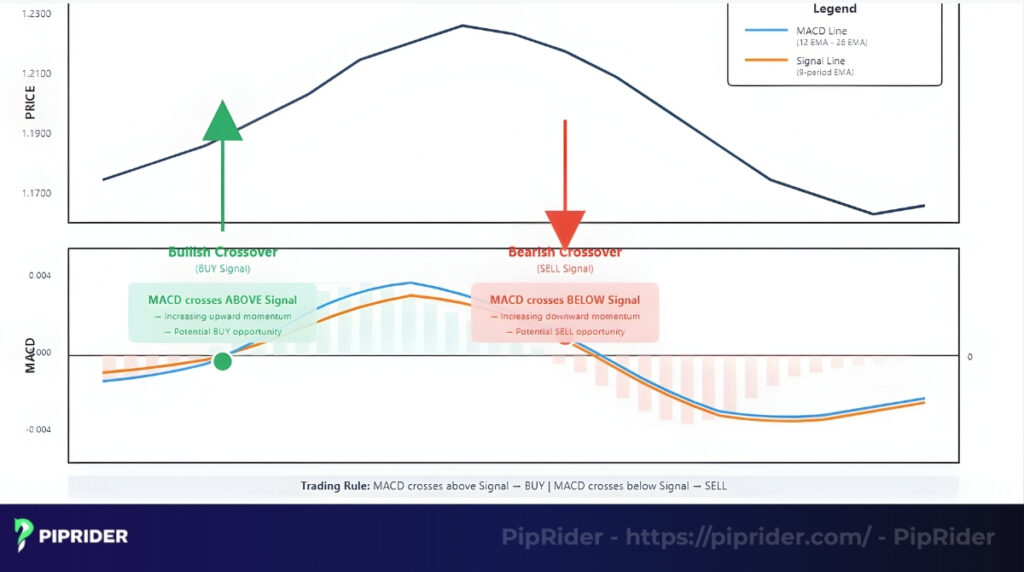
- The Signal: The MACD line crosses above (buy) or below (sell) the Signal line.
- No-Trade Filter: Ignore crosses that occur very close to the Zero Line, as these often represent market indecision. Priority is given to crosses that occur far from the zero line, which indicate a genuine momentum shift from extreme price levels.
5.4. Breakout and Retest
Breakouts represent a fundamental shift in market value where price finally overcomes a psychological barrier. The “retest” is the market’s way of confirming that the new price level is accepted by participants before committing to a multi-day swing.
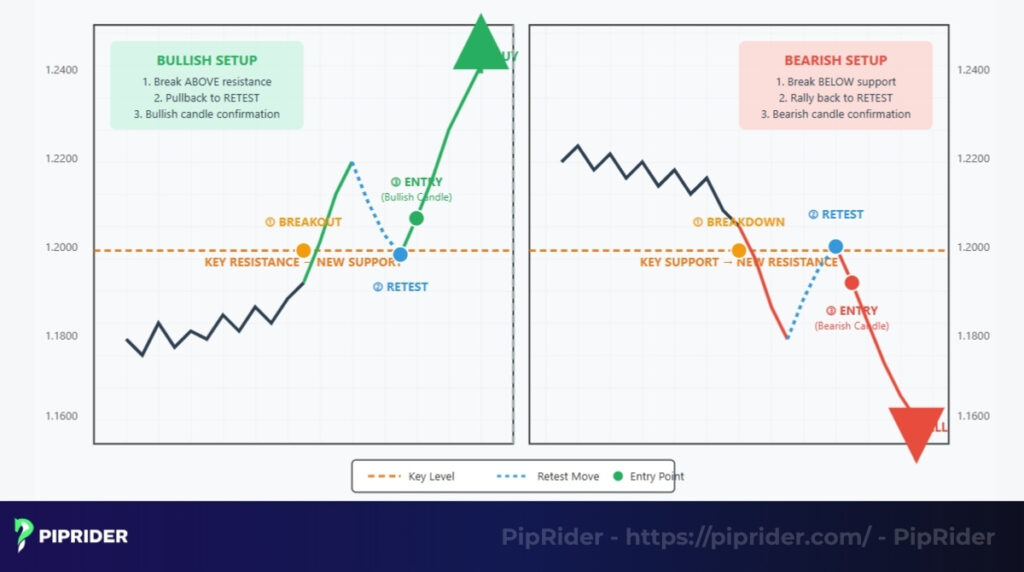
- The Signal: Price breaks a key S/R level and returns to test it as new support/resistance.
- No-Trade Filter: Do not enter if the “retest” candle closes back inside the original range. This is a classic Fakeout. Validation requires a decisive candle close outside the level, followed by a rejection wick that demonstrates the level has flipped.
5.5. Candlestick Reversal Signals (Hammer/Engulfing)
Individual candlesticks are the most immediate “language” of the market. Patterns like the Hammer or Engulfing show institutional rejection and a sudden shift in sentiment at specific price points.
- The Signal: High-momentum candles (Pin Bar, Bullish/Bearish Engulfing) forming at significant structural zones.
- No-Trade Filter: Never trade a reversal candle that forms in “no man’s land” (the middle of a range). Additionally, avoid candles with tiny bodies or excessive wicks on both sides, as these signal market confusion rather than a clear institutional rejection.
Summary: The Swing Signal Quick-Reference Guide
Use this table as your final filter before entering any position. It summarizes the “Green Light” conditions versus the “Red Light” warnings for the five core signals.
| Signal Type | Green Light (Trade) | Red Light (Stay Sideline) |
|---|---|---|
| EMA Crossover | EMAs are clearly sloping & separated. | EMAs are flat, tangled, or “braided.” |
| RSI Divergence | Confirmed by a break in market structure. | Parabolic move (price is near-vertical). |
| MACD Cross | Occurs far away from the Zero Line. | Occurs on or very near the Zero Line. |
| Breakout | Decisive body close + Successful retest. | Price closes back inside the previous range. |
| Candlesticks | Formed at a major HTF structural level. | Formed in “no man’s land” (middle of range). |
6. How to Identify Reliable Swing Trading Signals
Not all forex swing trading signals are created equal. A key skill for swing traders is learning to filter out low-probability trade setups and focus only on the most reliable opportunities. This involves a three-step process: analyzing context, seeking confluence, and confirming across timeframes.
6.1. Step 1: Analyze the Market Context (The Trend)
The single most important factor is the primary trend. Trading with the trend significantly increases the odds of success especially when tracking the market’s risk sentiment.
Before even looking for a signal, determine the market’s main direction using tools like long-term Moving Averages (e.g., 50 or 200 EMA) or the ADX on a higher timeframe (like the Daily or Weekly chart).
Rule: Never take a swing trade against the dominant, higher-timeframe trend. If the Daily chart is clearly bearish, ignore bullish signals on the H4 chart.
6.2. Step 2: Look for Confluence
A single indicator signal or candlestick pattern is rarely enough. The most reliable signals occur when multiple, independent technical factors align at the same price level. This is known as confluence.
Look for setups where at least two or three different elements agree. For example:
- A bullish candlestick pattern forms at a major support level.
- A moving average crossover occurs while the RSI also breaks above 50.
- A classic chart pattern breakout happens on high volume.
The more factors that line up, the higher the probability of the signal being valid.
6.3. Step 3: Confirm on Multiple Timeframes
This is a crucial step to filter out noise and false signals. Once a potential signal is spotted on the primary swing trading chart (e.g., the 4-hour chart), always zoom out to a higher timeframe (e.g., the Daily chart) to confirm it aligns with the bigger picture.
For instance, a bullish engulfing candle on the H4 chart is much stronger if the Daily chart is also clearly trending upwards and the H4 signal forms at a key Daily support level. This multi-timeframe confirmation significantly increases the reliability of the signal.
6.4. The Swing Signal Scorecard: A Systematic Filter
To remove emotional bias and improve consistency, professional swing traders use a quantitative Signal Score (0–5). Before clicking “Execute,” grade your setup against these five criteria.
- Trend Alignment (+1): Does the signal on your primary execution chart (e.g., H4) align with the dominant trend on the Daily (D1) or Weekly chart? Always trade with the higher-timeframe “flow.”
- Key Structural Level (+1): Is the signal forming at a high-confluence zone? This includes major Support/Resistance, a 50% Fibonacci retracement, or a tested psychological level.
- Decisive Trigger Candle (+1): Do you have a clear Price Action trigger (Pin Bar, Engulfing) with a decisive close? Avoid trading mid-candle; wait for the body to settle beyond the level.
- Indicator Confluence (+1): Does a secondary tool support the move? Look for an RSI divergence, an EMA crossover, or the MACD signal line crossing into positive/negative territory.
- Volatility Filter (ADR) (+1): Based on the Average Daily Range (ADR), is there enough “clean air” for the price to reach your profit target? Ensure your 2:1 Reward:Risk isn’t blocked by a major immediate obstacle.
The Pro Rule: Only take trades with a Score ≥ 4. If a setup scores 3 or lower, it is considered a low-probability “B-grade” setup. Professionalism in trading is defined by the discipline to stay on the sidelines when the numbers don’t add up.
7. How to Trade Swing Signals: The Professional Execution SOP
Identifying a signal is just the first step. To survive in the decentralized Forex market, you need a strict Standard Operating Procedure (SOP). This structured workflow bridges the gap between technical analysis and actual trade execution, removing emotional bias from the equation.
7.1. Step 1: The Setup Audit (Scorecard Filter)
Do not trade blindly. Use the Signal Scorecard (Section 6.4) to audit the market context before committing capital.
- The 4/5 Rule: Only execute setups that Score ≥ 4.
- Confirmation: Wait for the signal candle to fully close on your execution timeframe (H4 or D1). Mid-candle entries lead to unnecessary stop-outs.
7.2. Step 2: Strategic Trade Planning (The Pro Template)
Once approved, define your parameters using structure and volatility, ensuring a minimum 2:1 Reward:Risk ratio.
- Entry Type:
- Market Execution: Use if the signal candle closes decisively beyond a key structural level.
- Stop Order (Buy/Sell Stop): Place 2-5 pips beyond the signal candle’s wick to enter only if momentum continues in your direction.
- Stop-Loss (Structure + Buffer):
- Placement: Set beyond the “Invalidation Point” (the most recent structural swing high/low).
- The Buffer: Add 10% – 15% of the Average Daily Range (ADR). This protects your stop from being tagged by minor market noise or “stop-hunting” wicks.
- Take-Profit (Levels + Partials):
- Target 1 (Base Hit): Set at the next major structural level, ensuring at least a 2R return. Close 50% of your position here.
- Risk-Free Move: Immediately move the Stop-Loss on the remaining 50% to Break-Even (Entry Price).
- Target 2 (Runner): Let the remaining position run toward the next Higher Timeframe (HTF) zone.
7.3. Step 3: Active Management & Journaling
A swing trade is a multi-day process. Manage the open position effectively and record the data.
- Trailing Stop: Once the price reaches 1.5R, trail your stop-loss behind newly formed minor swing points to protect floating profits while giving the trade room to breathe.
- Visual Journaling: Log every trade using a professional format:
- “Before” and “After” chart screenshots.
- The setup’s Signal Score.
- Entry/SL/TP parameters and any overnight Swap costs incurred.
- Emotional state and execution adherence.
8. Examples of Swing Trading Signals in Forex
Let’s look at two hypothetical examples to see how these signals might play out on real Forex charts.
8.1. Example 1: EUR/USD H4 Chart – Bullish Reversal
Setup: The price is in a downtrend but approaches a major support level on the H4 chart. Price forms a clear bullish engulfing pattern at this level, which also aligns with a key Fibonacci retracement level. Simultaneously, the RSI indicator shows bullish divergence (price makes a lower low, RSI makes a higher low).
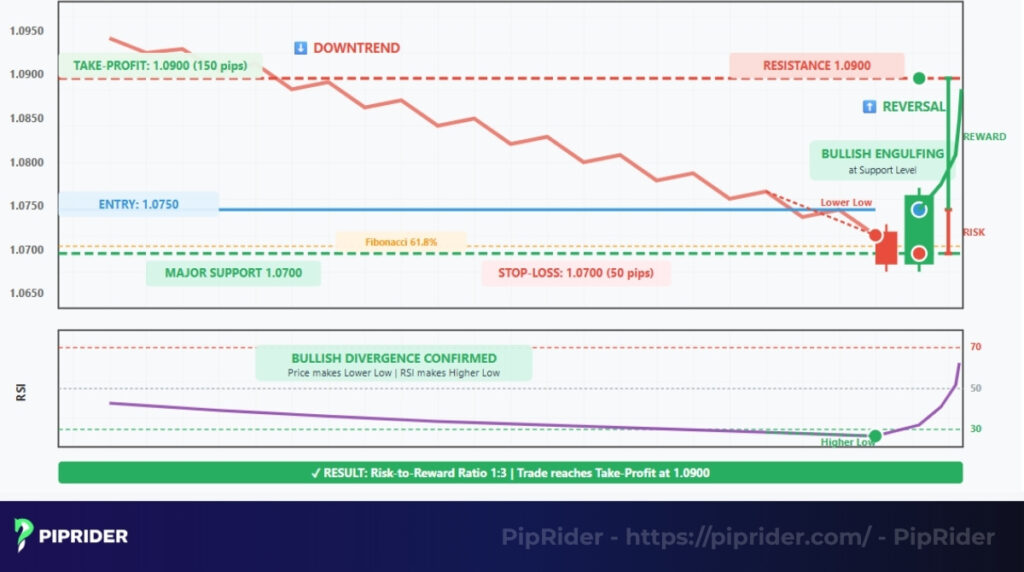
Trade Plan:
- Entry: Buy order placed just above the high of the bullish engulfing candle at 1.0750.
- Stop-Loss: Placed below the low of the engulfing candle and the support level at 1.0700 (50-pip risk).
- Take-Profit: Target set at the next significant resistance level near 1.0900 (150-pip potential reward).
Result: The setup offers a high-probability 3:1 Reward:Risk ratio (3R profit potential).
8.2. Example 2: GBP/USD Daily Chart – Bearish Continuation
Setup: The GBP/USD is in a confirmed downtrend on the Daily chart, trading below the 50-period moving average (MA50). The MACD indicator shows a bearish crossover, signaling downward momentum. The price then briefly rallies back to retest the underside of the MA50, which now acts as a key resistance level. A bearish pin bar forms exactly at the MA50, providing the entry signal.
Trade Plan:
- Entry: Sell order placed at the close of the bearish pin bar at 1.2600.
- Stop-Loss: Placed above the swing high and the MA50 at 1.2750 (150 pips risk).
- Take-Profit: Targeted at the major structural support level at 1.2300 (300 pips potential reward).
- Result: This trade offers a solid 2:1 Reward:Risk ratio (Targeting 2R), aligning with the primary higher-timeframe trend.
9. Risk Management in Swing Trading
Because swing trades last significantly longer than day trades, traders must account for factors beyond simple price movement. Solid risk management is the difference between a professional career and a blown account.
- The 1-2% Rule & Position Sizing: Never risk more than 1% to 2% of your total equity on a single trade. This ensures you can survive inevitable losing streaks. Use precise position sizing to ensure your stop-loss distance aligns with this monetary risk.
- Targeting at least 2R: Only accept setups with a minimum 2:1 Reward:Risk ratio. This mathematical edge ensures that even with a 50% win rate, your account remains profitable over time.
- Accounting for Swap (Overnight Financing): Unlike day trading, swing trading incurs “Swap” costs—the interest paid or earned for holding a position past the daily rollover. Always check the swap rates of a pair; a high negative swap can significantly erode profits on trades held for several weeks.
- Managing Weekend Gap Risk: Major news during the weekend can cause the market to “gap” significantly upon the Sunday open. Since these gaps can bypass your stop-loss, consider closing or reducing positions on Friday if the price is near your stop or if high-impact geopolitical events are looming.
- Correlation & ADR Awareness: Avoid over-exposure by not trading highly correlated pairs simultaneously. Additionally, incorporate the Average Daily Range (ADR) to ensure your stop-loss accounts for typical daily volatility. This prevents being prematurely “stopped out” by market noise before the multi-day swing develops.
- The News Filter: Avoid entering new swings immediately before major economic releases like the FOMC or NFP. The unpredictable volatility can trigger stop-losses before the primary trend has a chance to resume.
10. Swing Trading Signals vs. Day Trading Signals
While both swing traders and day traders use technical analysis, the signals they look for and how they interpret them differ significantly due to the vastly different holding times.
Here’s a comparison of key criteria:
| Criteria | Forex Swing Trading | Forex Day Trading |
|---|---|---|
| Holding Period | Days to Weeks | Minutes to Hours (Closed same day) |
| Timeframes Used | H4, Daily (D1), Weekly (W1) | M5, M15, H1 |
| Trade Frequency | Low (Quality focus, 1-5 setups per week) | High (Multiple setups per day) |
| Target / Stop-Loss | Wide (100-300+ pips, Targeting 2R) | Tight (10-50 pips) |
| Screen Time | Low (Set and forget, 1-2 hours/day) | High (Constant chart monitoring required) |
| Primary Risks | Overnight Swap fees, Weekend Gaps | Spread costs piling up, Intraday news spikes |
In essence, swing trading signals focus on capturing larger, multi-day price movements, while day trading signals focus on exploiting very short-term volatility and momentum shifts within a single session.
Despite the differences in timeframe, swing traders can still apply day-trading risk rules to manage intraday spikes that might threaten their long-term positions.
11. Fatal Mistakes When Trading Swing Signals
Even with a perfect setup, poor execution and lack of discipline will destroy your edge. Avoid these critical errors that separate amateurs from professional PipRider traders:
- Entering Before the Candle Closes: The #1 cause of fakeout losses. A signal is only valid after the execution candle (H4 or D1) has fully closed. Never trade mid-candle momentum.
- Chasing the Signal (FOMO): Entering late after the price has already surged away from the trigger zone. This instantly ruins your 2:1 Reward:Risk ratio. If you miss the optimal entry, wait for a pullback or skip the trade entirely.
- Overtrading Sub-Par Setups: Forcing trades in a choppy, sideways market just to “be in the market.” A professional only executes when the setup passes the Signal Scorecard (Score ≥ 4).
- Trading Directly Into Major News: Executing a technical setup hours before a Tier-1 economic release (e.g., NFP, FOMC, CPI). Unpredictable fundamental volatility will easily sweep your technical stop-loss.
- Ignoring Time-Based Risks (Swap & Weekend Gaps): Treating a multi-day swing trade like a day trade. Always calculate overnight financing (swap costs) and be prepared to reduce your position size on Friday to avoid catastrophic Monday gaps.
- Signal Provider Dependency: Blindly copying trades from Telegram, Discord, or social media “gurus.” Even if you receive an external signal, you must run it through your own Setup Audit and risk parameters before execution.
- Indicator Reliance & HTF Blindness: Trading solely based on an RSI or MACD cross while ignoring the primary trend on the Daily/Weekly chart. Indicators are secondary; Market Structure is king.
- Placing “Naked” Stop-Losses: Setting your stop-loss exactly on the support/resistance line without adding the 10-15% ADR Buffer. This guarantees you will be taken out by routine market noise.
12. Frequently asked questions about Forex Swing Trading Signals
13. Conclusion
Forex swing trading signals are not magic bullets; they are simply tools to identify moments of high probability. True long-term success is not found in a single indicator, but in the strict execution of a Standard Operating Procedure (SOP).
By utilizing the Signal Scorecard, maintaining a minimum 2:1 Reward:Risk ratio, and actively managing time-based risks like swap fees, you transform from a reactive retail trader into a proactive market operator. Do not chase the market—wait patiently for the A+ setups to come to you.
To continue building your trading edge, explore our in-depth guides in the Trading Strategies category on PipRider.