
The megaphone pattern is a rare but powerful chart formation that warns traders of extreme market volatility and changing market dynamics. Understanding this “Broadening Formation” is the key to catching major breakouts while avoiding chaotic price swings. This guide explains exactly how to identify the pattern, the market psychology behind it, and the step-by-step strategies to trade it effectively.
Quick definition: What is a Megaphone Pattern?
- Structure: A series of at least two higher highs and two lower lows.
- Visual: Two diverging trendlines that open up to the right, resembling a megaphone.
- Sentiment: Represents extreme volatility expansion and a lack of market consensus.
- Signal: Typically acts as a reversal pattern at major market turning points, though it requires a confirmed breakout to trade.
Key Takeaways
- The megaphone pattern, or broadening formation, is defined by expanding higher highs and lower lows.
- It reflects increasing market volatility and a lack of consensus between buyers and sellers.
- The two main types are the megaphone top (bearish reversal) and megaphone bottom (bullish reversal).
- The strongest signal is a breakout beyond the upper or lower boundary, confirmed by high volume.
- For better accuracy, combine it with indicators like EMA, RSI, and volume profile.
1. What Is the Megaphone Pattern?
The megaphone pattern, also known as a broadening formation or broadening wedge, is a technical analysis chart formation characterized by increasing volatility (Scott, 2025). Unlike most patterns where the price range narrows, the megaphone consists of two diverging trend lines: a top line connecting higher highs and a bottom line connecting lower lows.
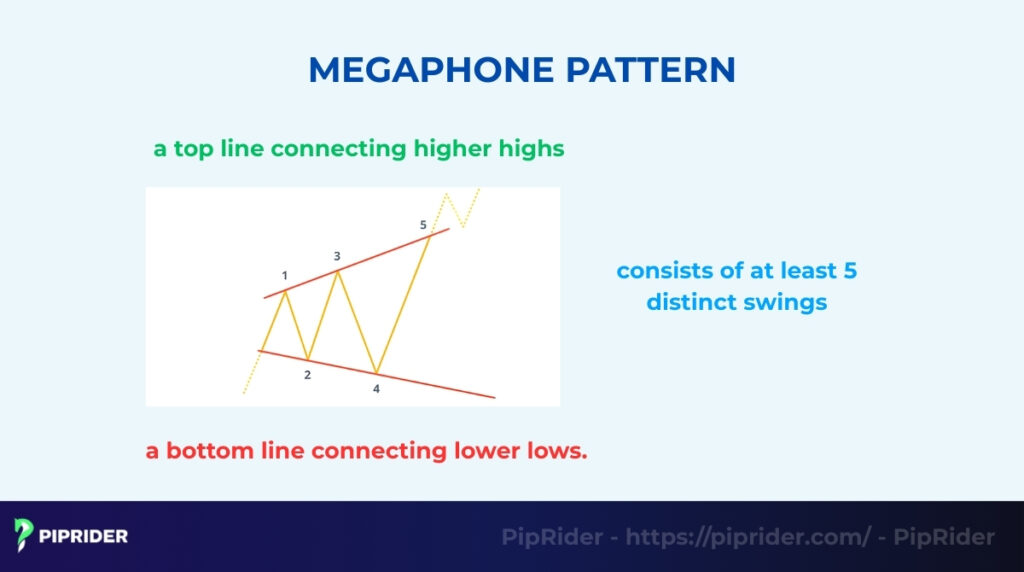
First identified by Richard Schabacker in 1932 (Murphy, 1999), the megaphone pattern typically consists of at least 5 distinct swings (price movements), showing a chaotic battle between buyers and sellers.
It often appears at market tops or bottoms, signaling that the market has lost control and is highly emotional. Traders use it to spot potential reversals or explosive breakouts.
Megaphone vs. Symmetrical Triangle
To understand the Megaphone, it is helpful to compare it to its opposite: the standard symmetrical triangle.
- Symmetrical triangle (Contraction): The price range gets smaller as the market “coils” and calms down. This represents a period of temporary equilibrium where traders are waiting for a catalyst.
- Megaphone (Expansion): The price range gets larger as the market becomes more unstable and uncertain. It represents a total breakdown of consensus, where both bulls and bears are aggressively trying to take control but neither can sustain the move, leading to “emotional” price action.
2. What Are the Types of Megaphone Patterns?
While the expanding shape is consistent, the pattern’s meaning changes depending on where it forms in the market trend. Understanding the context is vital, as certain variations are more common in specific asset classes.
| Pattern Type | Market Context | Likely Outcome | Reliability & Typical Asset |
| Megaphone Top | Forms after an uptrend | Bearish reversal (Down) | High (Stocks / Equity indices) |
| Megaphone Bottom | Forms after a downtrend | Bullish reversal (Up) | Moderate (Crypto / High volatility) |
| Horizontal | Forms in sideways markets | Neutral / Volatility expansion | Low (Forex / News-driven) |
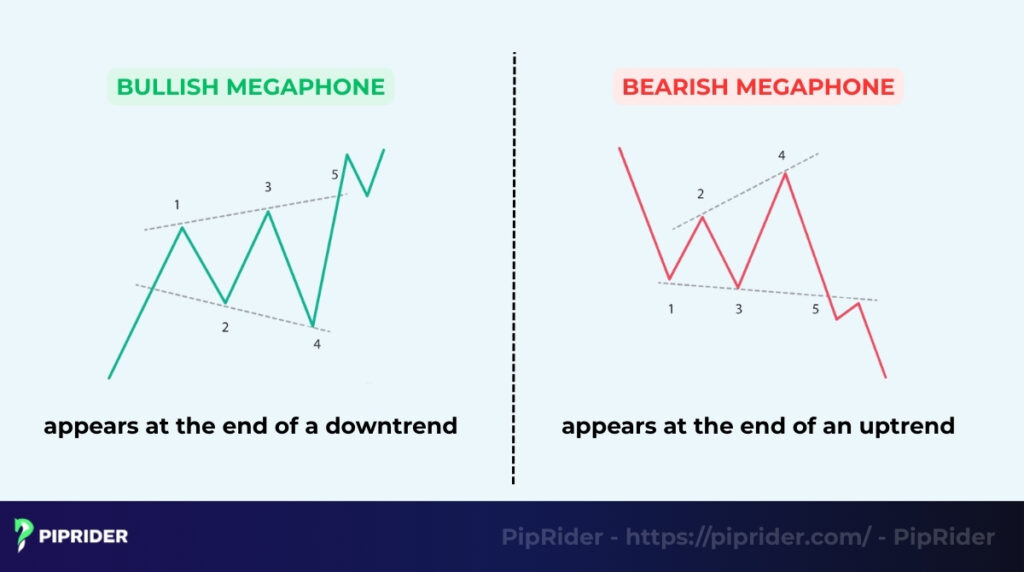
2.1. Megaphone Top (Bearish Broadening Formation)
This pattern typically appears at the end of a strong uptrend, signifying that the bulls are losing control. It is most frequently seen in the stock market or major indices (like the S&P 500) during a “blow-off top” phase. Visually, the price makes higher highs but is also forced into deeper lower lows, showing extreme instability.
It is widely considered the most reliable version of the pattern. It acts as a bearish reversal signal, and traders watch for the price to break below the lower trendline to confirm that the distribution phase has ended and a downtrend is beginning.
2.2. Megaphone Bottom (Bullish Broadening Formation)
Conversely, this pattern forms at the end of a downtrend. It indicates that while sellers are pushing the price lower, buyers are aggressively fighting back to create higher peaks. These are common in the cryptocurrency markets and other high-volatility assets where “panic selling” is often met with aggressive “dip buying”.
This setup serves as a bullish reversal signal. While powerful, it can be more erratic than the top version due to the inherent panic found at market bottoms. The key trigger is a breakout above the upper trendline, suggesting buyers have finally overwhelmed the remaining sellers.
2.3. Horizontal Megaphone Pattern (Right-Angled)
Sometimes, the pattern doesn’t tilt clearly up or down. It may look like a “reverse rectangle” where one trendline is flat (horizontal support or resistance) while the other expands. This formation indicates pure volatility expansion without a clear directional bias.
These are common in the Forex market during high-impact news weeks. Because there is no clear trend bias, they are considered the most dangerous to trade. Traders should avoid anticipating the direction and instead expect a massive breakout in either direction once the horizontal boundary or the diverging line is broken with high volume.
3. What Is the Market Psychology Behind the Megaphone Pattern?
The megaphone pattern is unique because it visualizes a market that is losing control. Unlike a symmetrical triangle where the price range tightens (showing agreement), a Megaphone shows a market tearing itself apart with disagreement. It represents a chaotic battle between fear and greed.
- Increasing volatility: This formation signals a total lack of consensus. Buyers are aggressive enough to push the price to new highs, but sellers are equally aggressive, smashing the price to new lows immediately after. This widening battlefield shows that neither side has control.
- Fear & uncertainty: During this phase, traders are reacting with emotion rather than logic. The new highs trigger FOMO (fear of missing out), sucking buyers in at the top. Moments later, the new lows trigger panic, forcing them to sell at the bottom.
- Liquidity sweeps: For “Smart Money” (institutions), this pattern is a tool to hunt liquidity. By pushing the price slightly higher than the previous peak, they trigger the stop-losses of short-sellers. By pushing it lower, they trigger the stop-losses of buyers. The market is effectively “cleaning out” both sides before the real trend begins.
Market psychology summary:
- Buyers chase highs: FOMO leads to aggressive buying at the upper boundary.
- Sellers slam lows: Panic selling occurs as the price drops to new extremes.
- Stops get hunted: Volatility triggers stop-losses on both sides of the market.
- Breakout decides the winner: The eventual breakout confirms which side has finally gained control.
4. How to Identify a Megaphone Pattern (Step-by-Step)
Identifying this pattern requires a keen eye for technical analysis and and market structure where price swings get wider over time, defying normal trend rules. To be considered a valid formation, you should look for specific price action characteristics before drawing your lines. Follow these steps to spot it correctly.
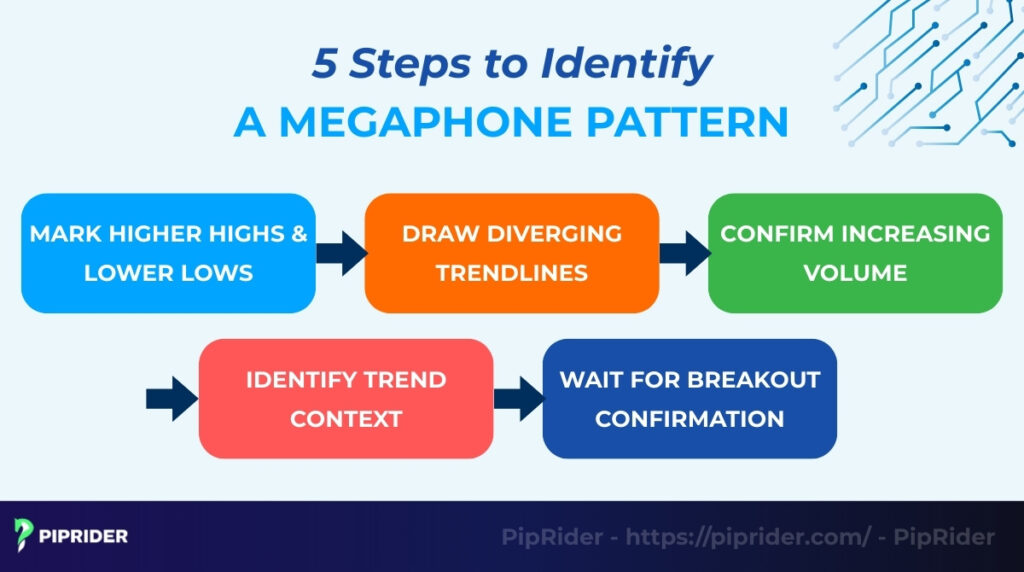
4.1. Step 1: Mark Higher Highs & Lower Lows
Start by scanning the chart for pivot points where the price seems “out of control.” You need to identify at least two higher highs and two lower lows. This expanding pivot structure is the primary clue that market stability is breaking down.
4.2. Step 2: Draw Diverging Trendlines
Once the pivots are marked, connect the highs with a top trendline and the lows with a bottom trendline. Unlike a standard triangle where lines converge (meet), these lines must diverge (move apart). The result should look like a megaphone or a reverse cone opening up to the right.
4.3. Step 3: Confirm Increasing or Irregular Volume
Check the volume indicator. In a standard triangle, volume usually drops as the price coils. In a megaphone pattern, volume often increases or remains high and irregular. This confirms high participation and an intensifying battle between buyers and sellers.
4.4. Step 4: Identify Trend Context
Zoom out to see the bigger picture. Is this pattern forming after a long rally (suggesting a potential Megaphone Top) or after a steep decline (suggesting a potential Megaphone Bottom)? Knowing the prior trend helps you anticipate the significance of the eventual breakout.
4.5. Step 5: Wait for Breakout Confirmation
Identifying the shape is not a trade signal. You must wait for the price to close decisively outside one of the trendlines. Trading inside the widening range is risky; the real opportunity comes when the market finally chooses a direction and breaks out with momentum.
4.6. Quick Validation Checklist
Before executing a trade based on this pattern, use this 6-point checklist to ensure the formation is valid:
- At least 5 distinct swings: The price should have touched the trendlines at least five times (e.g., three highs and two lows).
- Clear diverging lines: The trendlines must be moving away from each other, not parallel or converging.
- Higher highs and lower lows: The price must be making increasingly extreme peaks and troughs.
- Prior trend context: There should be a clear trend leading into the pattern.
- Irregular/Increasing volume: Volume should reflect the growing disagreement in the market.
- Confirmed candle close: The pattern is only triggered by a candle closing outside the boundaries, not just a temporary “wick” piercing the line.
5. How to Trade the Megaphone Pattern (The Playbook)
Trading a broadening formation requires a disciplined approach because the expanding range is designed to trap emotional traders. To trade this effectively, you must move away from “guessing” and follow a structured execution framework. Below are the three primary strategies used by professional traders.
5.1. Strategy 1: Breakout Strategy
This is the most common approach, focusing on the moment the market finally resolves its indecision and establishes a clear direction.
- Best for: Intermediate traders who prefer high-momentum moves.
- Entry trigger: A decisive candle close outside either the upper or lower trendline.
- Confirmation: A significant spike in volume on the breakout candle or a successful “retest” of the broken trendline.
- Stop-Loss: Placed just inside the pattern, typically on the other side of the breakout candle or a recent minor swing.
- Take-Profit: Target a “measured move” (the vertical height of the widest part of the megaphone projected from the breakout point) or the next major support/resistance zone.
- Avoid when: The breakout occurs on low volume or happens immediately before a high-impact news event.
5.2. Strategy 2: The Fakeout Reversal Strategy
This strategy capitalizes on “liquidity sweeps,” where the price briefly breaks the boundary to hunt stop-losses before reversing sharply.
- Best for: Advanced traders comfortable with “fading” initial momentum.
- Entry trigger: Price pierces the trendline but fails to hold, closing back inside the pattern with a strong rejection wick (e.g., a Pin Bar).
- Confirmation: Bearish/Bullish divergence on the RSI or a bearish/bullish engulfing candle following the fakeout.
- Stop-Loss: Placed just beyond the high or low of the rejection wick.
- Take-Profit: The opposite side of the megaphone trendline or the pattern’s midpoint (median line).
- Avoid when: There is a strong fundamental catalyst driving the breakout (the trend is likely real, not a fakeout).
5.3. Strategy 3: The Trend Continuation Strategy
Sometimes the megaphone acts as a temporary “shaking out” period within a much larger trend.
- Best for: Trend followers looking for high-probability entries in a dominant move.
- Entry trigger: A breakout that aligns with the higher-timeframe (HTF) trend direction.
- Confirmation: Price remains above/below a key moving average (like the 200 EMA) and breaks the megaphone boundary with volume.
- Stop-Loss: Placed behind the most recent swing low/high within the megaphone.
- Take-Profit: Extensions of the prior trend or the next psychological price level.
- Avoid when: The prior trend shows signs of exhaustion or the megaphone is forming at an extreme historical overbought/oversold level.
5.4. When NOT to Trade a Megaphone Pattern
Recognizing when to stay on the sidelines is just as important as knowing when to enter. Avoid trading this pattern if:
- The swings are “messy”: If you cannot clearly identify at least five clean touches on the trendlines, the market is likely just in “choppy” consolidation.
- The pattern is too small: Megaphones on very low timeframes (M1, M5) are often noise created by spread fluctuations rather than true market psychology.
- Volume is absent: If the price is expanding but volume is dead, the pattern lacks the participation necessary for a reliable breakout.
- Right before “High-Impact” news: Volatility during NFP or Central Bank rate decisions can create “fake” megaphone shapes that disappear once the news is priced in.
- Tight Stop-Losses: Never trade a megaphone with a very tight stop. The inherent nature of this pattern is high volatility; your trade needs “room to breathe” using ATR-based stops.
6. Where to Place Stop-Loss and Take-Profit
Because the megaphone pattern represents extreme volatility, a “fixed” approach to risk management usually leads to premature exits. You must use a dynamic strategy that accounts for the expanding price range to protect your capital while maximizing gains.
6.1. Dynamic Stop-Loss Placement
Standard stop-losses are often too tight for a broadening formation. Use one of the following methods to give your trade room to breathe:
- The breakout candle method: Place your stop-loss just inside the pattern, specifically on the opposite side of the candle that closed outside the trendline. If the price returns to this level, the breakout has likely failed.
- The ATR-based buffer (Recommended): Use the Average True Range (ATR) indicator to set a volatility-adjusted stop. A common approach is placing the stop at 1.5x to 2x the ATR value away from your entry. This ensures that normal market “noise” doesn’t trigger your stop-loss.
- The recent swing pivot: For reversal trades, place the stop-loss slightly beyond the most recent swing high or low (the “wick” of the fakeout).
6.2. Take-Profit Targets & The Measured Move
Setting targets in an expanding market requires a balance between ambition and reality.
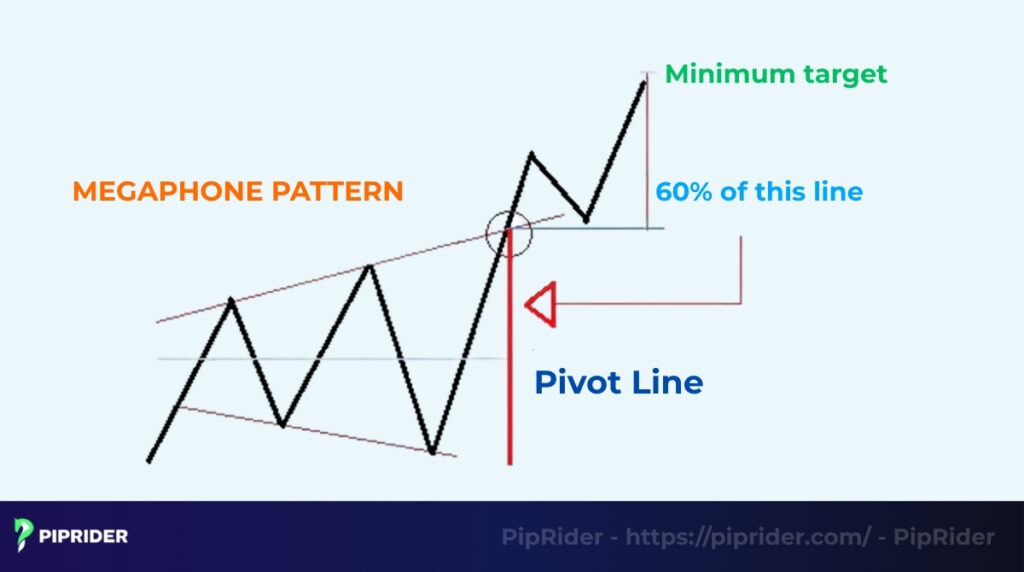
- The measured move: Measure the vertical distance between the highest peak and lowest trough of the megaphone (its widest point). Project this same distance from the breakout point to find your primary price target.
- Horizontal support/resistance: Look for historical “left-side” data. Major pivots or psychological round numbers near your measured move target often act as magnets for price.
- Fibonacci extensions: Use the 1.272 or 1.618 Fibonacci extensions of the final swing within the megaphone to find mathematical exit points.
6.3. Target Risk-Reward (R:R) Models
Due to the high-risk nature of megaphone breakouts, you should aim for a minimum Risk-Reward ratio of 1:2 or 1:3. Because the target (the measured move) is usually quite large, these ratios are often achievable if the entry is timed correctly.
Example trade management:
- Initial risk: 1% of account balance.
- First target (1:1 R:R): When the price reaches a 1:1 ratio, move your stop-loss to “Breakeven” to ensure a risk-free trade.
- Runner (Final target): Hold the remaining position until the price reaches the full measured move or shows a reversal signal on a lower timeframe.
7. Which Indicators Best Confirm the Megaphone Pattern?
Because the megaphone pattern is defined by instability, trading it based on price action alone can be risky. Using technical indicators as “confluence” helps you filter out false signals and identify high-probability entries.
7.1. Indicator-Strategy Mapping Table
Different indicators serve different purposes depending on which trading strategy you are using. Use the table below to align your tools with your execution.
| Indicator | Primary Strategy | Best Use Case |
|---|---|---|
| Volume | Breakout / Continuation | Confirming the validity of a trendline break |
| RSI | Reversal / Fakeout | Spotting momentum exhaustion and “liquidity sweeps” |
| 200 EMA | Trend Continuation | Determining the dominant long-term market bias |
| ATR | All Strategies | Calculating dynamic stop-losses for high volatility |
7.2. Volume Spike & Volatility Expansion
Volume is the “lie detector” for this pattern. Unlike standard triangles where volume dries up, volume in a megaphone often remains high or irregular as the range widens. You must see a significant volume spike on a breakout candle. If the price breaks the trendline on low volume, it is highly likely to be a “trap”.
7.3. RSI Divergence
The Relative Strength Index (RSI) is the perfect tool for the “Fakeout Reversal Strategy”. Look for divergence at the boundaries. For example, if the price makes a new higher high at the upper trendline but the RSI makes a lower high, it signals that buying momentum is exhausted, confirming a high-probability short entry.
7.4. EMA Trend Confirmation
Exponential Moving Averages (EMA) help you maintain a macro perspective. Use the 200-period EMA to determine if you are in a bull or bear environment. If a megaphone forms above the 200 EMA, you should bias your trades toward bullish continuations. If it forms below, focus on bearish setups.
8. Should Beginners Trade the Megaphone Pattern?
The megaphone pattern is widely considered one of the most difficult formations to trade because it goes against the “normal” rules of trend-following. Use this decision-support framework to determine if you should trade this setup.
8.1. Beginner Pathway (Not Recommended)
If you are new to technical analysis, the megaphone pattern can be extremely dangerous. The widening swings often trigger emotional reactions (FOMO at the highs and panic at the lows), leading to “overtrading” or “revenge trading”.
Advice: Focus on learning more stable patterns first, such as the Rectangle or Symmetrical Triangle. If you must trade a megaphone, only do so on a demo account.
8.2. Intermediate Pathway (Breakout Only)
Once you understand volume confirmation and breakout rules, you can begin trading this pattern.
Advice: Avoid trading “inside the range.” Only enter when the price closes decisively outside the trendlines with a clear volume spike. Use conservative stop-losses and focus on the “Measured Move” target.
8.3. Advanced Pathway (Fakeouts & Intraday)
Professional traders often view megaphones as a source of high-volatility opportunity.
Advice: Look for “liquidity sweeps” (fakeouts) at the extremes of the pattern. You can also exploit the volatility by trading from one boundary to the other (fading the extremes) during news-heavy periods, provided your risk management (ATR-based stops) is airtight.
9. Real Megaphone Pattern Case Studies
To move from theory to practice, let’s examine how the megaphone pattern has historically manifested in major markets. These cases highlight the pattern’s role in identifying high-volatility shifts.
9.1. Case Study: S&P 500 (Market Top)
- Context: After a prolonged multi-year bull run, the index began making volatile higher highs and deeper lower lows, indicating investor exhaustion and high-level distribution.
- Trigger: A daily candle close below the lower diverging trendline following a failed attempt to reach a new peak.
- Risk: Stop-loss placed above the most recent internal swing high within the megaphone.
- Target: A measured move based on the widest part of the formation, aligning with previous historical support levels.
- Lesson learned: At major market tops, megaphones signal that “smart money” is exiting while retail traders are still chasing new highs (FOMO).
9.2. Case Study: Bitcoin (Volatility Accumulation)
- Context: During a mid-cycle consolidation, Bitcoin price action became erratic, sweeping liquidity above and below the range.
- Trigger: An upside breakout confirmed by a massive spike in trading volume and a “retest” of the upper trendline as support.
- Risk: ATR-based stop-loss to account for crypto’s inherent 24/7 volatility.
- Target: Fibonacci extensions (1.272 and 1.618) of the megaphone’s height.
- Lesson learned: In crypto, megaphones often act as “shakeouts” designed to remove over-leveraged traders before the actual trend resumes.
9.3. Case Study: EUR/USD (News-Driven Expansion)
- Context: Leading up to a major Central Bank interest rate decision, the pair created a horizontal/right-angled megaphone on the 1-hour chart.
- Trigger: A sharp reversal (Fakeout) at the upper boundary immediately following the news release.
- Risk: Tight stop-loss just above the news-driven “wick.”
- Target: The opposite (lower) boundary of the megaphone.
- Lesson learned: Intraday megaphones are often “liquidity traps.” Trading the failure of a breakout (the Fakeout) can be more profitable than chasing the initial news spike.
10. Megaphone Pattern vs. Other Chart Patterns
It is easy to confuse the Megaphone with other consolidation patterns. However, recognizing the difference is critical because they signal opposite market psychologies.
Advanced Comparison Table
This table helps you distinguish the Broadening Formation from similar-looking structures and assesses the difficulty level for each.
| Pattern | Structure | Volatility | Difficulty | Market Sentiment |
|---|---|---|---|---|
| Megaphone | Expanding (<) | Increasing | High | Chaos / Total Disagreement |
| Symmetrical Triangle | Contracting (>) | Decreasing | Low | Coiling / Waiting for Catalyst |
| Broadening Wedge | Expanding & Sloped | Increasing | Medium | Aggressive Trend Exhaustion |
| Price Channel | Parallel (=) | Stable | Low | Orderly Trend / Consensus |
| Rectangle | Horizontal | Stable | Low | Indecision / Range-bound |
Megaphone vs. Symmetrical Triangle
These are exact opposites. A symmetrical triangle represents a market that is calming down as price coils into a tighter range. A megaphone represents a market losing control, with the range exploding outward.
Megaphone vs. Broadening Wedge
While both expand, a Broadening Wedge has both trendlines sloping in the same general direction (up or down). A Megaphone has trendlines moving in opposite directions. The wedge usually suggests a specific directional exhaustion, while the megaphone suggests general market instability.
11. What Are Common Mistakes When Trading Megaphone Pattern?
The megaphone pattern is dangerous for inexperienced traders because its inherent volatility invites bad habits. Most losses occur not because the pattern failed, but because the trader ignored the unique mechanics of a broadening formation.
- Trading inside the chaos: The middle of a megaphone is a “high volatility zone” with no clear trend. Entering trades here often leads to being stopped out by random price spikes before the actual move happens.
- Forcing the pattern (over-fitting): A common mistake is trying to “force” a megaphone shape onto choppy, sideways price action that lacks at least five distinct pivot points. If the higher highs and lower lows aren’t clear, you are likely trading market noise, not a pattern.
- Using tight “fixed” stop-losses: Because this pattern represents expanding volatility, a standard tight stop-loss is almost guaranteed to be hit. You must use volatility-adjusted stops (like ATR) to give the trade room to breathe.
- Anticipating the breakout: Impatience is costly. Traders often buy or sell before a candle closes outside the trendline. If the price reverses at the last second, you are trapped in a false breakout.
- Ignoring volume confirmation: A breakout without a corresponding spike in volume is often a “liquidity sweep” by institutional players. If the breakout lacks participation, the probability of a reversal is high.
12. Which Scanners and Tools Can Spot Megaphone Patterns?
Spotting these patterns manually across dozens of charts is time-consuming. Modern trading technology can help you identify potential setups, provided you use them as a filter rather than a definitive signal.
12.1. Tool Selection by Trader Type
- TradingView (best for manual validation): TradingView offers a built-in “Chart Patterns” indicator library. It is excellent for visualizing the formation on a single chart, but traders should still manually adjust trendlines to ensure they align with significant price pivots.
- TrendSpider (best for bulk scanning): This platform uses automated multi-timeframe analysis to scan thousands of assets instantly for “Broadening Wedges.” It is the preferred tool for swing traders who need to filter the entire market for high-volatility setups.
- Finviz (best for stock market overviews): While less precise, the Finviz elite scanner can filter stocks that are experiencing “Expanding Volatility,” which often precedes the completion of a megaphone pattern.
12.2. The Golden Rule of Automation
No scanner is 100% accurate. Automated tools are excellent for discovery, but they are not a substitute for manual validation.
- Use the scanner to find potential candidates.
- Manually verify the “5-point touch” rule.
- Check for fundamental catalysts (news) that might be skewing the technical shape.
- Only execute when your manual checklist and the tool’s detection align.
13. Frequently asked questions about Megaphone Pattern
To help you navigate the complexities of this pattern, here are answers to the most common questions asked by traders.
14. Conclusion
The megaphone pattern is a powerful warning that market consensus has broken down. While the widening swings can be intimidating, they offer high-reward opportunities for traders who wait for confirmation rather than chasing the chaos.
To maximize your success, always combine this pattern with other indicators like RSI, EMA, and Volume Profile for confluence to make better trading decisions. Before risking real capital, make sure to test these strategies on a demo account. Ready to master more trading patterns? Explore the comprehensive trading guides available at Piprider.


