
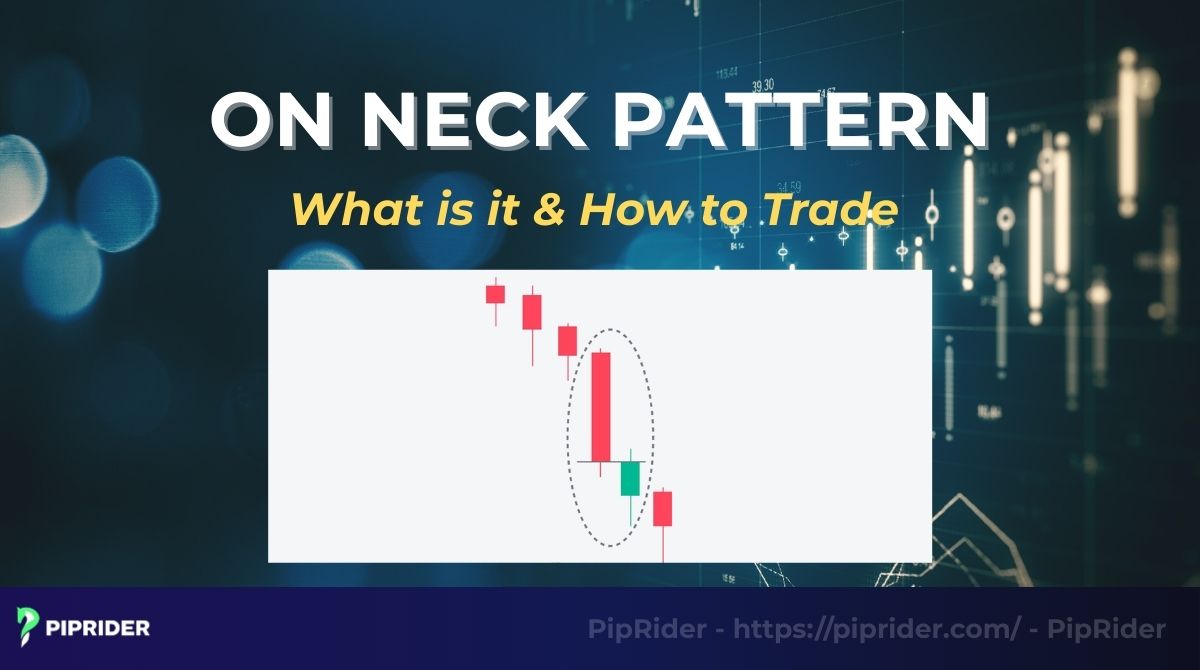
The On Neck Pattern is a bearish continuation signal often confused with reversal patterns like the Thrusting or Piercing line candlestick pattern. Understanding the on neck pattern helps traders avoid false buy signals and time their sell orders correctly during a downtrend. This guide explains how to identify the structure, interpret the psychology, and trade it effectively.
Key Takeaways
- The On-Neck Pattern appears in a downtrend and signals bearish continuation, not a reversal.
- It consists of a long bearish candle followed by a small bullish candle that closes near the previous candle’s low.
- Market psychology suggests this pattern represents a failed rally where buyers cannot push the price back up.
- Traders often confuse it with the In-Neck, Thrusting, and Piercing Patterns, which have different closing prices.
- For the best results, combine this pattern with volume, EMA trend lines, and market structure.
Quick On-Neck Rules (The 5-Second Checklist)
- The Context: The pattern must appear in a clear, established downtrend.
- The Setup (Candle 1): Must be a strong, dominant bearish body.
- The Strike (Candle 2): Must open lower (gap down) and close at or very near Candle 1’s low.
- The Invalidation: If Candle 2 closes meaningfully into Candle 1’s body, it is no longer an On-Neck pattern.
- The Trigger: The trade is only safe to execute after the price breaks below Candle 2’s low.
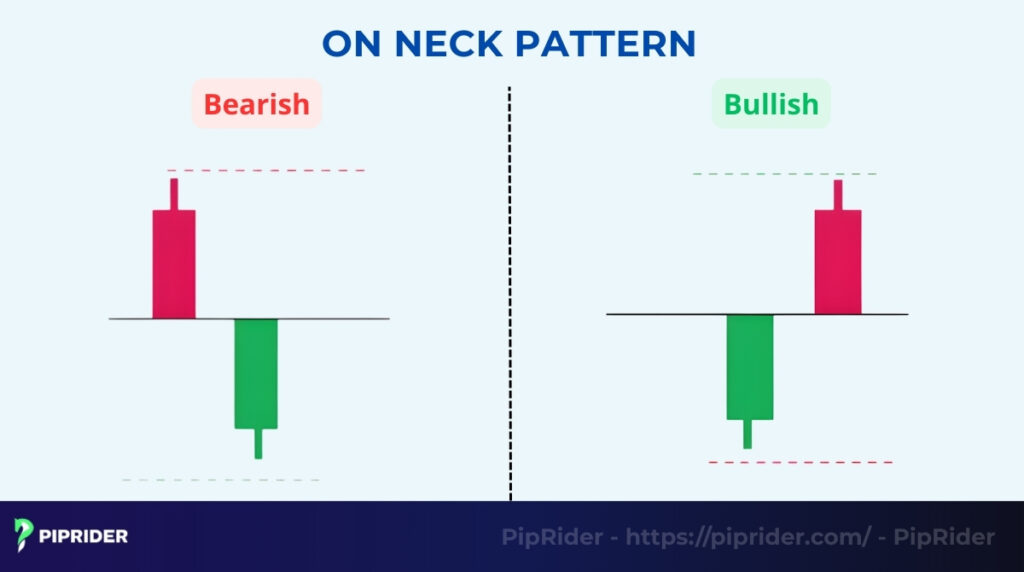
1. What Is the On-Neck Pattern?
The On-Neck Pattern is a bearish continuation candlestick pattern that appears during a downtrend. It consists of a long bearish candle followed by a smaller bullish candle that gaps down but fails to recover, closing near the previous candle’s low. As noted by Steve Nison (2001), the pioneer of candlestick charting, this structure signifies a failure of buyers to regain momentum.
In technical analysis, this pattern signals that sellers remain in control and the current price decline is likely to continue.
While many traders attempt to trade this setup in isolation, it has a specific statistical success rate that requires strict confirmation before execution (detailed in Section 8). Therefore, traders should never trade it blindly; it requires confirmation from other technical indicators or a third candle to break the low.
To confirm this candlestick pattern, look for these four specific criteria:
- Trend: The market must be in an existing downtrend.
- First candle: A long, bearish (red) candle showing strong selling pressure.
- Second candle: A smaller, bullish (green) candle that gaps down at the open.
- The close (The “neck”): The second candle rallies slightly but closes at or very near the low of the first candle. It fails to push back into the previous candle’s body.
2. Candlestick Structure of the On-Neck Pattern
To trade this pattern safely, you must recognize its exact anatomy on the price chart. If the second candle closes too high, the meaning changes entirely.
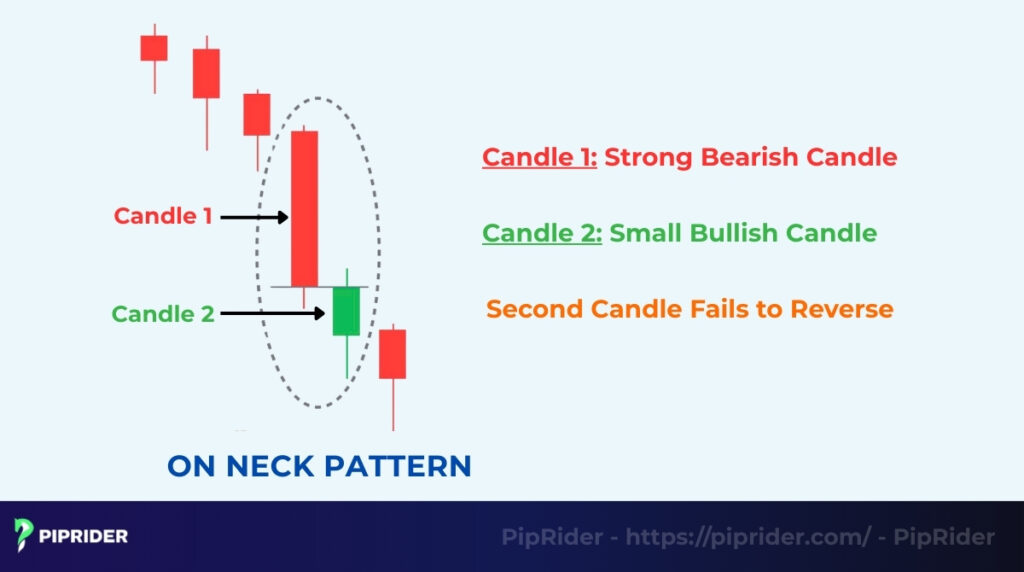
Candle 1: Strong Bearish Candle
The pattern begins with a long bearish candle (red or black) appearing within an existing downtrend. This long body represents aggressive selling pressure, confirming that bears are currently dominating the market sentiment.
Candle 2: Small Bullish Candle
The second candle opens with a gap down, creating a new low. However, a small bullish candle (green or white) forms as buyers try to step in. Crucially, this candle closes exactly at or very near the low of the first candle, not inside its body.
Key Rule: Second Candle Fails to Reverse
The most critical aspect is the failure of the second candle to push back into the previous day’s range. By closing near the previous low, it proves that the buying attempt was weak and insignificant. This inability to reverse signals that the market is simply pausing before the next leg down.
3. What Is the Market Psychology Behind the On-Neck Pattern?
Understanding why a pattern forms helps you trade it with confidence. The On-Neck candlestick pattern represents a specific psychological sequence: extreme fear, a weak attempt at a recovery, and the realization that the bearish trend is still in charge.
Traders often mistake the second green candle for a buy signal, assuming a reversal is underway. However, the On-Neck is a classic ‘bull trap.’ It signifies a failed attempt by buyers to reclaim lost ground, proving that the bearish trend remains dominant.
- Weak Buying Pressure After Strong Selling: The first long bearish candle reflects panic or aggressive selling. This represents a bearish impulsive wave. The gap down on the second day confirms that this fear is still dominant at the market open. However, after this drop, some short-sellers begin to take profits, and some aggressive “bargain hunters” step in, creating mild buying pressure.
- Short-Lived Bullish Attempt: Buyers attempt to take advantage of the low prices, pushing the market up slightly. This short-lived rally acts as a weak retracement wave. However, as the price approaches the previous day’s low, it hits a “ceiling” of resistance. The bulls lack the conviction to push the price back inside the previous candle’s range, showing that demand is very shallow.
- Bearish Momentum Preparing for Continuation: Ultimately, the failure to rise above the previous low signals to the market that the “bounce” has failed. Sellers realize that the price movement is just a pause, not a turn. This psychological defeat encourages bears to reload their short positions, preparing the market for the next leg down.
4. On-Neck vs. Similar Patterns: Which Is More Reliable?
This is the most critical section for avoiding costly mistakes. The On-Neck candlestick pattern looks nearly identical to several other formations, but the specific closing price of the second candle changes the market bias entirely—from a “strong bearish continuation” to a “potential bullish reversal.”
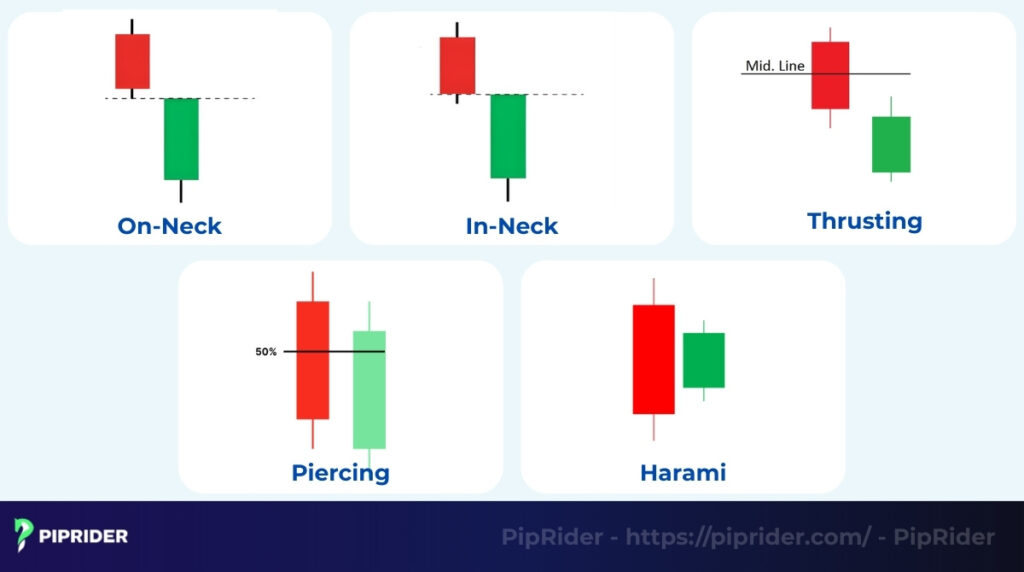
4.1. The Master Comparison Table
Use this quick-reference guide to distinguish these patterns instantly. These technical classifications and reliability rankings are based on the historical performance research of Bulkowski (2008):
| Feature | On-Neck Pattern | In-Neck Pattern | Thrusting Pattern | Piercing Pattern |
| Candle 2 Close | At/near Candle 1 low | Slightly inside body | Deep in body ( < 50%) | Above 50% midpoint |
| Buyer Strength | Zero (Absolute failure) | Weak/Insignificant | Moderate (Bull trap) | Strong (Reversal) |
| Market Bias | Strong Continuation | Continuation (Weaker) | Neutral / Bearish | Bullish Reversal |
| Reliability | Highest | Moderate | Low (Requires care) | High (Opposite signal) |
4.2. On-Neck vs. In-Neck: The Reliability Battle
Because they look almost identical, these two are the most frequently confused. In the On-Neck, buyers hit an impenetrable “ceiling” exactly at the previous low. Their failure is absolute.
In the In-Neck, buyers manage to claw their way slightly back into the previous day’s territory. While still a bearish signal, that tiny extra push from the bulls makes the immediate sell-off slightly less certain. Verdict: The On-Neck is logically a more powerful bearish signal than the In-Neck.
4.3. On-Neck vs. Piercing Pattern
This is the most dangerous confusion. While a Piercing Line starts with a gap down like the On-Neck, its close above the 50% midpoint of the red candle signals that buyers have seized control. If you mistake a Piercing Line for an On-Neck, you will likely sell exactly when the market is about to rally.
4.4. On-Neck vs. Thrusting Pattern
The Thrusting pattern is often a “bull trap.” Buyers push deeper into the first candle’s body than an On-Neck but still fail to cross the 50% midpoint. This indicates more buying pressure than an On-Neck, making it a much lower-probability short signal. You should wait for extra confirmation before trading a Thrusting pattern.
4.5. On-Neck vs. Bullish Harami
In a Bullish Harami, the second candle is “pregnant” (completely contained) within the previous candle’s body. In an On-Neck, the second candle must open with a gap down and stay below the body’s range. A Harami suggests the trend is “bottling up” for a potential reversal, whereas the On-Neck proves the bears still have total dominance.
5. How to Identify a Valid On-Neck Candlestick Pattern?
To filter out false signals, traders need a strict process. Identifying a valid On Neck pattern requires checking the prior trend, the specific shape of the candles, and the volume behavior. Follow this 5-step checklist to ensure the signal is reliable.
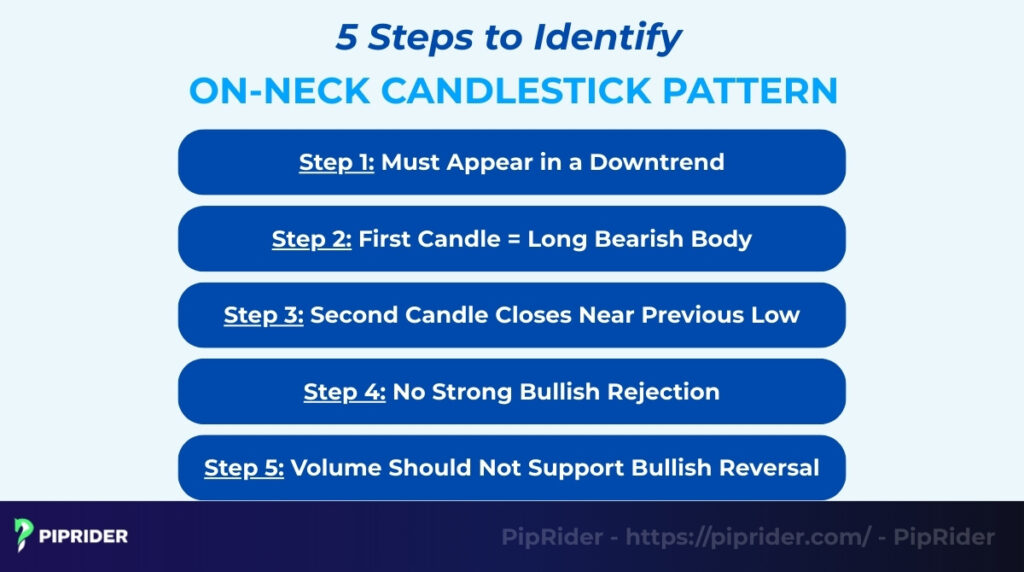
5.1. Step 1: Must Appear in a Downtrend
Context is king. Traders should only look for this pattern when the market is already making lower lows and lower highs in a strong bearish trend. If traders see this formation in a sideways or uptrending market, ignore it; it is likely just random noise.
5.2. Step 2: First Candle = Long Bearish Body
The first candle must show clear seller dominance. A long, bearish (red) body indicates that bears are firmly in control of the momentum. If the first candle is small or weak, the pattern loses its significance.
5.3. Step 3: Second Candle Closes Near Previous Low
Check the closing price carefully. The second (green) candle should close exactly at or slightly below the low of the first candle. If the close pushes up into the body of the first candle, it becomes an in-neck or thrusting pattern, which are less reliable signals.
5.4. Step 4: No Strong Bullish Rejection
Ideally, the second candle should not have a massive lower wick (shadow). A long lower wick suggests that buyers successfully pushed the price up from the lows (like a hammer pattern), which contradicts the bearish continuation thesis. Traders want a weak candle with little buying conviction.
5.5. Step 5: Volume Divergence (The Validity Check)
Volume is the “fuel” of any price move. For a valid On-Neck pattern, you must observe a clear lack of enthusiasm from buyers.
- What to look for: The second (green) candle should print on significantly lower volume than the first (red) candle.
- The Logic: A low-volume bounce proves that institutional “Smart Money” is not interested in buying; it’s likely just retail traders taking small profits.
- The Warning: If you see a green candle with high volume, the On-Neck is likely invalid. This suggests strong buying pressure and a potential trend reversal.
For a detailed breakdown of how to use Volume and other indicators to confirm your entry, refer to the Confluence section in Section 9.
6. When the On-Neck Pattern Is Weak or Invalid
Even if a candlestick formation perfectly matches the textbook shape of an On-Neck, the surrounding market context can render it entirely invalid. Knowing when to skip a setup is a critical survival skill.
You should immediately discard the On-Neck pattern and avoid shorting if you observe any of the following warning signs:
- Context Failure (Sideways Market): The pattern appears in a ranging, choppy, or uptrending market. The On-Neck relies on existing downward momentum. In a sideways market, a red candle followed by a small green candle is just random market noise, not a continuation signal.
- Weak Setup (Undersized First Candle): The first bearish candle is small or average-sized. The psychology of this pattern requires the “shock” of aggressive panic selling. Without a long, dominant red candle, there is no strong bearish momentum to continue.
- Structural Failure (Closing Too Deep): The second candle closes meaningfully inside the body of the first candle. The moment the close pushes into the previous day’s range, the “weak bounce” thesis is destroyed, and the pattern morphs into a Thrusting or Piercing line.
- Price Action Rejection (Long Lower Wick): The second (green) candle prints a long lower shadow (like a Hammer or Pin Bar). A long tail indicates that buyers aggressively stepped in at the lows to reject the drop. This shows strong buying conviction, which completely contradicts the On-Neck logic.
- Volume Anomaly (High Volume on Candle 2): There is unusually high trading volume on the small green candle. A valid On-Neck should have low volume on the bounce, showing a lack of retail interest. High volume on a green candle warns that “Smart Money” or institutions might be quietly accumulating positions for a reversal.
7. How to Trade the On-Neck Pattern: The Entry Decision Guide
Identifying the pattern is only half the battle; executing the trade requires aligning the setup with your personal risk tolerance and trading psychology. Instead of a “one-size-fits-all” approach, choose the entry method below that best matches your trader profile.
Strategy Summary:
| Entry method | Risk level | Best for |
| Break Candle 2 low | Medium | Beginner / momentum trader |
| Retest Candle 2 close | Lower | Conservative trader |
| EMA-filtered entry | Lower | Trend-following trader |
7.1. The Breakout Entry (Best for Beginners & Momentum Traders)
This is the standard, most reliable execution method. You do not try to predict the drop; you force the market to prove that the sellers have officially resumed control.
- The Execution: Place a Sell Stop order strictly 1-2 pips below the lowest point of the second (green) candle.
- Why it fits this profile: Beginners often struggle with false signals. By waiting for the actual breakdown, you avoid being trapped if the green candle unexpectedly continues to rally. It sacrifices a few pips of profit margin in exchange for high-probability confirmation.
7.2. The Retest Entry (Best for Patient, Advanced Traders)
Also known as the “Pullback” entry, this method requires strict discipline and the willingness to occasionally miss a trade if the market drops too fast.
- The Execution: Wait for the third candle to open. Let it rally slightly to retest the closing price of the second candle (the “neckline”). If price stalls there, execute a manual Sell order.
- Why it fits this profile: Patient traders use this to drastically improve their Risk-to-Reward (R:R) ratio. By entering higher up on the wick of the third candle, you can place a much tighter Stop Loss. However, it requires advanced screen-time to read real-time price rejection.
7.3. The EMA-Filtered Entry (Best for Conservative, Trend-Following Traders)
This method ignores standalone candlestick patterns and focuses on the macroeconomic flow. It uses the 20-period or 50-period Exponential Moving Average (EMA) as a strict gatekeeper.
- The Execution: Only validate the On-Neck pattern if both candles close cleanly below a downward-sloping 20 EMA or 50 EMA. If the pattern forms above the EMA, or if the EMA is flat, the trade is instantly discarded.
- Why it fits this profile: Conservative traders prioritize capital preservation. The EMA filter protects them from entering short positions during short-term counter-trend bounces or noisy, sideways consolidation periods.
7.4. Stop Loss Placement (Risk Management)
A false breakdown is always a possibility, even with perfect setups. Your Stop Loss (SL) should be placed at the exact level where the “bearish continuation” thesis is mathematically proven wrong.
- The Aggressive/Tight Stop: Place the SL exactly above the high of the second (green) candle. If buyers manage to push the price above this tiny bounce, the On-Neck pattern is instantly invalidated. This offers a great R:R ratio but runs the risk of being “hunted” by minor market volatility.
- The Conservative/Structural Stop: Place the SL above the high of the first (long bearish) candle, or just above the EMA filter. This gives the trade “room to breathe” and protects your position against normal intraday fluctuations, though it requires a smaller position size to balance the wider pip risk.
7.5. Take Profit Targets (Exit Strategy)
The On-Neck is a momentum continuation pattern, meaning you are trying to catch a fast, aggressive drop. Establish your exit goals before entering the trade:
- Target 1: Historical Support (Market Structure): Look left on your chart. The most logical place to take profits is the next major structural support zone or previous swing low, as buyers will naturally defend these levels.
- Target 2: The Measured Move (1:1 Projection): Calculate the exact height (in pips) of the first bearish candle. Project that same distance downward from your Entry point. This targets a symmetrical leg down, assuming the momentum equals the initial drop.
- Target 3: Trailing the EMA: If you caught the On-Neck on a Higher Timeframe (e.g., Daily chart) and a massive trend is unfolding, do not set a fixed TP. Instead, trail your Stop Loss downwards along the 20-period EMA, only exiting when the price eventually closes back above the moving average.
8. The Hard Truth: How Reliable Is the On-Neck Pattern?
While the On-Neck pattern is logically sound, statistical reality requires traders to manage their expectations.
Statistical Reality Check: According to extensive backtesting by technical analysis pioneer Thomas Bulkowski, the On-Neck pattern has a base success rate of approximately 56% when predicting bearish continuations (Remesh, 2025).
In the trading world, a 56% win rate provides a mathematical edge, but it is certainly not strong enough to trade blindly. Professional traders treat the On-Neck as a continuation clue, rather than a standalone execution signal.
To transform this moderate base rate into a high-probability setup, you must layer contextual filters over the pattern:
- As a Standalone Setup (Moderate Reliability): If traded in isolation based purely on the shape of the two candles, the results are barely better than a coin toss. False signals and whipsaws are frequent.
- With Trend Alignment (High Reliability): Reliability increases significantly when the pattern forms inside a macro, higher-timeframe downtrend (e.g., Daily or Weekly charts), rather than a short-term intraday dip.
- With Volume Confirmation (Stronger Edge): The setup becomes highly trustworthy when the second (bullish) candle prints on noticeably weaker trading volume, mathematically proving that the “bounce” lacks real institutional demand.
- With Breakdown Execution (Safest Approach): The win rate peaks when traders completely ignore the pattern until the price decisively breaks below the second candle’s low, effectively filtering out premature entries and traps.
9. Which Indicators Confirm the On-Neck Pattern? (Confluence)
Professional traders rarely execute trades based on isolated candlestick patterns. They rely on “confluence”—the alignment of multiple technical indicators telling the exact same story. Stacking these confirmations significantly increases your win rate.
Here is your quick confirmation cheat sheet:
| Indicator | What to Look For | Why It Matters |
| Volume | Decreasing on Candle 2 | Mathematically proves a lack of institutional buying demand. |
| RSI | Below 50 (but > 30) | Confirms bearish momentum dominates without being severely oversold. |
| MACD | Bearish (Lines fanning down) | Validates that the macroeconomic trend is accelerating downward. |
| Trendline | Rejection at Resistance | Adds spatial and structural geometry to the trade setup. |
9.1. Volume Profile (The Ultimate Validator)
Volume analysis is your absolute first validity check. You want to see significantly lower trading volume on the second (green) candle compared to the first (red) candle. This volume divergence confirms that the “buying” attempt is weak, unenthusiastic, and merely retail noise lacking the institutional support needed to reverse the trend.
9.2. RSI Below 50 (Momentum Check)
Check the Relative Strength Index (RSI) to ensure the broader bearish momentum supports your trade. If the RSI is below 50 (bearish territory) but not yet extremely oversold (e.g., still above 30), it indicates that bears are firmly in control and there is still plenty of “room to fall” before price hits a mathematical floor.
9.3. MACD (Trend Acceleration)
The MACD (Moving Average Convergence Divergence) verifies that momentum is aligned with the price drop. Look for the MACD histogram to remain negative or for the signal lines to be actively spreading apart downward. If the MACD lines are crossing up (bullish divergence) while the On-Neck forms, cancel the trade immediately—the trend is likely exhausted.
9.4. Trendline or Channel Geometry
Geometry provides excellent structural confluence. If the On-Neck pattern forms precisely at the resistance boundary of a descending channel or a macro trendline, the signal is exponentially stronger. In this scenario, the pattern acts as the specific price-action “trigger” to sell off that major resistance ceiling.
10. Best Timeframes for the On-Neck Pattern
Candlestick patterns are visual representations of order flow and market psychology. As a general rule in technical analysis, the more time that goes into forming a candle, the more reliable its signal. Because the On-Neck relies on a specific psychological sequence (panic selling, a weak bounce, and continuation), it performs very differently across various timeframes.
- Daily (D1) and 4-Hour (H4) Charts (Highly Reliable): This is the “sweet spot” for the On-Neck pattern. At these macro-structural and institutional levels, the pattern reflects true order flow. The “weak bounce” of the second candle is highly significant because it shows that over a period of 4 to 24 hours, buyers simply could not muster the capital to push the price up.
- 1-Hour (H1) Charts (Moderate): This timeframe is usable for intraday swing trading, but it requires stricter filtering. You must ensure the H1 pattern aligns perfectly with the overarching H4 or Daily downtrend.
- 15-Minute (M15) and 5-Minute (M5) Charts (Prone to Noise): Lower timeframes are heavily influenced by algorithmic trading, spread fluctuations, and intraday volatility. A red-green candle sequence on an M5 chart is often just random “noise” rather than a true structural continuation. False breakouts are extremely common here.
- The Golden Rule for Lower Timeframes: If you are a day trader using the M15 or M5 charts, you should only trade the On-Neck pattern if it meets strict contextual criteria:
- Macro Alignment: The higher timeframe (H1/H4) is firmly bearish.
- Momentum: There is a strong, undeniable downward impulsive wave prior to the pattern.
- Session Context: The pattern forms during high-volume, high-liquidity trading hours (e.g., the London or New York session opens), where true market direction is established.
11. What Do Real On-Neck Setups Look Like? (Execution Scenarios)
To bridge the gap between textbook theory and real-world execution, let’s review three illustrative trading scenarios across different asset classes.
> Note: The following are simulated case studies based on the typical price-action behavior of these assets. They are designed to demonstrate the exact mechanics of trade execution, context filtering, and risk management.
11.1. Scenario 1: Forex (EUR/USD) – The High-Probability Setup
In this scenario, the EUR/USD pair is in an established macroeconomic downtrend, consistently trading below the 50-period EMA on the 4-Hour chart.
- Pattern location: The pattern forms after a strong bearish impulse wave, right after rejecting a minor resistance zone.
- Confirmation trigger: The 4H session closes, and the green candle perfectly matches the low of the previous red candle without leaving a long lower wick. Volume is noticeably weak.
- Entry: A Sell Stop order is placed exactly 2 pips below the low of the second (green) candle to catch the breakdown.
- Stop loss: Placed strictly above the high of the first (red) bearish candle (a Conservative structural stop).
- Target: The next major Daily support level, yielding a favorable 1:2.5 Risk/Reward ratio.
- Why the setup works: Total alignment. The macroeconomic trend, the EMA filter, and the weak volume on the bounce mathematically confirm absolute buyer exhaustion. When the low breaks, trapped early buyers are forced to liquidate, accelerating the drop to the target.
11.2. Scenario 2: Stocks (AAPL) – The Aggressive Momentum Play
Imagine AAPL is undergoing a broader market correction, characterized by lower highs and lower lows on the Daily chart.
- Pattern location: The stock gaps down at the open, creating the second candle of the pattern, but hits a ceiling at the previous day’s low.
- Confirmation trigger: The Daily session closes with the green candle completely unable to push back into the previous day’s real body.
- Entry: Market Sell (Short position) executed at the open of the following trading day, immediately after the price breaches the pattern’s low.
- Stop loss: Placed tightly just above the high of the second green candle (an Aggressive stop to protect capital if the stock bounces).
- Target: A Measured Move calculation, projecting the exact height of the first bearish candle downward.
- Why the setup works: Retail traders attempt to “buy the dip” at the open gap, but institutional selling pressure immediately caps the rally. The tight stop loss minimizes risk, while the momentum easily carries the price to the measured target.
11.3. Scenario 3: Crypto (BTC/USD) – The Bear Trap (A Failed Setup)
BTC experiences a massive, rapid flash crash. However, the overarching macroeconomic trend on the Weekly chart is actually bullish (this is a deep pullback, not a true downtrend).
- Pattern location: The On-Neck pattern forms exactly at a major, historical Daily support floor (e.g., the $50,000 psychological level).
- Confirmation trigger: The shape of the pattern is perfect, but the second (green) candle prints with unusually high volume.
- Entry: A Sell Stop order is triggered as the price briefly wicks below the second candle’s low.
- Stop loss: Placed above the high of the second green candle.
- Target: The next major support zone downward.
- Why the setup fails: This is a classic “Bear Trap.” Despite the perfect visual shape of the On-Neck, the context is entirely wrong. The pattern forms at major structural support during a macro uptrend, and the high volume on the green candle indicates that “Smart Money” is actually absorbing the panic selling. The price briefly triggers the short entry, immediately reverses, and hits the Stop Loss.
- The Takeaway: Context always overrides the pattern’s shape. Never short into major support on high volume.
12. How to Avoid False Bullish Signals (The Reversal Trap)
The most dangerous aspect of the On-Neck pattern is its visual deception. Novice traders frequently spot the second candle (the green one) and instinctively assume a market bottom is forming. This “reversal trap” is a primary reason why counter-trend traders blow up their accounts.
To protect your capital, you must reprogram how you interpret price action. Strictly avoid buying into an On-Neck formation by internalizing these three rules:
- The “Color Trap” Illusion: In a strong downtrend, a small green candle does not automatically equal new institutional demand. Often, it is simply short-sellers taking brief profits (covering their positions), which creates a temporary, artificial bounce. Once they finish taking profits, the aggressive selling resumes.
- The 50% Reclaim Rule: Do not even consider a long position unless the green candle aggressively reclaims territory. To signal a true shift in momentum, buyers must push the price at least halfway up into the previous red candle’s body (creating a Piercing Pattern). If the close remains at or below the prior low, the bulls have achieved absolutely nothing.
- The Macro Context Override: Trying to buy a tiny green candle in the middle of a dominant, higher-timeframe downtrend is like trying to catch a falling knife. Unless the macro market structure has explicitly shifted to creating “higher highs and higher lows,” every small bullish bounce should be viewed as a premium selling opportunity, not a buy signal.
Core Rule: Never buy a downtrending market simply because a single candle closed green. Wait for structural confirmation.
13. Which Tools Can Automatically Detect the On-Neck Pattern?
Finding these small patterns manually across hundreds of charts is difficult and prone to error. Modern trading platforms offer automated tools to detect them for you instantly.
- TradingView (Built-in Scanner): You can use the built-in indicator called “All Candlestick Patterns”. Simply add it to your chart and check the settings to enable detection for the On-Neck pattern specifically.
- MT4/MT5 (Custom Indicators): MetaTrader does not detect this by default, but you can download custom tools from the MQL5 Market. Look for indicators named “Candlestick Pattern Scanner” or “CPI”, which can scan multiple pairs and alert you when an On-Neck pattern forms.
- TrendSpider (Automated Recognition): This platform specializes in automation. Its “Market Scanner” feature allows you to search thousands of stocks in seconds to find any ticker currently displaying an On-Neck formation, saving you hours of manual analysis.
14. Frequently asked questions about On-Neck Pattern
15. Conclusion
The On Neck Pattern is a specific but powerful bearish continuation signal. While it looks like a small recovery, it actually reveals that buyers are too weak to reverse the trend.
For the highest win rate, never trade it in isolation. Combine it with trend lines, support levels, volume analysis, and momentum indicators. Most importantly, ensure you distinguish this candlestick pattern from the bullish Piercing Pattern to avoid costly mistakes.
Ready to master candlestick patterns? Explore the comprehensive trading strategies and guides at Piprider today.


