

The Golden Cross Pattern is a popular and widely used long-term trend confirmation signal utilized by traders across stock, forex, and crypto markets to identify potential uptrends. Learning how to trade the golden cross involves spotting when short-term momentum rises above the long-term average. This guide explains how to identify these signals and manage the risks associated with market “whipsaws”.
Key Takeaways
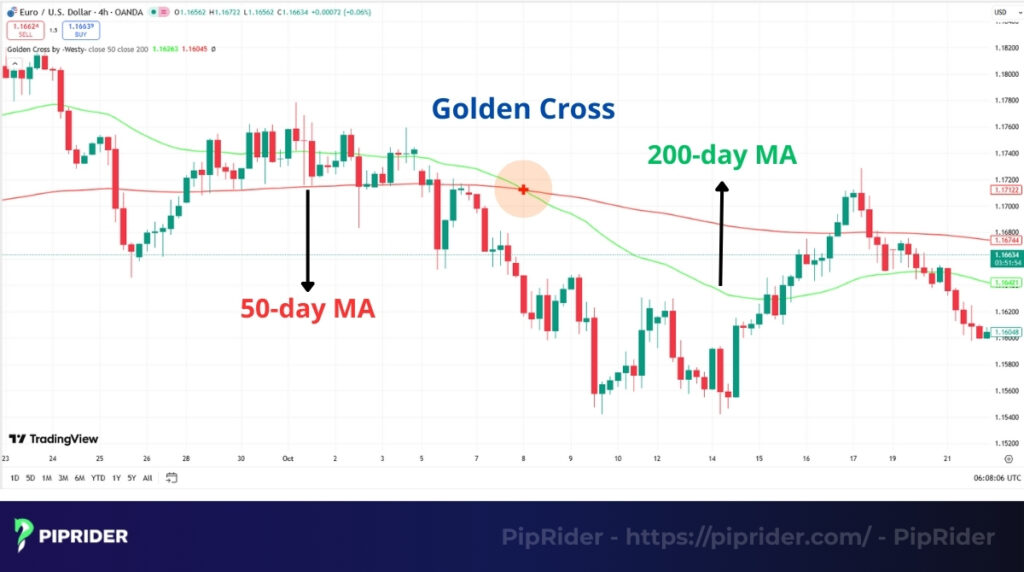
- A Golden Cross occurs when the 50-day moving average crosses above the 200-day moving average.
- It signals the potential start of a long-term bullish market phase.
- The signal is often considered more reliable when confirmed by high trading volume, RSI, or MACD.
- Traders typically avoid using this pattern in sideways or range-bound markets to prevent losses.
- Common strategies include buying the breakout, waiting for a retest, or long-term trend following.
1. What Is the Golden Cross Pattern?
The Golden Cross Pattern is a bullish technical chart pattern that suggests a potential shift in market momentum toward a long-term uptrend. It occurs when a security’s short-term moving average crosses above its long-term moving average, reflecting a period where recent prices are higher than the historical average.
Traders view this as a notable signal because it indicates that short-term buying pressure is beginning to outweigh the long-term trend. The classic Golden Cross utilizes two specific Simple Moving Averages (SMA), typically the 50-day and 200-day periods (The Motley Fool, 2022):
- The 50-day MA: Represents the short-term trend and price momentum over the last 10 weeks.
- The 200-day MA: Represents the long-term trend and is a key level watched by institutional investors.
The signal triggers exactly when the 50-day moving average crosses up and over the 200-day moving average. Psychologically, this crossover represents a shift in market sentiment. The 200-day MA is widely regarded as a major support or resistance level; when the shorter-term average moves above it, it confirms that the “path of least resistance” may have shifted upward.
Golden Cross vs. Death Cross
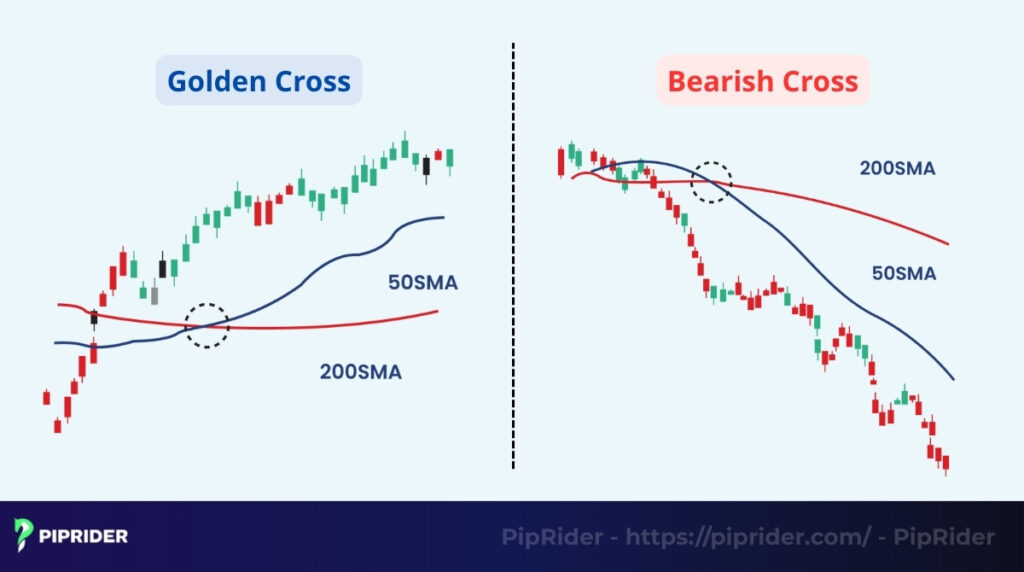
To understand the Golden Cross, traders must distinguish it from its bearish counterpart, the Death Cross. Both are “lagging” indicators, meaning they confirm a trend that has already begun rather than predicting the exact bottom or top (Phemex Academy, 2020)
- Golden Cross: 50 MA crosses above 200 MA (Bullish Signal).
- Death Cross: 50 MA crosses below 200 MA (Bearish Signal).
While the Golden Cross signals the potential start of a multi-month or multi-year uptrend, the Death Cross pattern signals serves as a warning that a long-term downtrend or “bear market” may be starting.
2. How Does the Golden Cross Pattern Work?
The Golden Cross is not a single point in time; it is the culmination of a trend shift that develops over several weeks or months. To identify and trade it effectively, it is helpful to understand the three distinct phases of its formation.
2.1. Phase 1: Downtrend Weakening (The Setup)
Before a Golden Cross can occur, the existing downtrend must lose momentum. In this phase, selling pressure begins to exhaust. You will often see the price stop making lower lows and instead start to form a sideways base or a higher low. On the chart, the 50-day and 200-day moving average lines begin to flatten out as the gap between them stops widening.
2.2. Phase 2: The Convergence (Building Momentum)
As buying interest increases, the price begins to climb. This causes the short-term 50-day moving average to curve upward and approach the 200-day moving average from below. This “convergence” indicates that short-term momentum is strengthening relative to the long-term historical average.
2.3. Phase 3: The Breakout (The Crossover)
This is the signal event. The 50-day moving average crosses decisively above the 200-day moving average. This confirms a bullish breakout. Once the crossover is complete, the 200-day MA often transitions from a level of resistance into a new dynamic area of support, where buyers may step in during future price dips.
3. What Are the Different Types of Golden Cross Patterns?
While the 50/200-day SMA combination is the industry standard for long-term investors, traders often adapt the parameters to suit their specific goals or market conditions.
- The Classic Golden Cross (50/200 SMA): This is the most widely watched variation, tracked by major financial institutions and funds. It is highly reliable for identifying major market cycles but is a lagging indicator, meaning the price has often already risen significantly by the time it triggers.
- The Short-Term Golden Cross (20/50 MA): Swing traders often use a faster combination (e.g., a 20-day crossing a 50-day) to capture medium-term trends. These signals appear much earlier than the classic cross, though they are more susceptible to false signals (whipsaws).
- The Multi-Timeframe Golden Cross: This involves looking for crossovers on longer intervals, such as a weekly chart (e.g., 10-week crossing 40-week). A weekly Golden Cross is generally viewed as a much stronger signal of a major structural shift in the market.
- The High-Volume Golden Cross: This refers to the quality of the signal rather than a change in settings. When a crossover occurs alongside a significant expansion in trading volume, specifically in stocks or futures markets, it suggests strong conviction from market participants, increasing the probability of a sustained trend.
4. How to Identify a Valid Golden Cross Pattern
Identifying the crossover is straightforward, but distinguishing a high-probability signal from a “fakeout” requires careful analysis. Because moving averages are lagging indicators, they can produce misleading signals in choppy or non-trending markets. Use this checklist to validate the strength of the signal.
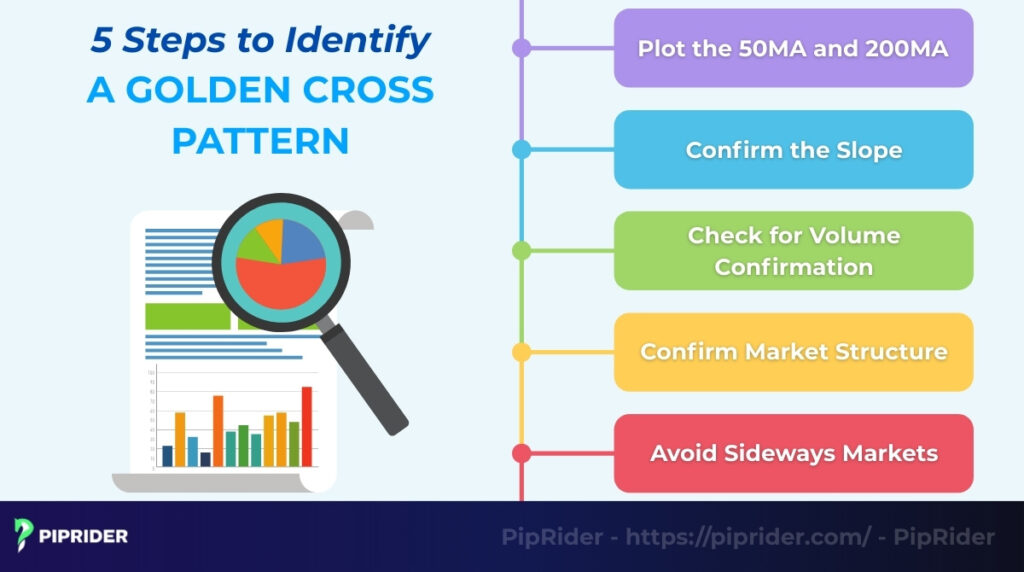
4.1. Step 1: Plot the 50MA and 200MA
Set up your chart using Simple Moving Averages (SMA). For the classic signal, use the daily timeframe. Typically, the 50-day MA is colored for visibility (e.g., blue) and the 200-day MA is a distinct color (e.g., red).
4.2. Step 2: Confirm the Slope of the Averages
The angle of the moving averages provides insight into trend strength. For a high-quality signal, the 50-day MA should be clearly sloping upward. Ideally, the 200-day MA should be flattening out or beginning to turn upward. If the 200-day MA is still pointing steeply downward, the long-term bearish momentum may still be too strong for the cross to hold.
4.3. Step 3: Check for Volume Confirmation
Volume acts as a validator for the move.
- For Stocks and Futures: Look for a noticeable spike in volume on the day of the crossover. This suggests institutional participation. A cross on low volume in these markets is often viewed with skepticism.
- For Spot Forex: Since the FX market is decentralized, “volume” data is often a proxy or tick volume (BabyPips, 2021). In this case, volume should be used as supporting evidence rather than a definitive filter. Traders often prioritize price structure and the slope of the 200-day MA over volume in spot FX.
4.4. Step 4: Analyze Market Structure
Price action should confirm what the indicators are suggesting. Before the crossover happens, the market should ideally be showing signs of a new trend, such as making higher highs and higher lows. This physical change in price structure often precedes the lagging indicator’s confirmation. Mastering stock market trend analysis allows you to see these structural shifts in real-time.
4.5. Step 5: Avoid “Braid” in Sideways Markets
In a sideways or range-bound market, moving averages lose their effectiveness. The 50-day and 200-day lines may “braid” together, crossing back and forth repeatedly without a sustained trend. A valid Golden Cross typically emerges after a clear bottoming process or a consolidation base, rather than in the middle of a horizontal range.
The Golden Cross Quality Checklist
To reduce the risk of “whipsaws,” professional traders often look for these three high-quality filters:
- Price Position: The price is trading above the 200-day MA, and the 200-day MA is relatively flat or dicing upward.
- Post-Base Crossover: The cross occurs after the price has broken out from a clear base or bottoming structure, not within a messy range.
- Trend Strength (ADX): Using an indicator like the Average Directional Index (ADX), a reading above 25 confirms that a trend is strong enough to be tradeable.
5. How to Trade the Golden Cross Pattern
Identifying a valid crossover is only the first step; the real challenge lies in execution. Because moving averages are lagging indicators, the price has often already rallied significantly by the time the cross physically occurs on the chart. To avoid “chasing the market” or getting caught in a bull trap, traders must use a systematic playbook that defines clear entry, exit, and risk parameters.
The following four strategies offer different approaches to capitalizing on the Golden Cross, ranging from aggressive momentum plays to conservative entries based on price retests.
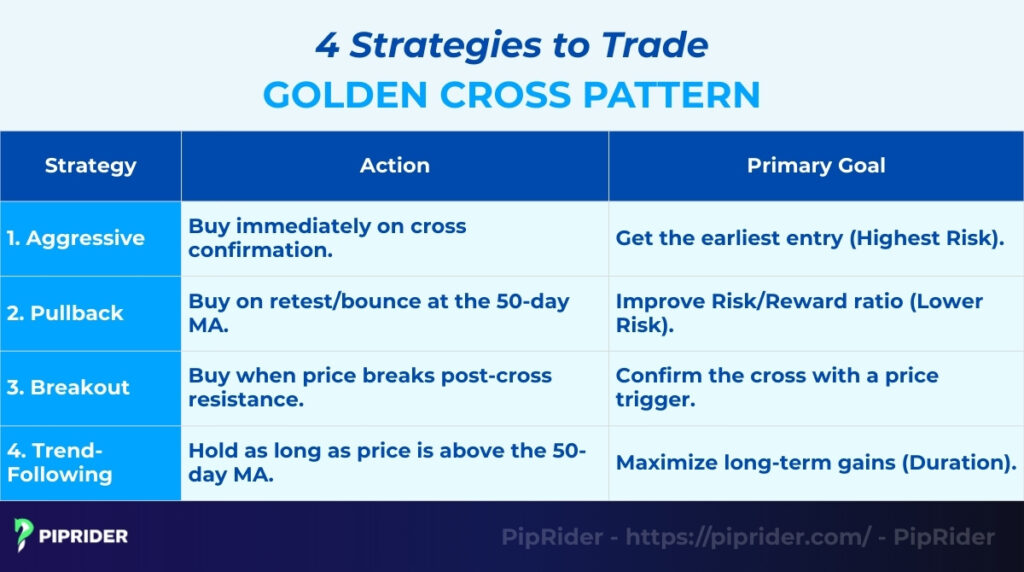
5.1. Strategy 1: The Aggressive Entry (Breakout Momentum)
This strategy is designed for traders who want to capture the trend as soon as it is confirmed, ensuring they don’t miss the initial surge.
- Entry Trigger: Buy at the daily candle close once the 50-day MA is confirmed to have crossed above the 200-day MA.
- Stop Loss (SL): Place just below the most recent swing low or the 200-day MA to protect against immediate reversals.
- Take Profit (TP): Target the next major horizontal resistance level or employ an ATR-based trailing stop to maximize gains.
- Invalidation Rule: Exit the trade if the price achieves a daily close back below the 200-day MA.
5.2. Strategy 2: The Pullback Entry (The Retest)
A more conservative approach that seeks a better risk-to-reward ratio by waiting for the market to “cool off” after the initial breakout.
- Entry Trigger: Wait for the price to dip and “retest” either the 50-day MA or the 200-day MA (which often flips from resistance to support). Enter only when a bullish reversal candle (e.g., a hammer or bullish engulfing) forms at these levels.
- Stop Loss (SL): Place below the recent swing low with a small buffer to account for market noise.
- Take Profit (TP): Target the previous local high or the next significant weekly resistance zone.
- Invalidation Rule: Close the position if the price breaks and closes decisively below the 200-day MA.
5.3. Strategy 3: The Resistance Breakout Confirmation
This method adds an extra layer of price action confirmation to filter out “weak” crossovers that lack follow-through.
- Entry Trigger: Identify the local resistance high formed during the crossover process. Enter a long position only when the price breaks and closes above this specific level.
- Stop Loss (SL): Place below the breakout candle’s low or the recently broken resistance level (now acting as support).
- Take Profit (TP): Use Fibonacci extension levels (e.g., 1.272 or 1.618) as potential targets for the new trend.
- Invalidation Rule: Close the trade if the price falls back into the previous consolidation range (a “false breakout”).
5.4. Strategy 4: The Long-Term Trend Ride
Best suited for position traders or investors looking to hold for months or even years.
- Entry Trigger: Standard entry upon crossover confirmation, focusing on the macro trend.
- Stop Loss (SL): Use a dynamic trailing stop based on the 200-day MA to give the trade enough “room to breathe” during minor corrections.
- Take Profit (TP): No fixed target; the goal is to stay in the trend as long as it remains intact.
- Invalidation Rule: Exit the position only when a “Death Cross” (50 MA crossing back below 200 MA) occurs or if the market structure shifts to a series of lower lows.
6. Which Indicators Best Confirm the Golden Cross Pattern?
In isolation, a Golden Cross can sometimes produce “whipsaws”—false signals where the averages cross but the trend fails to materialize due to a lack of momentum. Professional traders seek confluence by layering secondary technical tools to validate the strength and sustainability of the move.
| Indicator | What to Look For | Why It Matters |
| Volume | Increasing or spiking on the crossover | Confirms institutional “buying pressure” and conviction |
| RSI | Above 50, but not yet above 70 | Shows bullish momentum without being “overbought” |
| MACD | Bullish Crossover (MACD line > Signal line) | CConfirms that momentum speed is accelerating |
| ADX | Above 25 and rising | Filters out “noisy” sideways markets; confirms a trending state |
6.1. Volume (The Fuel of the Trend)
Volume serves as the ultimate validator. In a healthy Golden Cross, you want to see a clear expansion in trading activity as the 50-day MA approaches and crosses the 200-day MA. This suggests that “smart money” is actively driving the price higher.
Forex Context: Since the spot FX market is decentralized, use Tick Volume or the On-Balance Volume (OBV) indicator to gauge whether the accumulation phase is strong enough to support a long-term rally.
6.2. RSI (Relative Strength Index)
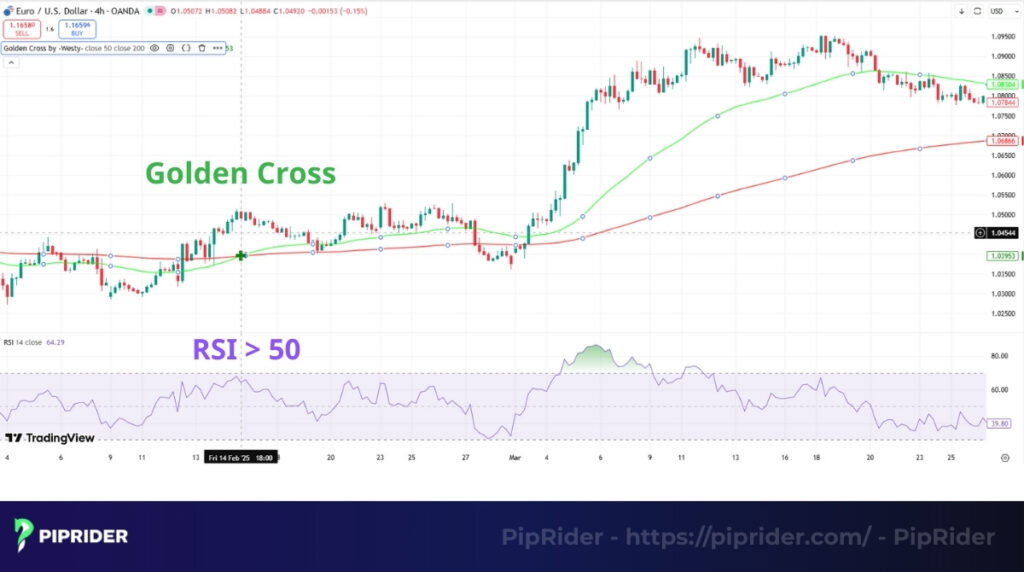
The RSI helps traders identify if a Golden Cross is occurring at an efficient price or if the market is overextended.
- Ideal Scenario: An RSI between 50 and 65 suggests the trend is bullish but still has “room to run.”
- The Overbought Risk: If the RSI is already above 70 during the cross, a mean reversion (pullback) is likely. In this case, waiting for a “Pullback Entry” (Strategy 2) is a higher-probability move than buying the breakout immediately.
6.3. MACD (Moving Average Convergence Divergence)
The MACD is an excellent tool for catching trend changes slightly before they become obvious in the moving averages. A bullish MACD crossover occurring below or near the zero line often acts as a “leading” signal that a Golden Cross is imminent. When these two signals align, it provides powerful confluence that the sentiment shift is genuine.
6.4. ADX (Average Directional Index)
The biggest weakness of the Golden Cross is its tendency to fail in range-bound (sideways) markets. The ADX helps filter out these low-probability environments.
- The Rule of 25: If the ADX is below 20, the market is likely “choppy,” and any crossover should be viewed with skepticism.
- Trend Confirmation: A rising ADX line that breaks above 25 confirms that the new uptrend has sufficient directional strength to overcome minor selling pressure and sustain its move.
7. How Does the Golden Cross Compare to Similar Signals?
Traders often use various signals to confirm entries. Understanding the structural differences between these indicators helps in selecting the right tool for different market conditions.
Here is a quick comparison:
| Signal | Type | Key Difference |
| Golden Cross | Trend | Uses specific 50/200 SMA settings. Aimed at identifying major, long-term structural shifts |
| General MA Cross | Trend | Can use any period (e.g., 9/21 EMA). Generates faster signals but is prone to significantly more noise |
| Trendline Break | Price Action | A leading signal based on geometry. Usually occurs before moving averages cross |
| Momentum (MACD/RSI) | Momentum | Measures the velocity of price change rather than just the directional trend. |
7.1. Golden Cross vs. General Moving Average Crossovers
A “Golden Cross” refers specifically to the 50-day and 200-day SMA crossover. While shorter combinations like the 9-day and 21-day averages are popular for swing trading, they do not carry the same institutional weight. The 50/200 cross is a “macro” signal that often dictates the bias for large mutual funds and pension funds.
7.2. Golden Cross vs. Trendline Breakout
Trendline breakouts are leading signals derived from price action. Often, a price will break its diagonal resistance weeks before the moving averages physically cross. Experienced traders sometimes use the trendline break as an initial entry and use the subsequent Golden Cross as confirmation.
8. What Do Real Historical Examples Look Like?
Analyzing past market cycles provides context on how this lagging indicator performs during major trend reversals.
8.1. S&P 500 (2020 Post-COVID Recovery)
Following the sharp market decline in early 2020, the S&P 500 stabilized and began a rapid recovery. Investopedia (2020) notes that in July 2020, the index produced a Golden Cross. This signal served as a formal confirmation for many institutional investors that the “bear market” phase had ended. While the crossover happened after the price had already risen from its lows, it preceded a steady bullish trend that continued throughout 2021.
8.2. Bitcoin (2020 Bull Run)
In the cryptocurrency market, the Golden Cross is a highly publicized event. In May 2020, Bitcoin’s 50-day MA crossed above its 200-day MA (Phemex Academy, 2020). This signal occurred as Bitcoin was consolidating after its “halving” event. Following the cross, the price maintained its bullish structure, eventually leading into the significant rally of late 2020 and early 2021.
8.3. Tesla (2019 Structural Shift)
Tesla provided a classic example of a structural trend change in late 2019. After nearly two years of range-bound price action, the stock flashed a Golden Cross in November 2019 (Markets Insider, 2021). This coincided with a shift in the company’s fundamental outlook and signaled the beginning of a multi-year period of aggressive expansion in stock price.
9. What Are the Common Mistakes Traders Make with the Golden Cross?
Even with a historically significant pattern, execution errors can lead to avoidable losses.
- Treating it as a Crystal Ball: The Golden Cross is a lagging indicator. It tells you what has happened to confirm a trend, not what will happen with 100% certainty. Trading it blindly without checking for overhead resistance or fundamental context can lead to “bull traps.”
- Ignoring the Volume Filter: In centralized markets like stocks, volume provides the “conviction” behind the move. A crossover that happens on thin or declining volume suggests a lack of institutional interest and has a higher probability of failing.
- Trading in Non-Trending Markets: Moving averages are designed for trending environments. If a market is moving horizontally (range-bound), the averages will flatten and “braid,” producing multiple false crossovers. Always ensure the market has a clear structural bias before acting on a cross.
- Chasing Overextended Moves: By the time the 50 MA crosses the 200 MA, the price has often already rallied significantly. Buying immediately at the cross after a parabolic move increases the risk of being caught in a natural “mean reversion” pullback. Waiting for a retest of the MA (Strategy 2) is often a more sustainable approach.
10. Which Tools Can Help You Detect the Golden Cross Automatically?
Scanning thousands of charts manually is inefficient. Modern trading platforms provide automated tools to alert you to moving average crossovers instantly.
- TradingView Alerts: This is a standard tool for monitoring specific assets. You can configure an alert on any chart (e.g., BTC/USD or AAPL) to notify you via push notification or email at the exact moment the short-term moving average crosses above the 200MA.
- TrendSpider (Algorithmic Detection): Designed for automated technical analysis, TrendSpider’s Market Scanner can search entire indices in seconds to identify assets that have triggered a Golden Cross within a specific timeframe (TrendSpider, n.d.).
- Finviz Stock Screener: A powerful free web-based scanner for stock traders. Under the “Technical” tab, users can select the “SMA 50 crossed above SMA 200” signal to generate a real-time list of equities displaying this bullish structure.
- MT4/MT5 Dashboards: For Forex traders, the MetaTrader marketplace offers custom indicators and “Golden Cross Dashboards” that monitor multiple currency pairs simultaneously, providing visual signals when a crossover occurs.
11. Frequently asked questions about Golden Cross Pattern Strategy
Traders often have questions about reliability and timeframes. Here are the answers to the most common questions.
12. Conclusion
The Golden Cross Pattern remains a cornerstone of technical analysis for identifying major structural shifts in market momentum. While its lagging nature means traders rarely enter at the absolute bottom, its strength lies in confirming that a new, sustainable uptrend is underway. By combining the 50/200 SMA crossover with volume confirmation, price action analysis, and disciplined risk management, traders can use this signal to participate in significant market rallies with higher confidence.
Ready to master trend trading? Access our comprehensive library of educational guides and market analysis at Piprider to sharpen your skills today.


