
Entering a trade only to watch it stall in a flat, choppy market is one of the most common ways traders lose capital. The ADX Indicator Average Directional Index is a technical indicator designed specifically to solve this problem by quantifying the absolute strength of a trend.
Before diving into the mechanics, it is crucial to establish its core function: ADX is a trend-strength filter, not a standalone buy or sell trigger. It does not indicate market direction; it simply measures whether the current momentum is strong enough to trade. To extract real value, traders must combine the ADX with the +DMI/-DMI lines, core price structure, and key support/resistance levels.
This guide breaks down exactly how the ADX works, its optimal settings, and objective strategies to integrate it into your forex trading system.
Key Takeaways
-
- Understand ADX: The Average Directional Index measures trend strength, not direction, helping you focus on powerful market moves.
-
- Learn its mechanics: Discover how ADX uses +DMI and -DMI to signal trend strength and direction for better trading decisions.
-
- Apply trading strategies: Use ADX for breakout confirmation, trend continuation, and timely exits to boost your forex trading success.
-
- Optimize settings: Find the best ADX settings for scalping or swing trading, tailored to platforms like MT4 and TradingView.
-
- Avoid common mistakes: Steer clear of pitfalls like trading in flat markets or misreading high ADX values to trade smarter.
1. What is the ADX Indicator Average Directional Index?
Developed by the legendary technical analyst J. Welles Wilder in 1978, the Average Directional Index (ADX) was designed to solve the ultimate trading challenge: distinguishing a trending market from a sideways one. Unlike most indicators that focus on price direction, the ADX is a pure measure of momentum intensity.
Quick Definition: The ADX at a Glance
- Primary Function: Measures trend strength, not price direction.
- Directional Aids: Used alongside +DI and -DI lines to identify the trend’s bias (Bullish/Bearish).
- Best Role: Functions as a trend filter to confirm institutional participation.
- Main Weakness: Less effective in sideways or low-volatility markets.
1.1. The Anatomy of the ADX System: +DMI and -DMI
The ADX Indicator Average Directional Index does not work in isolation; it is part of the broader Directional Movement Index (DMI) system. To get a complete picture of the market, you must understand the “Trio” of lines that appear in your indicator window:
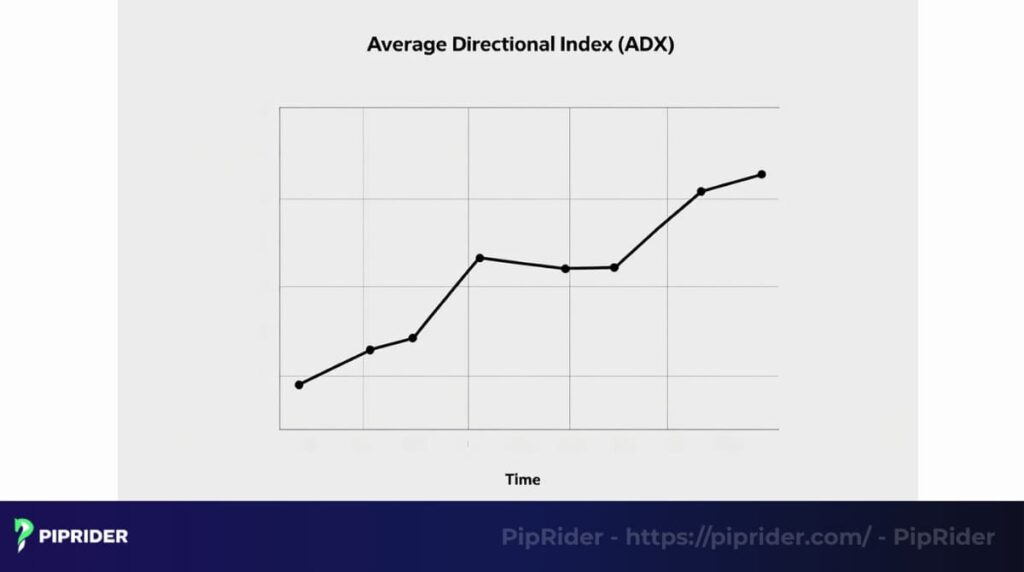
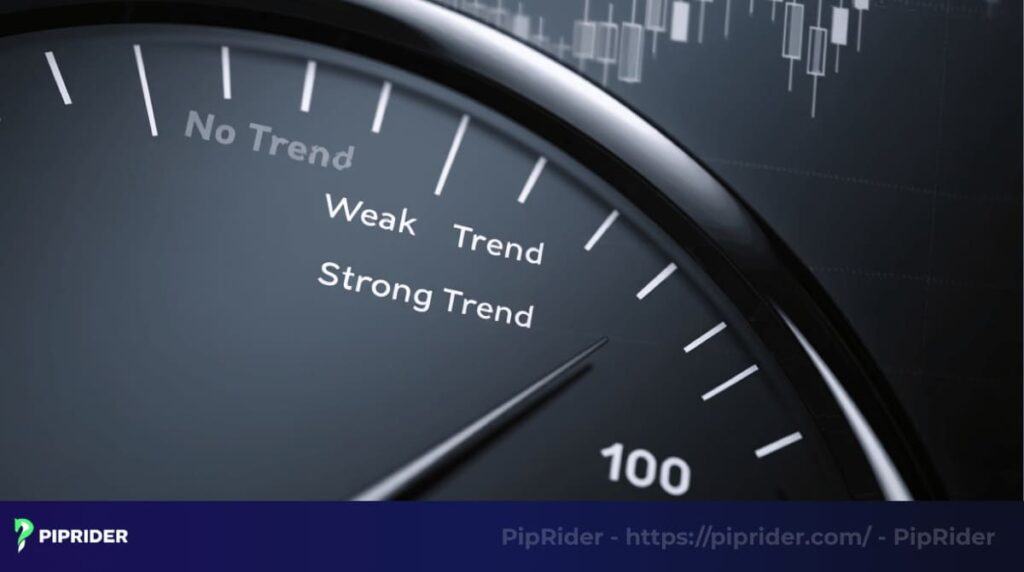
- The ADX Line (The Speedometer): This single line quantifies the strength of the trend on a scale of 0 to 100. It tells you how much “fuel” is in the move, regardless of direction.
- The +DMI / +DI (The Bullish Compass): Measures upward price pressure. When +DMI is above -DMI, bulls are in control.
- The -DMI / -DI (The Bearish Compass): Measures downward price pressure. When -DMI is above +DMI, bears are dominant.
1.2. Why the ADX Matters: The Professional Edge
In a market saturated with lagging indicators, the ADX stands out because it solves a critical problem: Opportunity Cost. Many traders lose capital not by being wrong about direction, but by trading in a market that isn’t moving.
- Market Versatility: Because it measures price displacement, the ADX is highly effective across Forex, Stocks, Commodities (Gold), and even Cryptocurrencies.
- The “Speedometer” Effect: It acts as a real-time gauge of market “fuel.” By identifying when a trend is ready to accelerate, it helps traders avoid time-wasting, flat periods that lead to “death by a thousand cuts” (whipsaws).
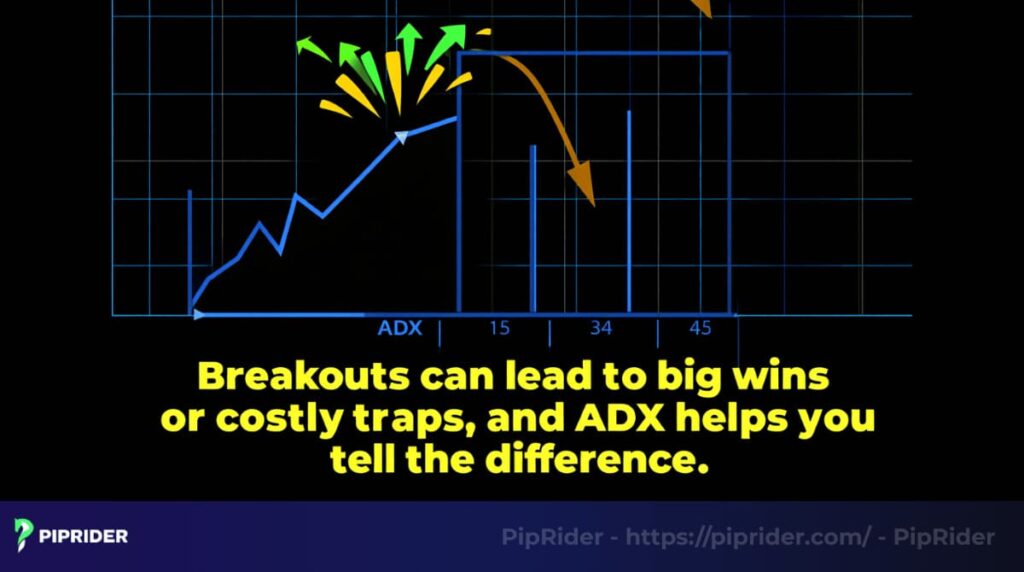
- Validation of Breakouts: While price action shows a breach of structure, the ADX confirms if there is enough institutional volume to sustain the move. High-probability breakouts, such as major moves in EUR/CHF, often see the ADX surge past 25 or even 50 as momentum takes over.
2. How the ADX Indicator Works (Behind the Scenes)
While your trading platform (MT4, MT5, or TradingView) handles the heavy lifting, understanding the logic behind the calculation is the difference between a novice and a professional.
The Conceptual Bridge:
Most traders do not need to calculate the ADX by hand. What matters is understanding that the ADX smooths directional movement to measure how “committed” a trend really is. It filters out daily market noise to show you the true underlying strength of the move.
2.1. The 4 Pillars of the ADX Calculation
To arrive at the final ADX value, the formula analyzes price highs and lows across a 14-period lookback:
The 4-Step Mathematical Blueprint
Step 1: Directional Movement (+DM & -DM)
Comparing today’s high and low to yesterday’s. If today’s high is higher, it’s +DM; if the low is lower, it’s -DM.
Step 2: True Range (TR)
Measures the actual volatility by identifying the greatest distance between the current High, Low, and the previous Close.
Step 3: Directional Index (DX)
The core strength formula:
DX = [ |(+DI – -DI)| / (+DI + -DI) ] × 100
Step 4: The Smoothing (Final ADX)
The DX is averaged over 14 periods (Wilder’s Smoothing) to produce the stable, final ADX line used for decision-making.
Note: Most modern platforms like TradingView or MT4 perform these calculations in real-time. Traders should focus on the Final ADX Value rather than manual computation.
2.2. How to Read ADX Properly: The Value Cheat Sheet
The ADX line provides an absolute mathematical value for trend momentum. Rather than guessing if a market is moving fast enough, traders rely on specific threshold zones to dictate their behavior.
The PipRider ADX Efficiency Matrix
| ADX Value | Meaning | What Traders Usually Do |
|---|---|---|
| Below 20 | Weak or ranging market | Avoid trend trades entirely. Focus on mean-reversion strategies or wait on the sidelines. |
| 20 – 25 | Trend may be forming | Watch closely and wait for structural confirmation. Do not pre-empt the breakout. |
| 25 – 40 | Strong tradable trend | Actively use trend-following or breakout strategies. This is the optimal trading zone. |
| Above 40 | Very strong trend | Manage entries carefully. Avoid entering late; focus on trailing stop-losses to lock in profit. |
| Above 50 | Extreme trend strength | Watch for imminent momentum exhaustion. Do not chase the market at this stage. |
Technical Validation: These specific threshold zones (20, 25, 40) are not arbitrary; they align with the global analytical standards established by the CMT Association (Chartered Market Technician) for identifying shifts in market regimes from non-trending to trending.
PipRider Pro Tip: A rising ADX line means the trend is strengthening, regardless of whether the price is going up or down. Always pair the ADX value with the +DMI/-DMI lines to confirm the actual direction of the move before entering.
3. Why Use the ADX Indicator in Forex Trading?
The ADX Indicator Average Directional Index is often called the “Ultimate Trend Filter.” Its primary value lies not in telling you what to trade, but in quantifying whether a trade has the institutional momentum to succeed. Below is the strategic breakdown of why professional traders integrate the ADX into their systems.
In a global financial landscape where the 2025 BIS Triennial Survey reports a record-breaking $9.6 trillion average daily turnover, distinguishing between high-velocity institutional trends and temporary retail noise is paramount. The ADX stands out as the ultimate ‘volatility filter’ in this high-liquidity environment
3.1. The Strategic Advantage Matrix
While many indicators focus on predicting price direction, the ADX specializes in quantifying the market environment. To help you integrate this tool effectively, the following Strategic Advantage Matrix outlines the primary benefits of the ADX and, more importantly, its functional boundaries.
| Core Benefit | What It Helps With | What It Does NOT Do |
|---|---|---|
| Trend Filtering | Identifying if there is enough “institutional fuel” to sustain a move. | It does not identify the trend’s direction (Bullish/Bearish). |
| Breakout Validation | Reducing “fake-outs” by requiring a surge in ADX during a structural breach. | It does not guarantee that a breakout won’t retest the level. |
| Capital Preservation | Preventing entries into “choppy” or sideways markets (ADX < 20). | It does not predict when a consolidation period will end. |
| Versatility | Analyzing volatility across Forex, Gold, and Stocks effectively. | It does not provide fixed price levels for entry/exit on its own. |
3.2. Practical Pillars for PipRider Traders
Knowing the theory of the ADX is only half the battle; the real edge comes from strict execution. To translate the matrix above into profitable chart decisions, every trader should build their system around these three foundational pillars:
1. ADX Filters Out “Bad” Trend Trades
In Forex, many losses occur when traders try to “trend follow” a market that is actually range-bound. The ADX acts as a gatekeeper: if the value is below 25, the market lacks the commitment needed for trend strategies. This simple rule can eliminate nearly 50% of false signals in a typical trend-following system.
2. ADX Validates Breakout Quality
A price breakout without rising momentum is often a trap. The ADX provides a “quality score” for the move. When price breaks resistance and the ADX simultaneously hooks upward, it confirms that aggressive institutional participants have entered the market.
3. ADX Does Not Provide Directional Bias
The most critical realization for any trader is that the ADX is a secondary filter, not a primary trigger. It tells you the “Climate” of the market (Strong vs. Weak), but it will never tell you whether to click “Buy” or “Sell.” That remains the job of your price action levels or DMI crossovers.
4. How to Trade Forex Using the ADX Indicator: The Playbook
Trading forex requires more than just spotting a trend; it requires precise execution. The ADX Indicator is most effective when integrated into a strict, rule-based system. Below are three objective trading strategies that transform the ADX from a passive gauge into an actionable trading playbook.
4.1. Strategy 1: The Breakout Confirmation
Breakouts are notorious for “fake-outs” (false breaks) that trap traders. The ADX acts as the ultimate lie detector, confirming whether a breakout has the institutional momentum to sustain itself.
- Best for: Breakout and momentum traders.
- Use when: Price breaches a heavily consolidated trading range, or a major structural support/resistance level.
- Entry trigger: The breakout candle clearly closes outside the structural range, strictly coinciding with the ADX line rising aggressively above the 25 threshold.
- Direction filter: For a bullish breakout, the +DMI must be positioned above the -DMI. For a bearish breakdown, the -DMI must be above the +DMI.
- Stop-loss: Placed mechanically just below the breakout candle’s low (for long setups) or slightly below the retest level of the broken structure.
- Take-profit: Target a minimum 1:2 Risk/Reward ratio, or scale out at the next major higher-timeframe resistance/support zone.
- Avoid when: The ADX is rising, but the price is still confined within the range. Do not front-run a breakout just because the ADX is moving.
Note on Lag: Because the ADX is a smoothed lagging indicator, the signal often confirms a move after it has started. Always use price action (candlestick patterns) for the precise entry, while using the ADX as the “environment validator.
4.2. Strategy 2: The Trend Continuation (Pullback)
Markets do not move in straight lines. Once a strong trend is established, the safest entries occur during pullbacks. The ADX ensures you are buying a dip in a strong trend, not catching a falling knife.
- Best for: Trend followers and swing traders.
- Use when: The market is in a clear, established directional trend on the higher timeframe.
- Entry trigger: Price pulls back to a dynamic support/resistance level (such as the 50 EMA). Crucially, the ADX must remain elevated (holding above 25 or 40), and the dominant DMI line must not cross over to the downside.
- Stop-loss: Placed safely outside the most recent structural swing low (in an uptrend) or swing high (in a downtrend).
- Take-profit: Target the next swing extension level, or trail the stop-loss manually behind newly formed market structure as the trend develops.
- Avoid when: The ADX begins to move sideways or drops sharply while the price is pulling back. This indicates the broader trend is structurally failing, making the pullback highly risky.
4.3. Strategy 3: Exit Management (Momentum Exhaustion)
Knowing when to exit is often harder than knowing when to enter. The ADX provides a mathematical clue for when the “smart money” is stepping off the gas.
- Best for: Traders currently holding profitable, trend-following positions.
- Use when: A trade is heavily in profit during a strong, extended, and fast-moving market phase.
- Exit clue: The ADX line peaks, flattens, and visibly begins to hook downward after a prolonged surge (especially when dropping from extreme levels above 40 or 50).
- Partial exit: Scale out of the position (take 50% or 75% of profits) when a declining ADX coincides with the price colliding into a major, higher-timeframe support or resistance zone.
- Avoid mistake: Never interpret a declining ADX as an immediate reversal signal. A falling ADX only means the current trend is losing speed. The market may simply transition into a sideways consolidation, not a V-shape reversal. Do not use a falling ADX as an excuse to immediately open a counter-trend trade.
4.4. Real-World Case Studies: ADX in Action
To truly master the Average Directional Index, one must observe how these signals materialize in live market conditions. Below are two distinct scenarios—a breakout and a trend exit—demonstrating the objective application of the ADX Playbook.
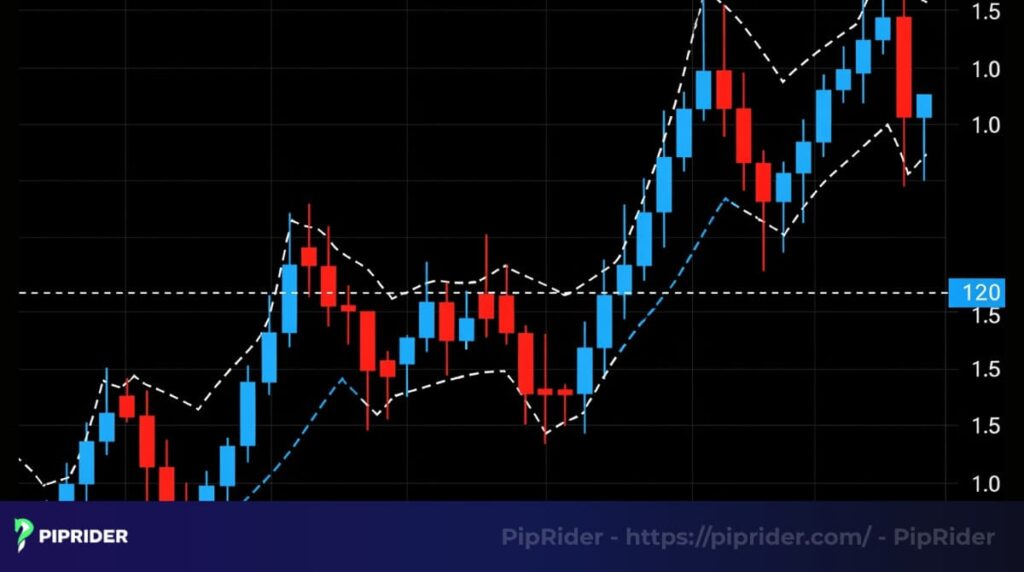
Case Study 1: The EUR/CHF Structural Breakout
This case illustrates the transition from a low-volatility environment to a high-momentum breakout.
- Context: EUR/CHF had been compressed in a tight, 50-pip horizontal range for several weeks. During this consolidation, the ADX remained stagnant below the 20 level, signaling a “no-trade” zone.
- Trigger: A high-volume bullish candle decisively closed above the primary resistance level.
- Confirmation: Simultaneously with the price breach, the ADX line surged from 18 to 32, and the +DMI crossed above the -DMI, validating institutional participation.
- Entry: A long position was executed on the close of the breakout candle.
- Stop-Loss: Placed 10 pips below the base of the breakout candle to protect against a “fake-out” retest.
- Target Logic: The trade was held until the price reached the next major daily resistance zone, achieving a 1:2.5 Risk/Reward ratio.
- Lesson: ADX confirms the strength of the breakout, not the direction. The DMI lines and price structure provide the directional bias.
Case Study 2: Managing Momentum Exhaustion in Gold (XAU/USD)
This case demonstrates how the ADX protects profits by signaling when a trend is losing its “institutional fuel.”
- Context: Gold was in a sustained parabolic uptrend, with the ADX reaching extreme levels above 55, indicating an overheated market.
- Management Clue: While the price was still printing marginally higher highs, the ADX line began to flatten and “roll over” from its peak, signaling momentum exhaustion.
- Action Taken: Rather than waiting for a trend reversal, the stop-loss was tightened to the most recent H4 swing low, and 50% of the position was liquidated as the price hit the 2650 resistance level.
- Outcome: Shortly after the ADX began its decline, the price transitioned into a choppy, sideways consolidation, eroding the gains of traders who failed to exit.
- Lesson: A falling ADX from extreme levels does not mean “go short.” It simply signals that the trend’s momentum is fading, and capital should be protected through aggressive profit-taking.
5. ADX vs. RSI vs. MACD: Which One Should You Use?
While many indicators claim to identify trends, they process market data fundamentally differently. A common trap for retail traders is layering redundant indicators on a single chart. Understanding the mathematical distinction between trend strength (ADX), momentum (RSI/MACD), and direction (EMA) is crucial for building a clean, non-conflicting trading system.
Below is a definitive comparison of how the ADX differs from other legacy indicators, and how to assign each tool its proper role:
| Indicator | Best For | Core Strength | Primary Weakness |
|---|---|---|---|
| ADX | Quantifying absolute trend strength. | Unmatched filter for trend quality and validating structural breakouts. | Non-directional on its own; requires DMI or price action for context. |
| RSI | Identifying momentum exhaustion (Overbought/Oversold). | Highly responsive and intuitive for mean-reversion trading. | Frequently gives premature reversal signals during strong, sustained trends. |
| MACD | Spotting momentum shifts and early trend transitions. | Excellent for crossover-based entry systems and measuring divergence. | Inherently lagging; often signals entries after the initial price move has occurred. |
| EMA | Defining baseline trend direction and dynamic pullbacks. | Visually simple, objective, and universally applicable across all timeframes. | Does not quantify momentum; highly susceptible to whipsaws in ranging markets. |
The Professional Setup: A robust trading system does not rely on isolated indicators. A standard institutional approach often pairs a directional baseline (like the 50 EMA), a momentum oscillator for entry timing (such as the MACD), and strictly utilizes the ADX as the final “go/no-go” volatility filter to ensure the market environment is optimal.
6. Best Settings for the ADX Indicator: The Decision Matrix
The default 14-period setting developed by J. Welles Wilder is the industry standard for a reason: it mathematically balances responsiveness with reliability. However, institutional and retail traders often optimize this input based on their specific trading frequency.
Rather than guessing, use this definitive decision matrix to match the ADX period to your personal trading style:
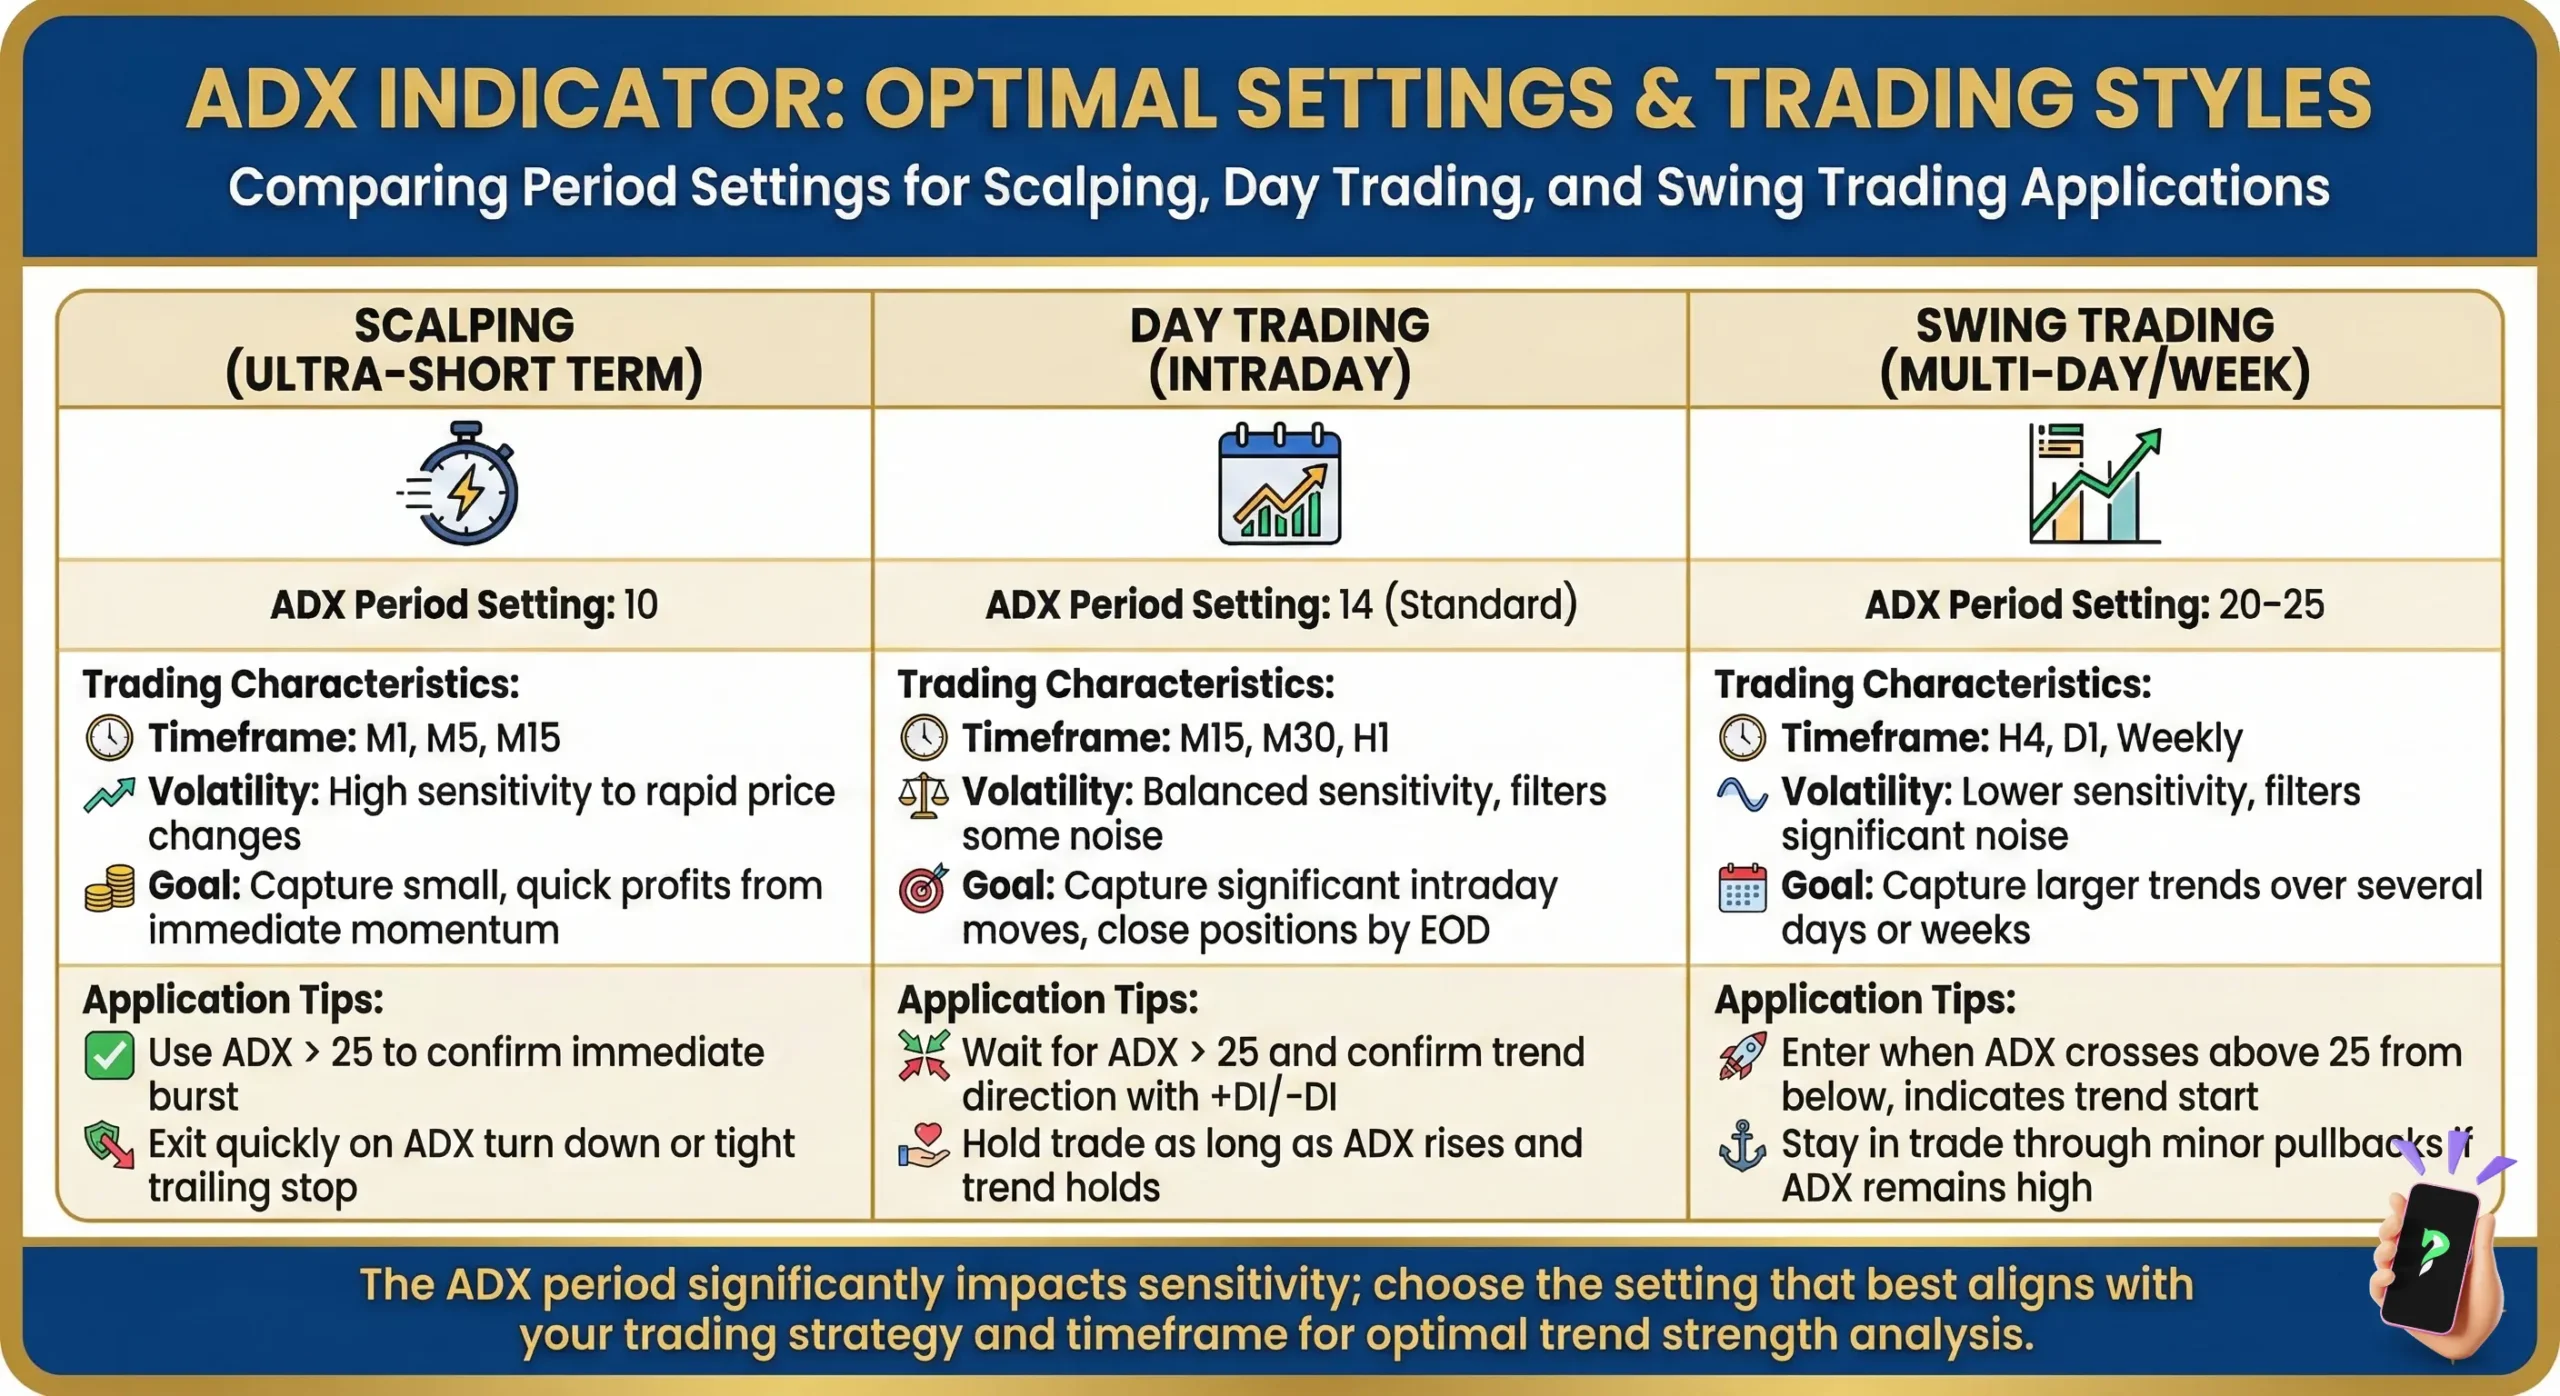
| Trading Style | Suggested Setting | Why it Works |
|---|---|---|
| Beginner / Novice | 14 | Balanced, universally tested, and easier to read without overreacting to market noise. |
| Scalping (M1 – M15) | 10 | Faster reaction to micro-trends. Essential for quick momentum bursts, but inherently noisier. |
| Intraday (H1 – H4) | 14 | Provides the optimal balance of valid signal generation and false breakout filtration. |
| Swing Trading (D1+) | 20 | Smoother and far more reliable for capturing macro, institutional-level trends on higher timeframes. |
The Trade-Off Rule: Lower settings increase the indicator’s responsiveness, but they exponentially increase false signals. If you decrease the period, you must increase your reliance on structural price action to filter out bad trades.
Platform-Specific Optimization
- TradingView Users: Take advantage of custom scripts like “Dema DMI” to reduce moving average lag, or use indicators that overlay color-coded ADX thresholds directly onto your price candles for faster visual processing.
- MetaTrader 4/5 (MT4/MT5) Users: The native ADX tool is highly reliable. Ensure you manually draw horizontal lines at the 20, 25, and 40 levels within the indicator sub-window, as the default platform setup does not clearly demarcate these critical zones.
7. Common ADX Mistakes and When to Stay Sidelined
Even with the right settings, misapplying the ADX can lead to significant drawdown. To trade like a professional, you must recognize not only the signals but also the environments where this indicator loses its edge.
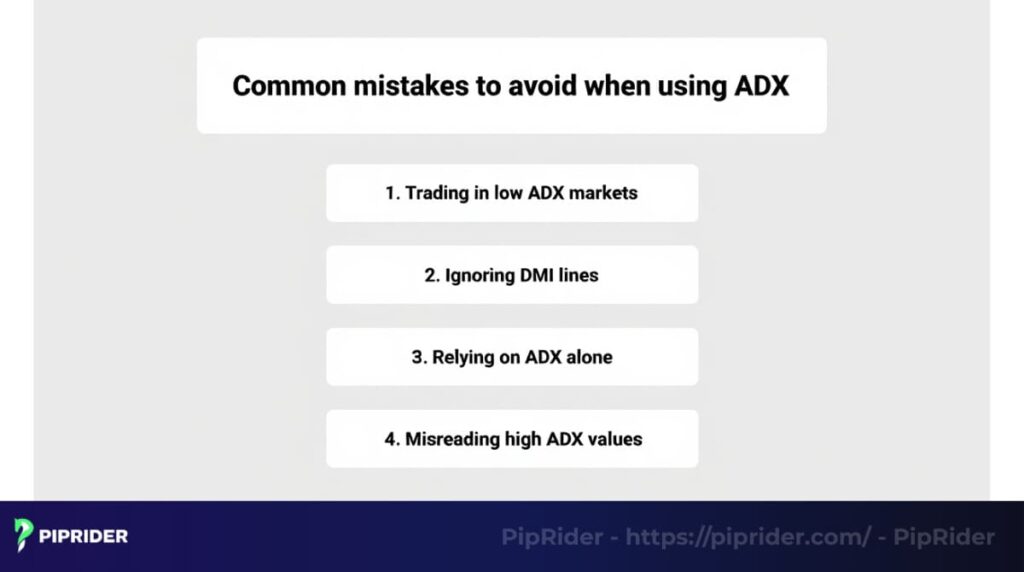
7.1. The 4 Most Dangerous ADX Mistakes
Even the most powerful technical tools can become liabilities if misapplied. Many retail traders fail with the ADX not because the indicator is flawed, but because they treat it as a “magic signal” rather than a contextual filter. To protect your capital and maintain a professional edge, you must avoid these four high-probability errors that frequently lead to unnecessary drawdowns.
- Trading in Low ADX (<20): Attempting to trend-trade when the ADX is flatlining below 20 is a recipe for “death by a thousand cuts” due to market noise.
- Ignoring the DMI Lines: The ADX measures strength, not direction. Entering a “strong trend” without checking if +DMI or -DMI is on top is a 50/50 gamble.
- Relying on ADX as a Standalone Trigger: The ADX is a filter, not an entry signal. It must be paired with price action (breakouts/pullbacks) for timing.
- Chasing High ADX (>50): A very high ADX often signals that a trend is overextended. Buying at an ADX of 60 is often “buying the top.”
7.2. Decision Support: The ADX Efficiency Matrix
To maximize your win rate, use the following matrix to decide whether the current market environment is suitable for ADX-based strategies:
When ADX Works Best
- Trending Markets: Clear, sustained directional moves.
- Breakout Environments: Validating the momentum of a price breach.
- Higher Timeframes: H1, H4, and Daily charts offer the cleanest signals.
- Combined Strategy: Used strictly alongside Price Structure and DMI.
When ADX Often Fails
- Sideways/Choppy Markets: Frequent “Whipsaws” in a tight range.
- Low-Volatility Sessions: During bank holidays or quiet Asian sessions.
- Unfiltered Scalping: M1/M5 charts without higher timeframe confirmation.
- Standalone Use: Using ADX without directional bias or market context.
8. FAQs
Understanding the nuances of the ADX Indicator Average Directional Index can significantly flatten the learning curve for new traders. Below are the most frequently asked questions regarding the practical integration of the Average Directional Index into a professional trading system.
9. Conclusion
In conclusion, mastering the ADX Indicator Average Directional Index truly is a game-changer for any trader aiming to ride strong trends and dodge flat markets. Mastering this tool will equip you with greater confidence and clarity in your trading decisions.
At Pip Rider, our blog is packed with guides to help you grow as a trader, whether you’re exploring the technical indicators list or just starting with our For Beginner section. Ready to put ADX to work?
Infographic Section
-

ADX Indicator or Average Directional Index -
Comparing Period Settings -

Step by step Trading Process


