

Continuation candlestick patterns are trend-pause setups that can offer clean entries when the trend context and confirmation are present. Treat them as probabilistic signals, your edge comes from structure, confirmation, and risk control, not the pattern name.
This guide delivers the structural and psychological insights required to identify both bullish and bearish continuation setups and validate their breakouts. It focuses on recognizing logical market pauses, filtering out noise, and applying the discipline of patient trading.
Key Takeaways
- A continuation pattern is a controlled, probabilistic pause, confirming the dominant trend, whether bullish or bearish, is merely reloading, not reversing.
- Prioritize multi-candle formations for strong structural confirmation. These are generally considered reliable patterns when traded with the prevailing trend.
- Use Volume and Momentum Indicators (RSI/MACD) to filter weak patterns and confirm continuation.
- Place Stop Losses (SL) beyond the invalidation level of the consolidation structure to avoid being stopped out by market noise.
- Enter only when a clear confirmation candle close is secured outside the pattern’s range.
1. What Are Continuation Candlestick Patterns?
A continuation pattern is a temporary, low-volatility pause that forms mid-trend. Its purpose is to signal that an existing trend continuation pattern is set to resume, not reverse (Investopedia, 2025).
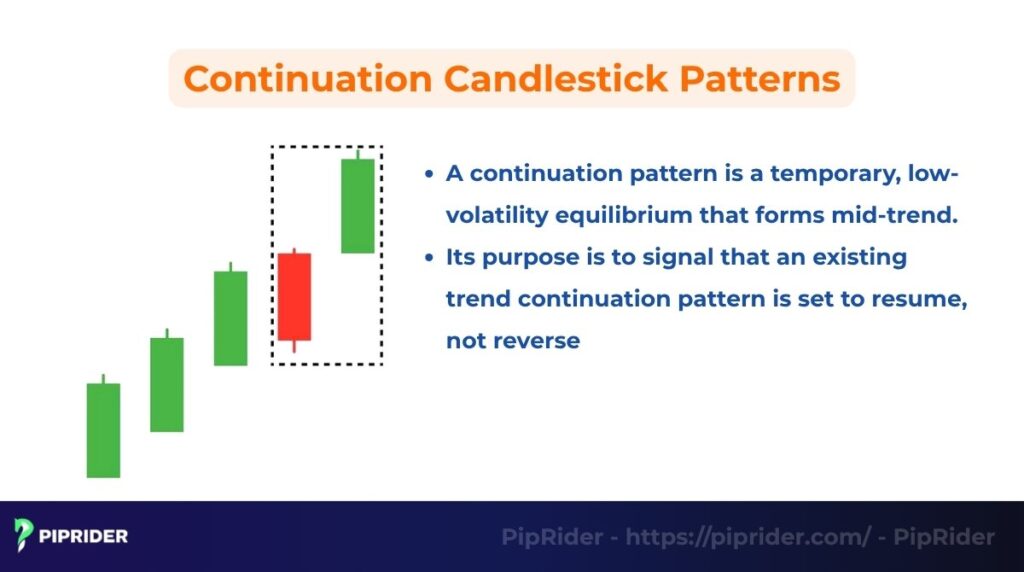
The core continuation meaning is that the market is pausing to recharge, allowing the dominant force to absorb minor counter-pressure before accelerating. A bullish/bearish continuation pattern simply refers to the pattern resolving in the direction of the prior move.
The pause reflects critical market psychology, confirming the trend’s underlying strength:
- Profit absorption: The pause is triggered by minimal profit-taking or short-term counter-trend attempts being absorbed.
- Liquidity gathering: This period of controlled consolidation patterns allows institutional traders to adjust positions without creating premature volatility.
- Dominance confirmed: The pattern validates that the opposing force is too weak to cause a reversal. The trend is simply “resting” before the next expansion.
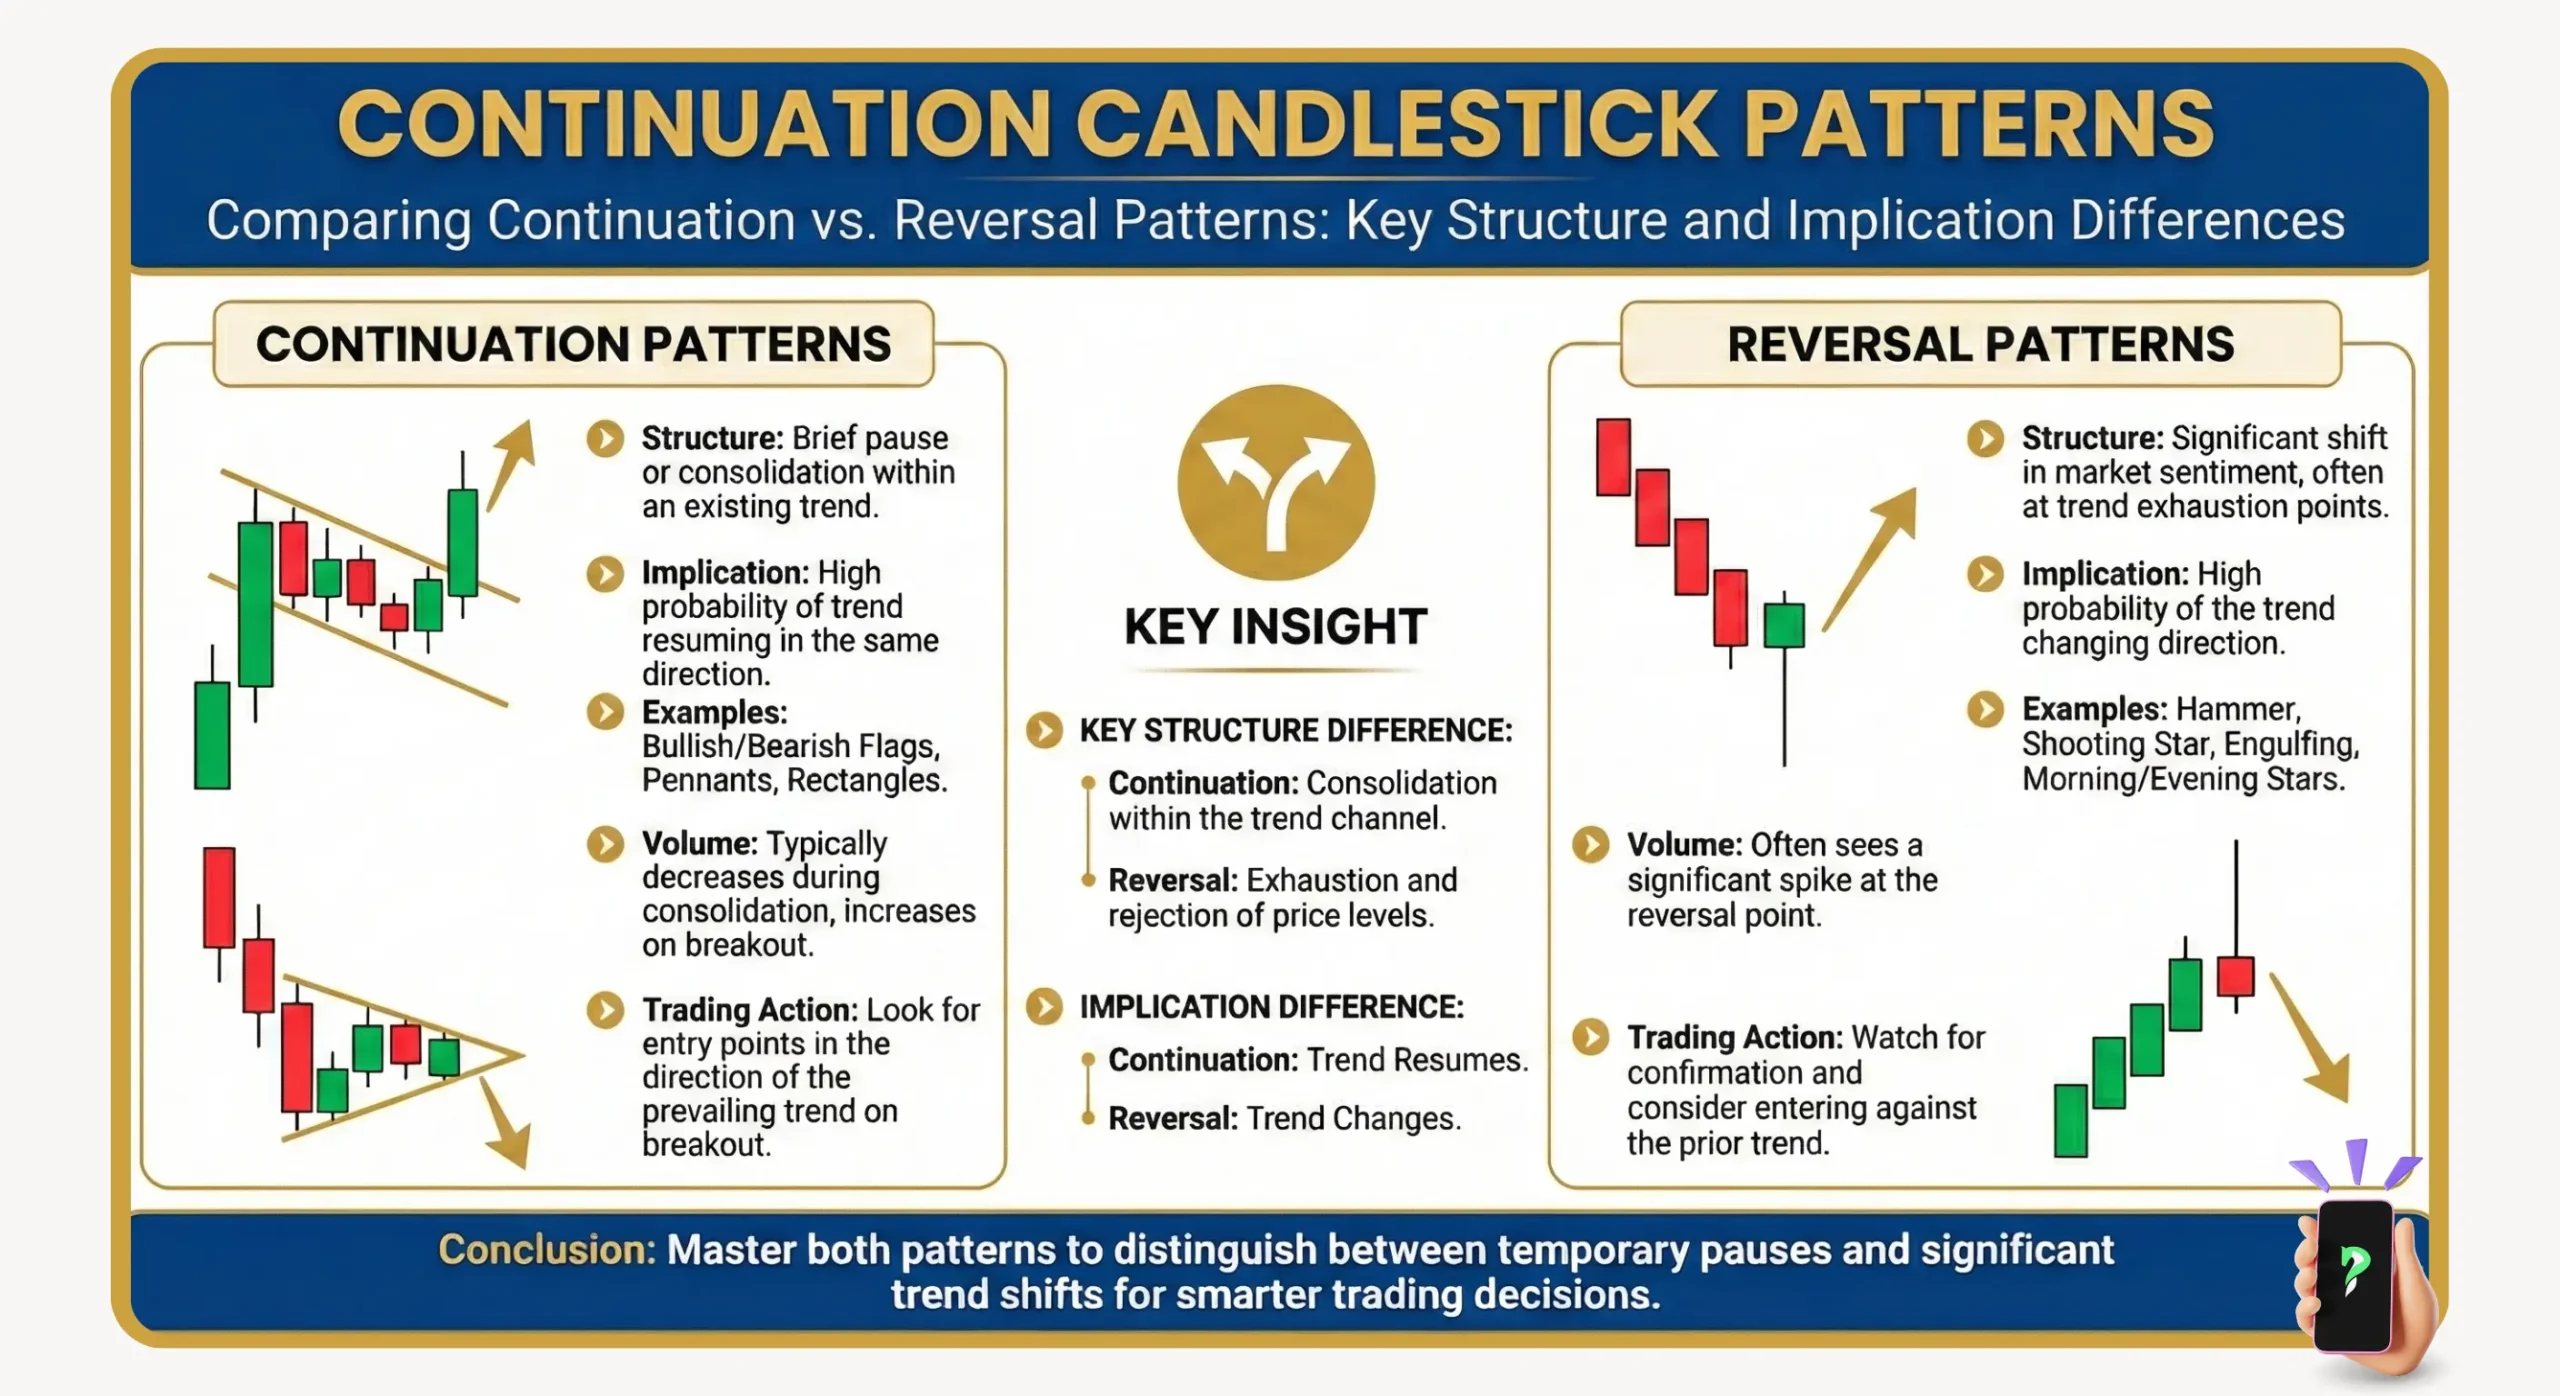
Continuation vs. Reversal: Key Differences
Mastering the difference between these two pattern types is crucial; misidentifying one for the other is a common, costly mistake in trading. The table below outlines the core structural and psychological differentiators:
| Feature | Continuation Patterns | Reversal Patterns |
|---|---|---|
| Signal Intent | Confirms the trend will continue. | Signals the trend is about to change direction. |
| Location | Occurs mid-trend. | Occurs at trend extremes (swing highs/lows). |
| Risk Profile | Statistically higher probability (with the flow). | Statistically lower probability (against the flow). |
2. Key Types of Continuation Candlestick Patterns
Structural analysis is paramount. These key patterns are prioritized because their specific formations, ranging from controlled consolidation chart patterns to immediate negation, provide the highest clarity and certainty for trend continuation entries.
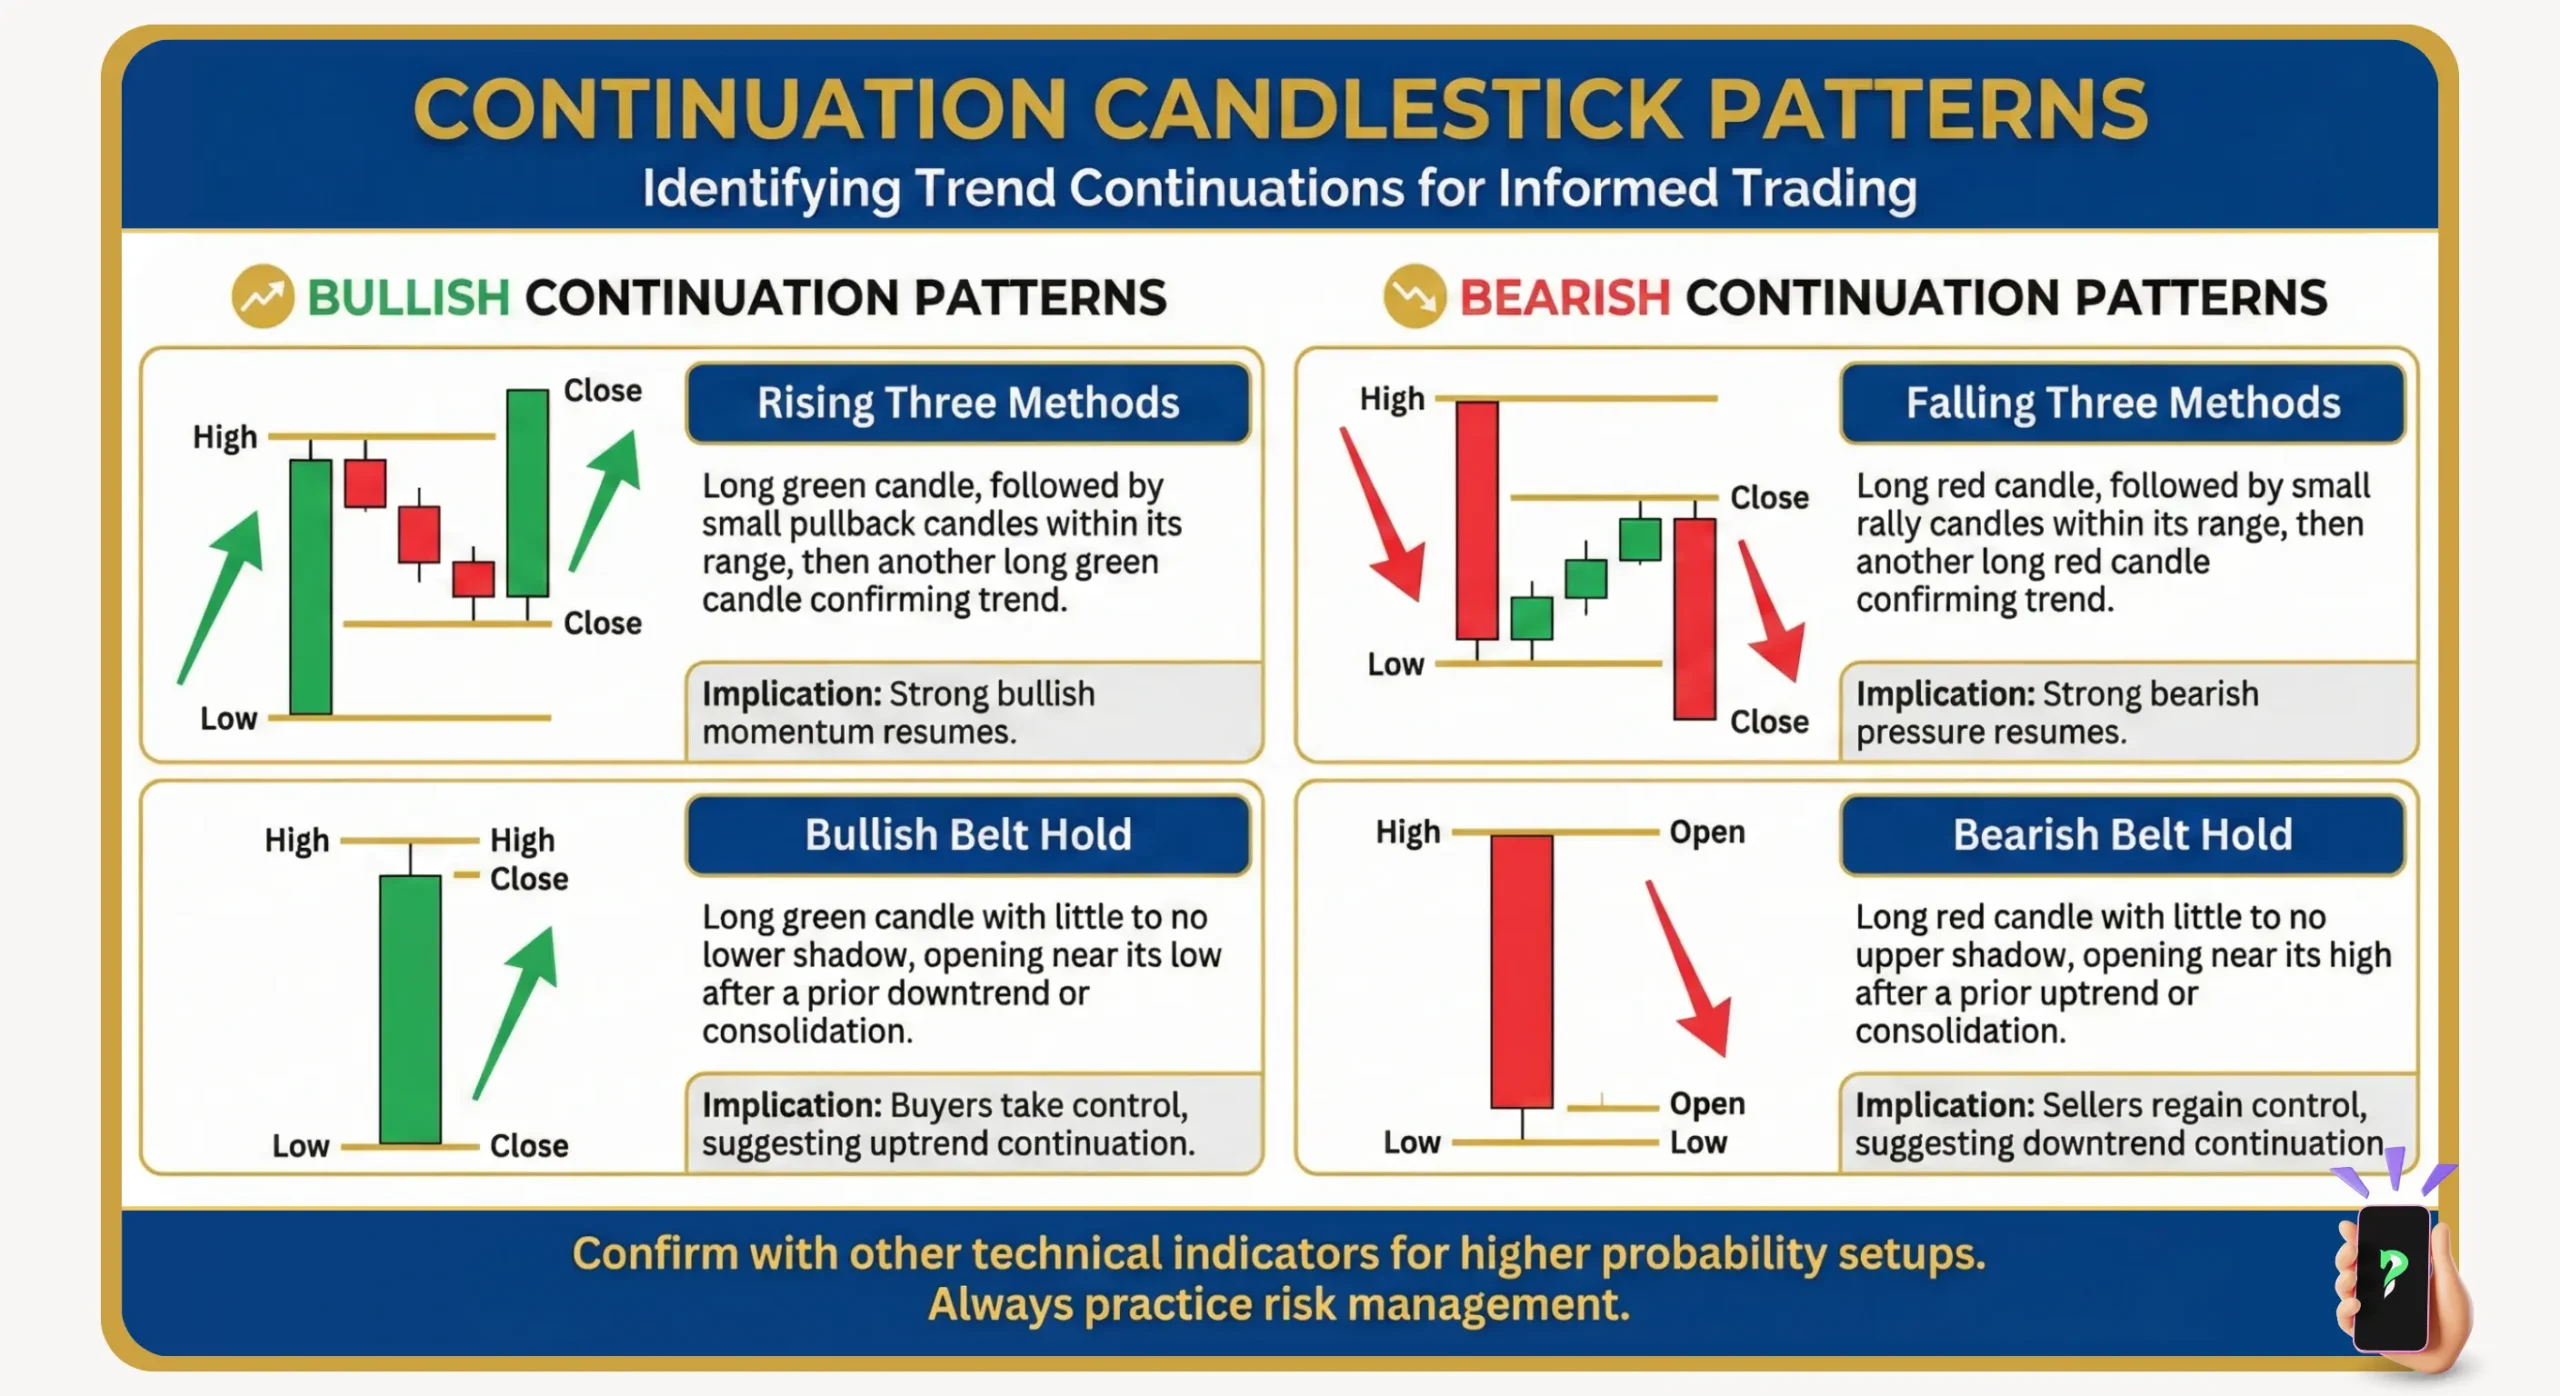
2.1. Rising Three Methods Pattern
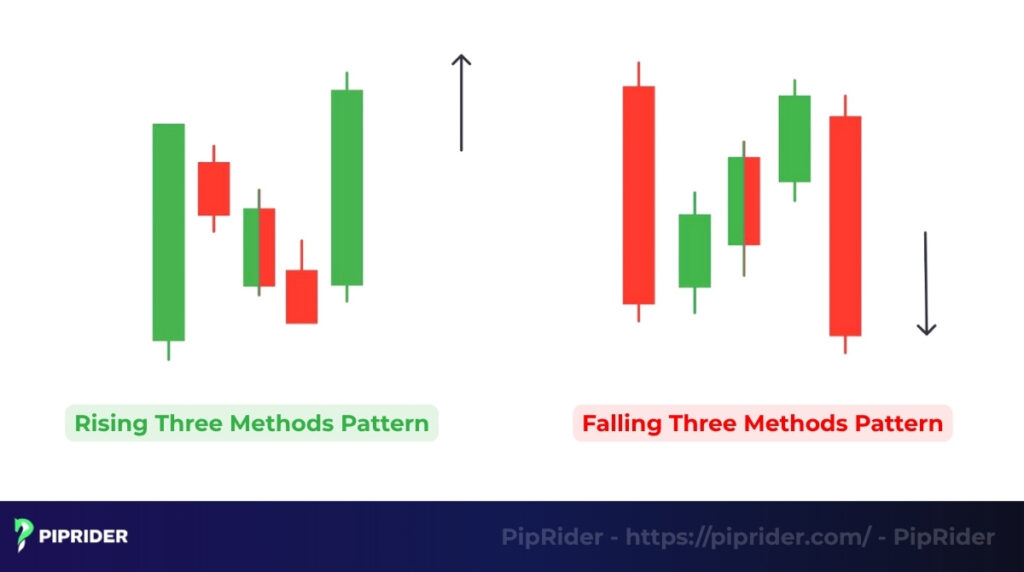
This is the most reliable strong bullish candlestick pattern, signaling a decisive continuation after a controlled pause.
- Structure: The pattern consists of a long bullish candle (C1) followed by three small, contained candles (C2-C4) that must remain entirely within the range of C1. It concludes with a large bullish candle (C5) that closes decisively above C1’s high.
- Meaning: C2-C4 represents weak, controlled profit-taking that is fully absorbed. The powerful C5 close confirms the bulls have neutralized all selling pressure, supporting the candlestick continuation.
- Application: Entry is triggered upon the close of C5, with the Stop Loss placed immediately below the absolute low of C1 for optimal risk control.
2.2. Separating Lines Pattern
The Separating Lines pattern is a high-conviction continuation signal. It suggests the prevailing trend is ready to resume immediately, as the previous counter-trend attempt is swiftly rejected at the open of the subsequent candle (Bravetotrade, 2021; LuxAlgo, 2025).
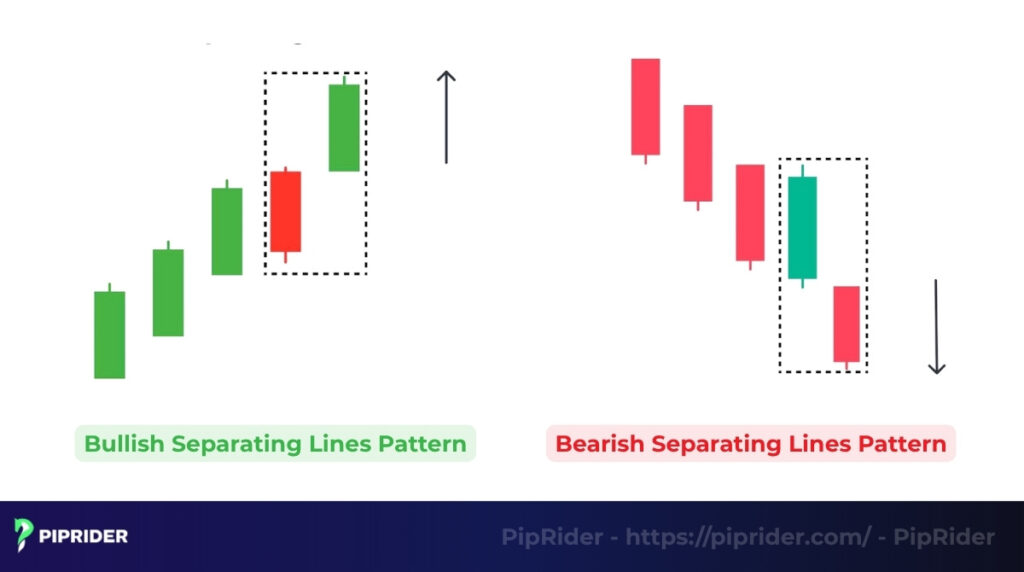
- Bullish Separating Lines: In an uptrend, the pattern features a bearish candle (C1) immediately followed by a long bullish candle (C2). Crucially, C2 opens at the same or nearly the same price as C1’s open (allowing for a small tolerance, which is common in continuous markets like Spot FX). This structure signals a decisive rejection of selling pressure, supporting the upward move.
- Bearish Separating Lines: In a downtrend, the pattern features a bullish candle (C1) followed by a long bearish candle (C2) that opens at or very near C1’s open. This confirms that the attempt by buyers to push the price higher was nullified right at the next candle’s open, indicating sustained bearish control.
- Reliability and practical application: This pattern is notable for its clear and rapid momentum shift. It is often used to trigger entries immediately upon C2’s close. Because the setup relies on a swift continuation, a tight Stop Loss is typically placed just beyond C2’s extreme to efficiently manage risk if the setup fails.
2.3. Doji Star Continuation Pattern
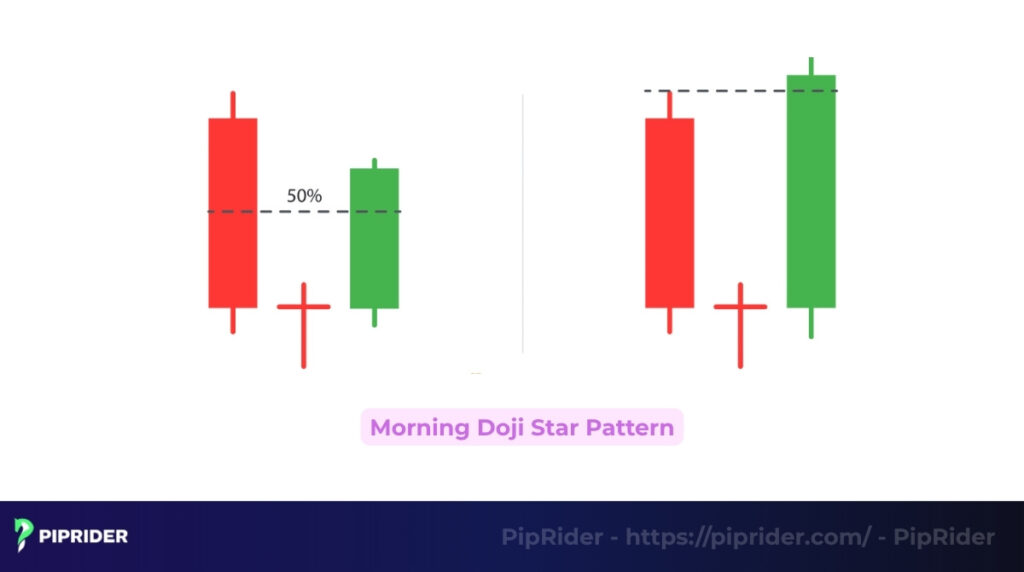
While the Doji typically signals reversal, its appearance mid-trend signals a powerful pause that is quickly overcome.
- Candle structure: A strong trend candle (long body) is followed by a small-bodied candle, a Doji or a very small Spinning Top, that shows severe range compression or small separation from the preceding candle’s body.
- When it appears: It occurs mid-trend after a major momentum push, signalling the market is “taking a breath” or experiencing minor exhaustion before the primary trend resumes.
- Trading application: This is a case for patience candle trading. The continuation is confirmed only if the subsequent candle breaks and closes decisively in the direction of the initial direction. Entry is taken after this confirmation candle closes, with the stop loss placed beyond the extreme of the Doji’s range.
2.4. Deliberation Pattern
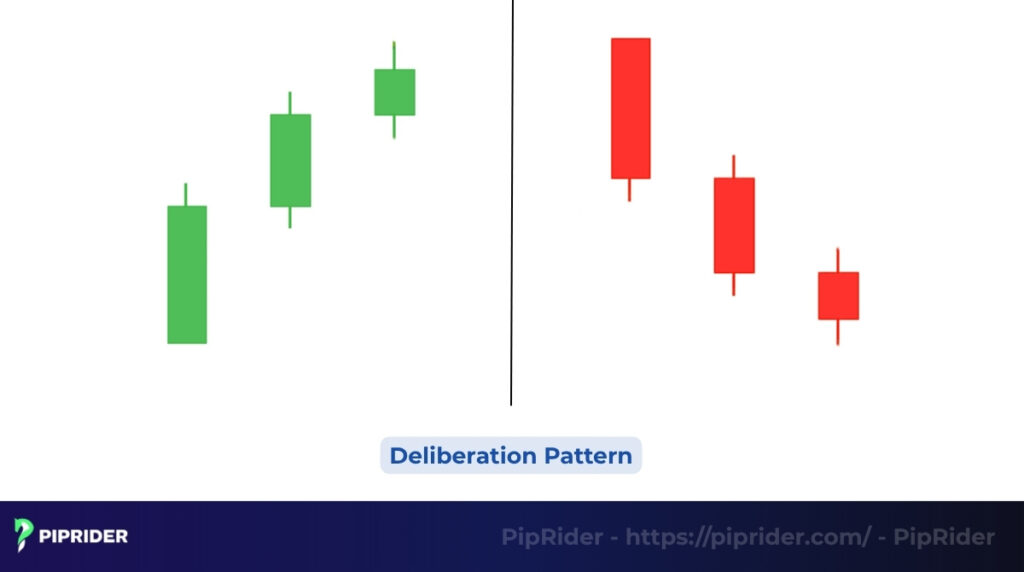
The Deliberation Pattern highlights extreme hesitation before the trend resumes, signaling a temporary deadlock in momentum that is ultimately resolved by the dominant force.
- Description: This pattern involves a long trend candle followed by three consecutive small candles (often same-colored bodies) that show minimal price range progression. These three candles form a tight holding pattern zone near the close of the initial strong candle.
- Strengths and limitations: The pattern’s strength is the clear signal of hesitation being overcome, making the subsequent breakout a compelling probabilistic setup. Its primary limitation is the low-volatility nature, meaning it critically requires a major volume spike on the breakout candle to confirm validity.
- Case study: This setup frequently appears on the daily chart of highly liquid asset prices (e.g., S&P 500 or major FX pairs). For instance, following a strong 3% rally (C1), three days of near-flat trading (C2-C4) signal market “deliberation.” The candlestick continuation is validated only when the price decisively closes above the C1/C4 high on the fifth day, confirming the absorption phase is complete and institutional momentum has resumed.
2.5. Matching High Pattern
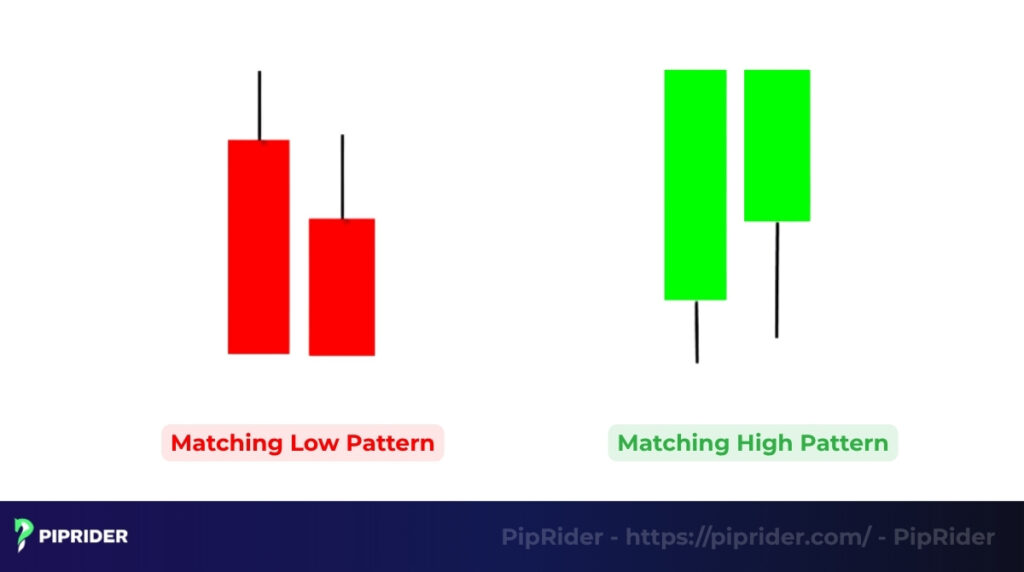
The Matching High Pattern (or its inverse, Matching Low) is a simple but effective two-candle formation. This pattern indicates a specific price level was tested twice before the direction ultimately overcame the resistance. It’s a clear signal of minor price consolidation patterns.
- Structural characteristics: This pattern features two consecutive trend candles whose highs (for an uptrend) or lows (for a downtrend) are exactly or nearly equal. This equality identifies a temporary price barrier that the market could not immediately penetrate.
- How to confirm trend continuation: Confirmation is achieved only when the subsequent candle decisively breaks and closes beyond that matched high/low level. This successful breakout confirms that the necessary momentum has been built to overwhelm the temporary resistance and resume the continuation pattern.
- Real-world example: On a daily chart, if the price makes an equal high on Monday and Tuesday (forming the pattern), a trader will wait for a Wednesday close above that exact high. Entry is taken on that confirmed close, with the Stop Loss placed below the lowest point of the two candles (Monday/Tuesday) for efficient risk sizing.
2.6. Other Notable Continuation Patterns
These patterns appear less frequently or require careful contextual reading. For comprehensive analysis, they often serve as precise entry triggers within larger chart patterns like Wedges or Cup and Handles, offering powerful supplementary evidence for trend continuation (Wright Research, 2025).
| Pattern | Structure & Context | Market Logic |
|---|---|---|
| Mat Hold | Similar to the Rising Three Methods, but begins with a gap up and maintains a looser, “step-like” consolidation without dropping below the first candle’s open. | A strong indicator of sustained institutional accumulation, suggesting the bullish momentum remains intact. |
| Three Line Strike | Three consecutive trend candles followed by one massive “strike” candle that engulfs the prior three, closing near the pattern’s starting point. | A classic “liquidity trap.” The strike candle clears out weak hands before the dominant trend resumes its course. |
| Tasuki Gap (Up/Down) | A gap in the direction of the trend, followed by a counter-trend candle that partially fills the gap but fails to close it. | Suggests that the newly formed gap is acting as a structural support/resistance floor. |
| Upside/Downside Gap Three Methods | A trend candle, a gap into another trend candle, followed by a counter-trend candle that completely fills the gap. | The gap is filled to test the breakout level. Once the test holds, the original trend is expected to continue. |
| In-Neck / On-Neck / Thrusting | A sequence of bearish patterns where a strong bearish candle is followed by a bullish bounce that fails to penetrate deeply into the first candle’s body. | Highlights a weak, failed relief rally. Buyers lack the strength to reverse the momentum, indicating sustained bearish control. |
2.7. Explore More: The Piprider Pattern Library
While this guide details the highly actionable setups for modern markets, understanding the full spectrum of candlestick formations can significantly enhance your analytical edge. If you want to dive deeper into specific structural pauses and how to trade them, explore our dedicated pattern guides:
- Mastering Gaps: Learn the nuanced differences in trading the Upside/Downside Gap Three Methods versus the Tasuki Gap in traditional markets.
- The Liquidity Trap: Discover how to avoid being shaken out by understanding the explosive Three Line Strike.
- Advanced Consolidation: Understand why some traders prefer the flexibility of the Mat Hold Pattern over strict standard pauses.
- Bearish Dominance: Learn how to identify failed relief rallies using the On-Neck, In-Neck, and Thrusting Patterns.
3. Trading Strategies Using Continuation Patterns
Trading strategies for continuation patterns maximize the probabilistic nature of these setups. However, a pattern is only as good as the execution plan and risk management behind it.

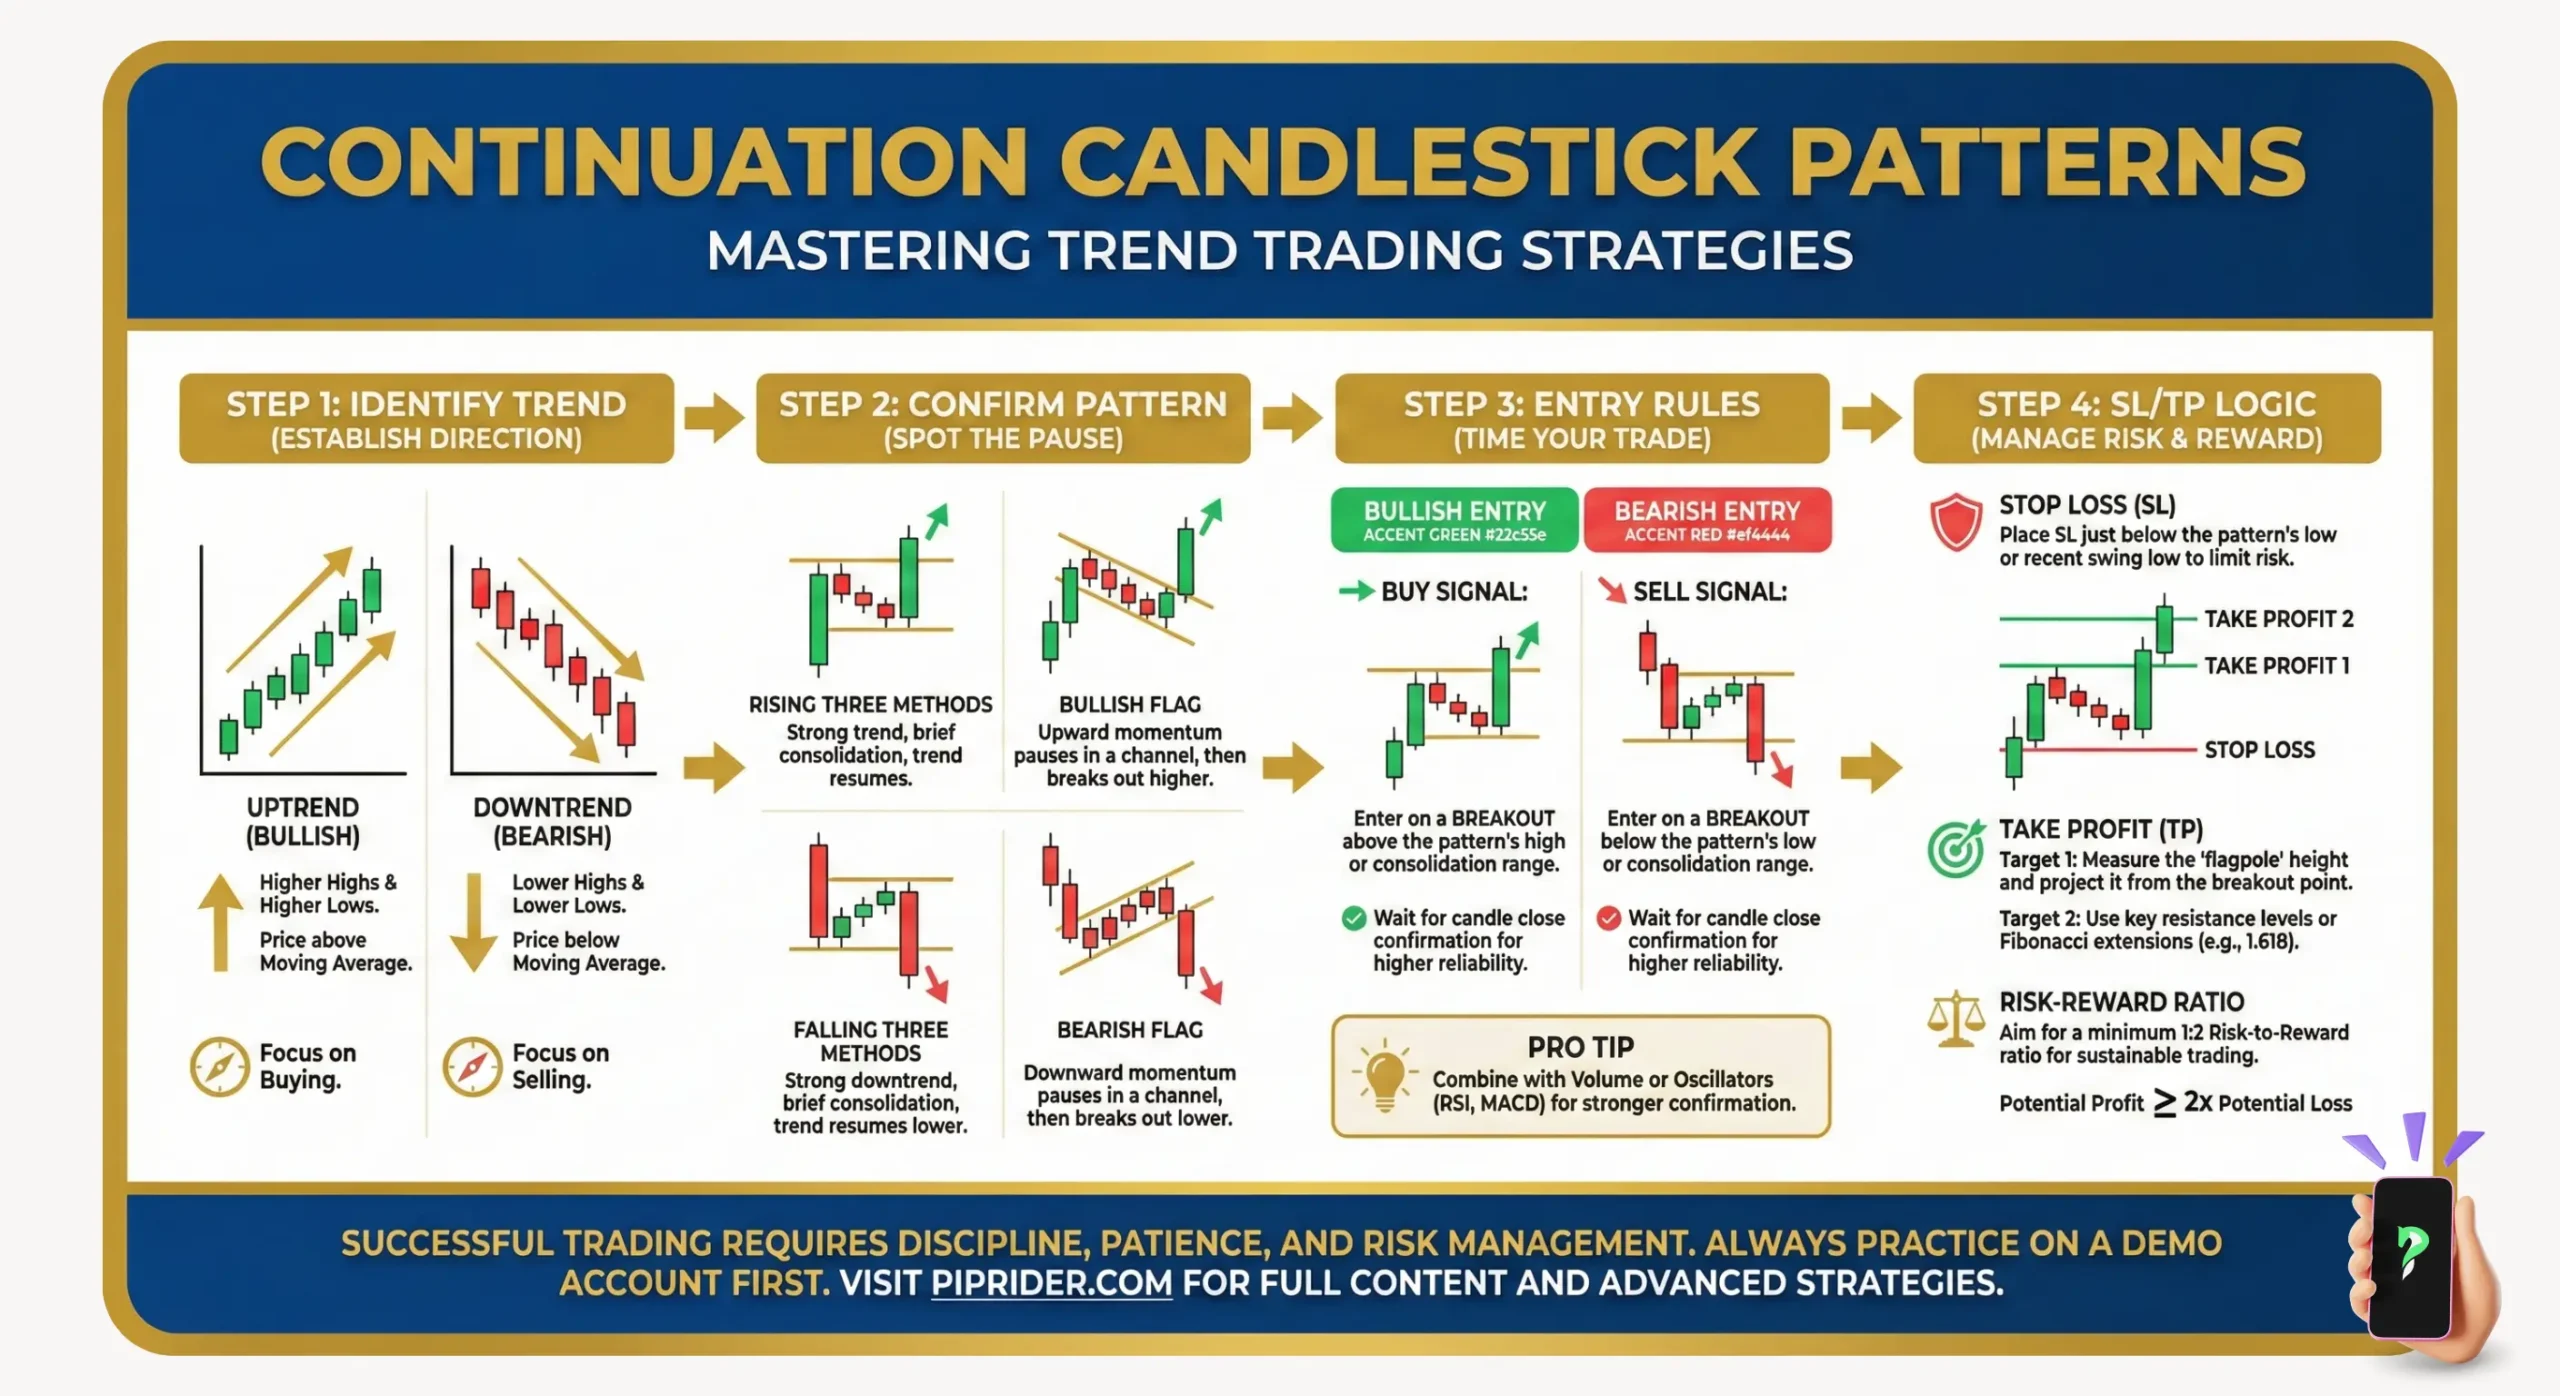
3.1. Entry & Exit Rules
Effective trading relies on structured execution and understanding exactly where your setup is invalidated.
Entry Modes (Choosing Your Aggression Level):
- Mode 1: The Breakout Close (Aggressive): Execute the trade immediately when the confirmation candle closes decisively outside the pattern’s boundary. This allows you to capture immediate momentum but carries a slightly higher risk of experiencing a false breakout (bull/bear trap).
- Mode 2: The Breakout + Retest (Conservative): Wait for the price to break out, then pull back to retest the broken boundary. Enter only when price action confirms the retest holds as new support (for Longs) or acts as firm resistance (for Shorts). This offers a safer entry and tighter Stop-Loss, though you may miss trades that explode without retesting.
Stop-Loss (SL) Placement: The Invalidation Level
Placing a stop “tightly inside” a pattern is a common retail trap that leads to being swept by volatility wicks. Instead, place your SL beyond the invalidation level, typically just outside the extreme high/low of the entire consolidation structure. Add a small volatility buffer (e.g., the spread + a fraction of the ATR) to survive market noise and typical stop-hunts.
Take-Profit (TP) Targets: The Scale-Out Approach
Only execute the trade if the market structure allows for a minimum 1:2 Risk-to-Reward ratio to your primary target.
- TP1 (Structural Target): Secure partial profits at the next major Higher Timeframe (HTF) Support or Resistance zone.
- TP2 (Trend Continuation): Target a “measured move” (a projected distance equal to the length of the prior impulse leg) or trail your stop-loss behind newly formed swing highs/lows to capture the extended trend.
3.2. The “Do Not Trade” Filters (Avoiding False Breakouts)
Not every continuation pattern is tradable. To dramatically reduce the probability of getting caught in a false breakout, abandon the setup immediately if any of the following occur:
- The Breakout is Just a Wick: If a candle pierces the pattern’s boundary but fails to close outside of it, it is a liquidity sweep, not a true breakout. Skip the trade.
- Counter to the HTF Trend: If the pattern signals a breakout on the 1-hour chart, but it conflicts with a massive prevailing trend on the Daily chart, ignore it. Never trade a continuation pattern directly into major HTF resistance/support.
- Momentum Divergence: If indicators like the RSI or MACD show clear divergence against the trend direction during the consolidation phase, the risk of a full reversal is too high.
- News & Liquidity Conditions: Avoid entering during high-impact macroeconomic news releases, periods of extremely low volume, or when broker spreads are abnormally wide.
3.3. Validating with Technical Indicators
Robust external validation adds significant conviction when trading these setups and helps confirm the filters mentioned above.
- Moving Averages (MAs): Use MAs (e.g., the 50 or 200-period) as a directional filter. Ideally, the pattern should form on the correct side of the MA (above for uptrends, below for downtrends) to help confirm alignment with the dominant market bias.
- RSI / MACD (Momentum Context): During the consolidation phase, momentum indicators should reflect a “resting” state (e.g., RSI hovering between 40-60; MACD lines contracting without diverging).
- Volume confirmation (Market Dependent): In centralized markets (like stocks or centralized crypto exchanges), actual volume should be low during the pattern’s formation and surge on the breakout. However, in the decentralized Spot Forex market, volume is typically tick volume (a proxy for activity). Therefore, for Spot FX, volume helps provide context but should be treated as a supportive confluence, not a mandatory requirement (Babypips, n.d.).
3.4. Multi-Timeframe Analysis for Continuation Patterns
Using multiple timeframes adds the final layer of conviction to your trade.
- Combining timeframes: Use the higher timeframe (e.g., Daily or 4-hour) to establish the dominant trend direction and identify major structural zones. Then, drop to the lower timeframe (e.g., 1-hour or 15-minute) to spot the specific continuation candlestick pattern and execute the precise Entry/SL rules.
- Advantage in filtering false signals: Confirming a pattern on the lower timeframe against a prevailing trend on the higher timeframe ensures you are trading with the institutional flow. This is the single most effective way to turn a standard setup into a highly actionable probabilistic edge.
4. Pros and Cons of Continuation Patterns
Trading continuation candlestick patterns offers clear advantages for trend-following traders, but requires strict vigilance regarding specific structural risks. Understanding these strengths and limitations is crucial for building a probabilistic edge.
| Pros (Advantages) | Cons (Disadvantages) |
|---|---|
|
|
5. Common Mistakes and How to Avoid Them
Avoiding these critical errors is as important as recognizing the continuation patterns themselves. Discipline separates profitable traders from those who suffer repeated losses from false breakouts.
- Confusing continuation with consolidation: Not every period of sideways movement leads to a continuation.
The fix: Only trade the pattern after the price breaks out in the direction of the long-term trend and is validated by Momentum Indicators (and Volume where applicable). - Entering too early without confirmation: This is the most costly mistake.
The fix: Strict adherence to patient trading. Always wait for the confirmation candle to close outside the pattern’s boundary to avoid immediate false breakouts. - Overtrading with continuation patterns: Seeing these patterns everywhere leads to taking too many low-quality setups.
The fix: Prioritize quality over quantity. Limit trades to patterns confirmed on higher timeframes (H4/Daily) and only when they align with all validation rules (Volume, MA, Momentum).
6. Frequently asked questions about Continuation Candlestick Patterns
7. Conclusion
Continuation candlestick patterns represent a structured, temporary pause in an active trend, offering a logical area to look for trend-following entries. Rather than viewing them as guaranteed signals, treat them as probabilistic setups that require strict context to be effective.
By prioritizing robust formations like the Rising Three Methods and waiting for confirmed breakouts, traders can base their decisions on structural logic rather than simply chasing market momentum.
Consistent execution requires discipline: always validate your pattern with external indicators (Volume, MAs, Momentum) and rigorously apply risk control by placing a tight Stop Loss beyond the structure’s invalidation level. To deepen your expertise in reading market structure and price action, explore Piprider’s other advanced analyses in the Analysis category.
Infographic Section
-
Continuation Candlestick Patterns -
Mastering Trend Trading Strategies -
Comparing Continuation Vs. Reversal Patterns


