
The Dark Cloud Cover pattern acts as an early warning system. This classic two-candlestick setup tells you that the “light” of an established uptrend is about to be obscured by the “dark clouds” of selling pressure. For traders ranging from beginner to intermediate, recognizing this visual cue is a valuable skill for locking in profits or initiating a well-timed short position.
This comprehensive guide breaks down the pattern’s psychology, identification rules, and practical trading applications. Importantly, while it is a powerful indicator, the Dark Cloud Cover is not a standalone signal; it works best with strict confirmation and resistance confluence, as it can easily fail in choppy or ranging markets.
Key Takeaways
- Dark Cloud Cover is a strong bearish reversal pattern that only appears after an established uptrend.
- It consists of two candles. TThe second, bearish (red/black) candle must open above the close of the prior bullish (green/white) candle.
- The pattern signals a major momentum shift from buyers (Bulls) to sellers (Bears).
- Do not trade the pattern in isolation. Its reliability significantly improves when confirmed by a resistance level or an overbought indicator like the RSI.
1. What Is a Dark Cloud Cover Pattern?
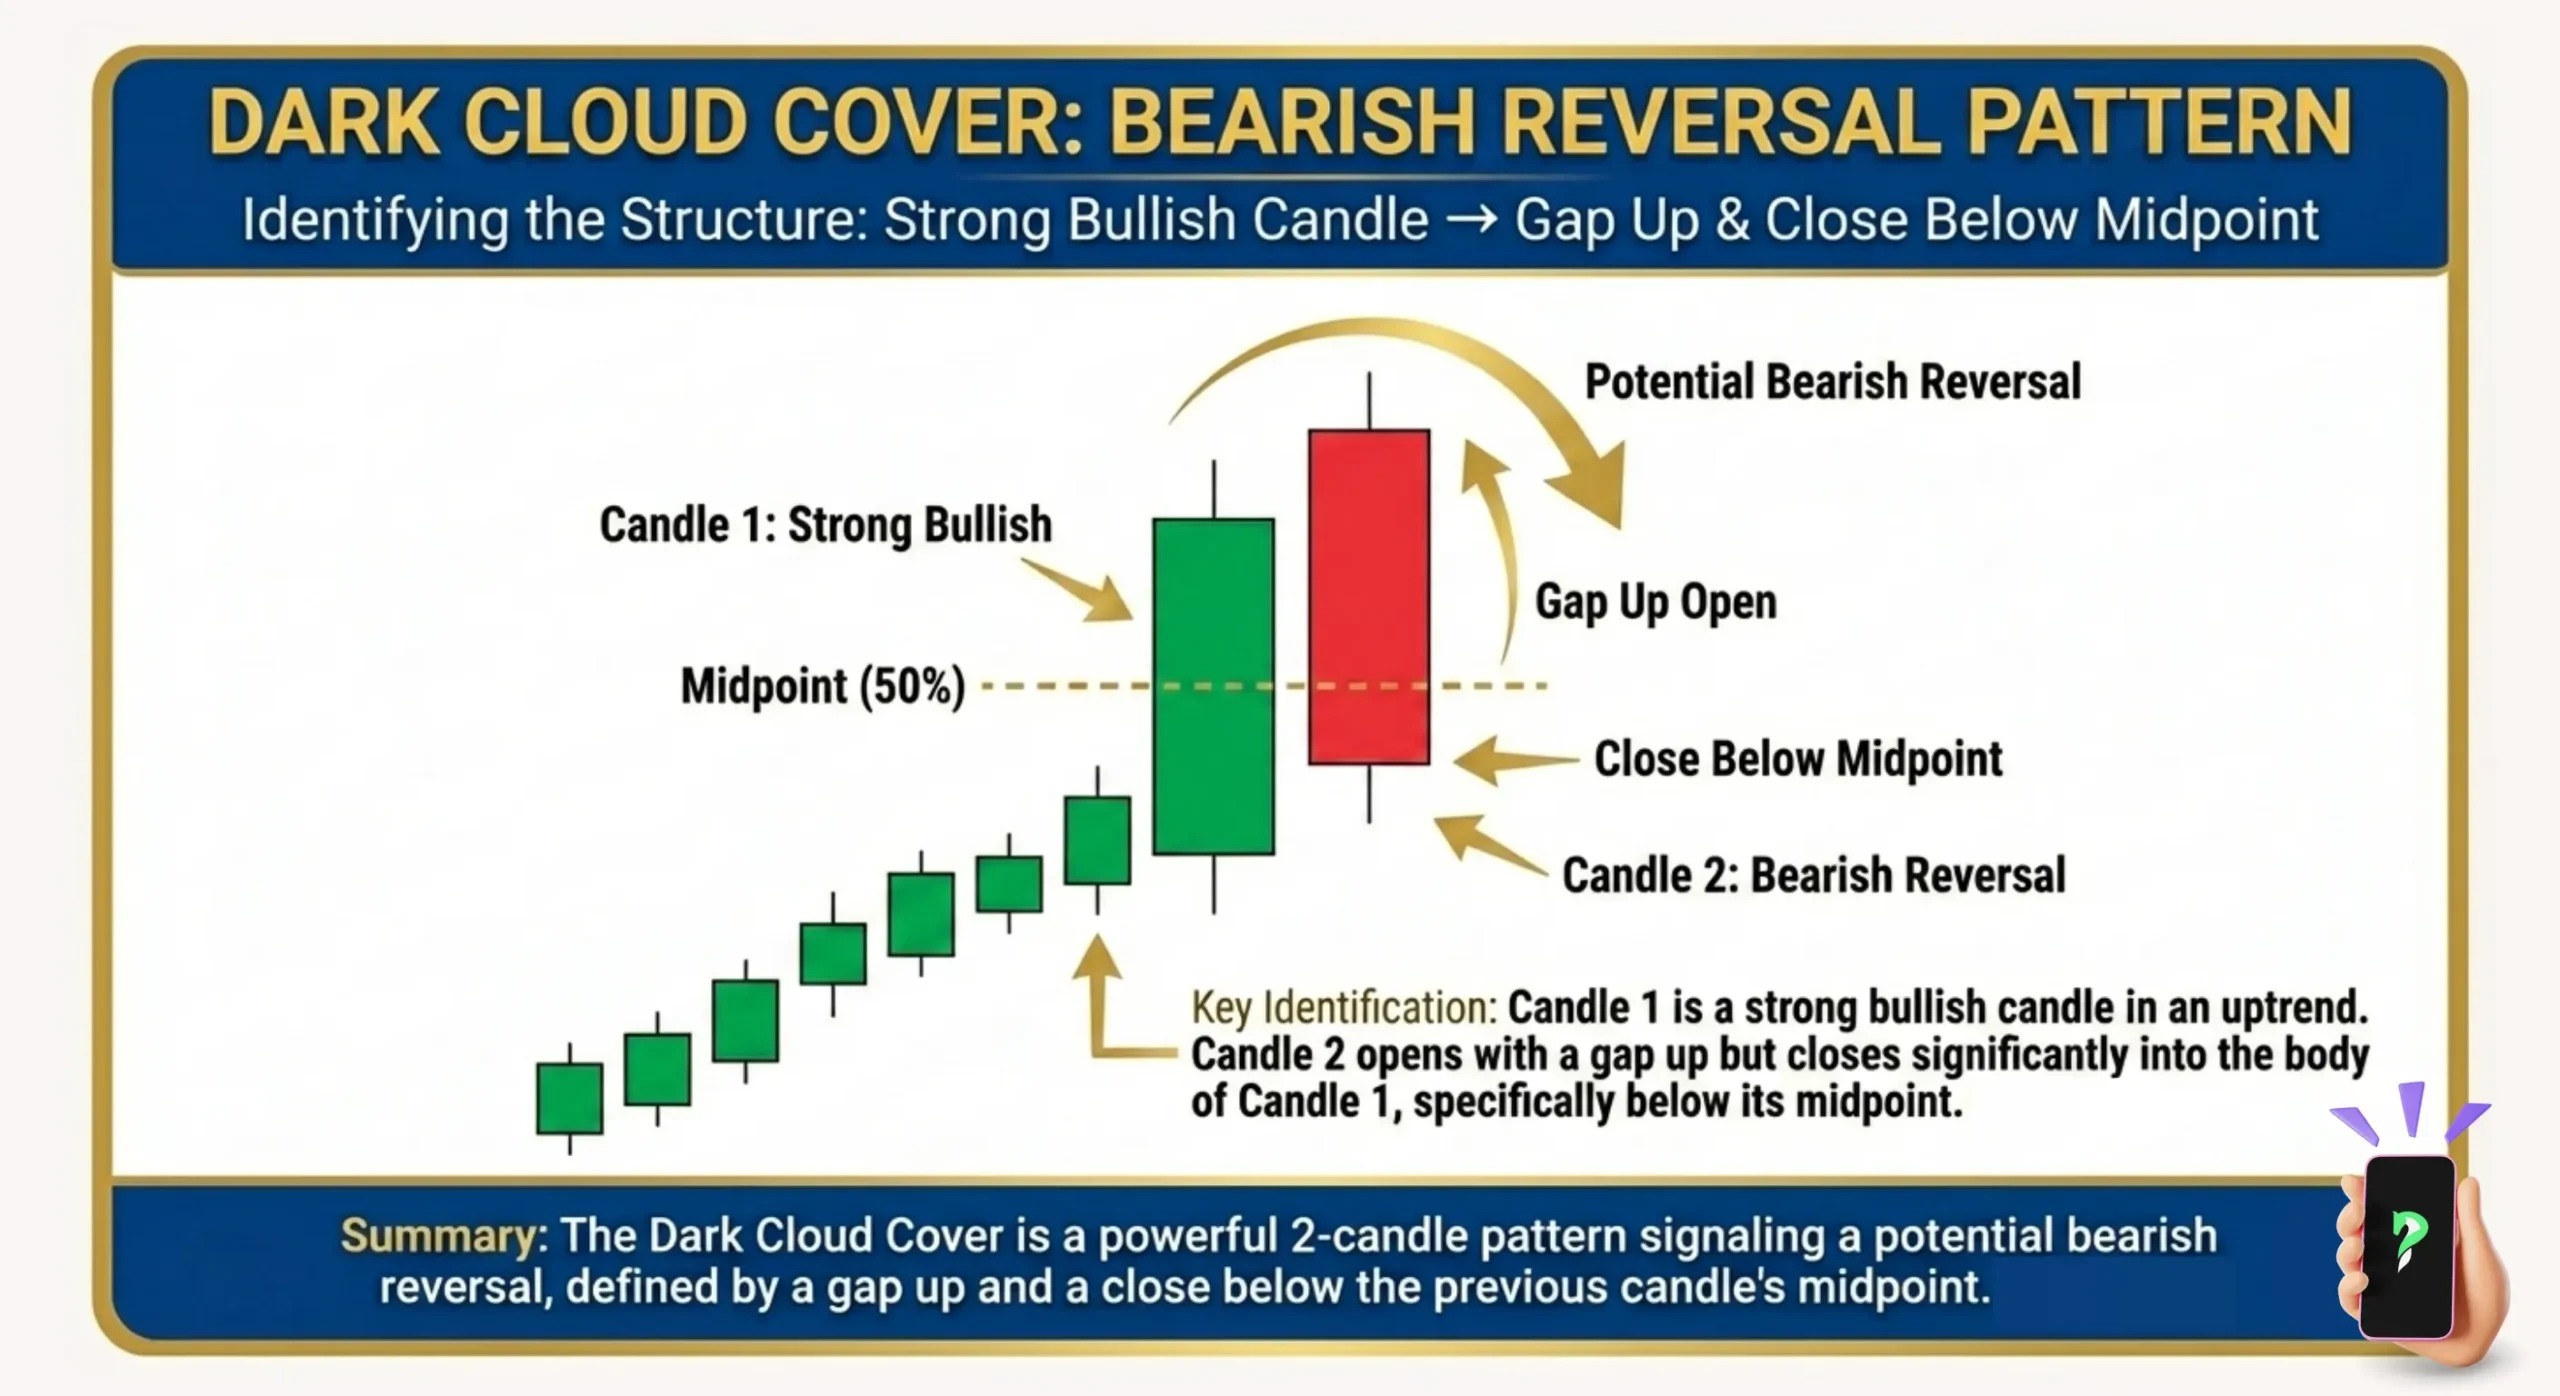
The Dark Cloud Cover is a prominent, two-candle bearish reversal pattern in technical analysis. It is specifically designed to warn traders that an existing uptrend is likely losing momentum and that sellers (Bears) are taking over from buyers (Bulls). This pattern is a strong visual indicator of a potential price decline and is always found at the top or near the end of an upward movement (Investopedia, n.d.).
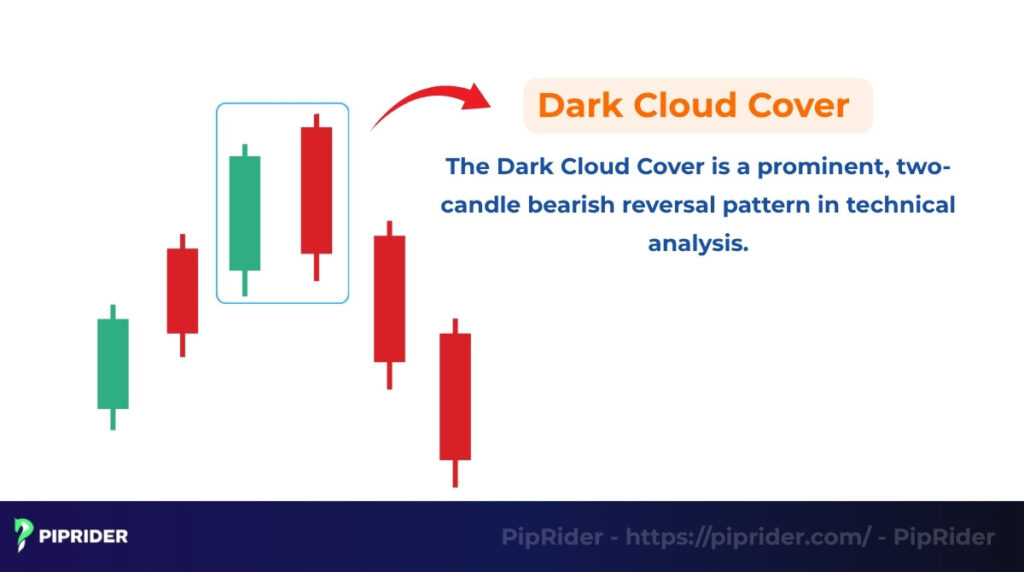
Imagine a sunny day (the uptrend) suddenly being overshadowed by a dark, heavy cloud.
- Candle 1: Represents the continued “sunny” trend, a long, strong bullish candle (green or white) showing high conviction from the buyers.
- Candle 2: Represents the “dark cloud”, a large bearish candle (red or black) that manages to push the price down significantly, closing deep into the body of the previous bullish candle.
1.1. Why Dark Cloud Cover Signals a Bearish Reversal
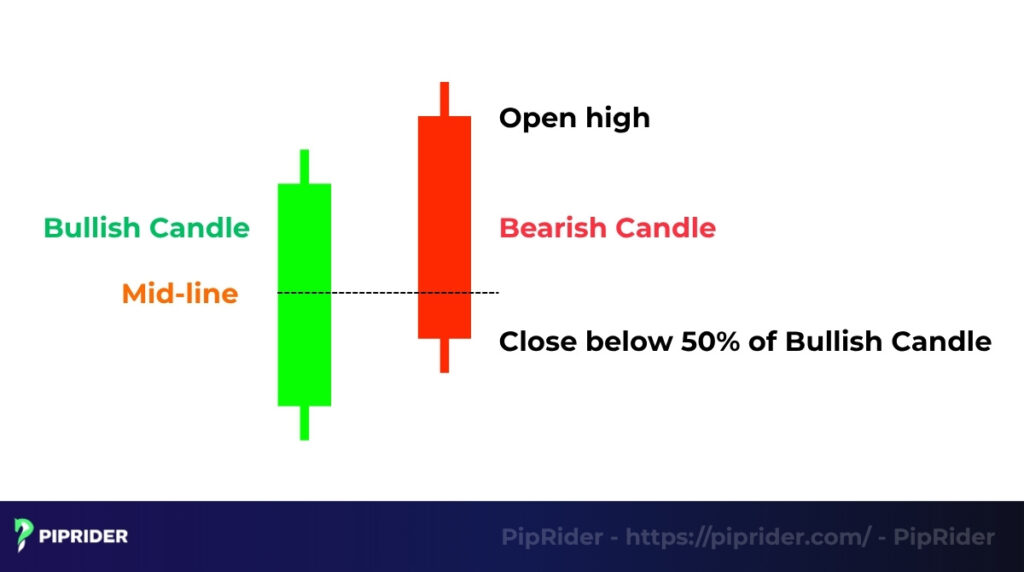
The logic of the Dark Cloud Cover is rooted in a psychological failure and reversal of market control. The pattern begins with a burst of buyer optimism where Candle 2 opens above the Candle 1 close (a “gap up” is more common in stocks; in Forex, it may simply be a higher open).
However, sellers immediately dominate, crushing these gains and pushing the price down to close below the 50% midpoint of the previous bullish candle. This reversal confirms the complete loss of control by the buyers and the establishment of bearish momentum (Corporate Finance Institute, n.d.).
1.2. Why It Matters to Traders
This pattern is vital as a clear objective warning system. It gives traders a precise moment to take profit on long positions, ideally before a major decline begins. More importantly, when combined with a strict confirmation candle, the pattern provides a defined entry zone for short-selling and a clear structural invalidation point for stop-loss placement (just above the second candle’s high, factoring in a spread buffer). This structure enables traders to act swiftly and manage their risk exposure effectively.
2. How the Dark Cloud Cover Pattern Forms
The Dark Cloud Cover pattern is defined by a specific sequence of trading action across two consecutive periods. Understanding this formation step-by-step reveals the precise moment market control shifts from buyers to sellers.
2.1. Step 1: The Dominant Bullish Candle (Candle 1)
The pattern always starts with a clear demonstration of strength from the Bulls, confirming the established uptrend.
- Appearance: This is a long, strong bullish (green or white) candle with little or no upper shadow.
- Significance: It confirms the existing uptrend is robust and buyers are currently in firm control. This candle sets the high expectation that the rally will continue.
2.2. Step 2: The Bearish Retracement (Candle 2)
This is the decisive candle, where sellers aggressively enter the market and push the price down, reversing the earlier optimism.
- Opening (The Higher Open): Candle 2 opens above the closing price of Candle 1. (Note: While a visual gap up is standard in stocks, in the continuous 24/5 Forex market, this may simply manifest as a slightly higher open). This initial push signals maximum, yet fleeting, optimism from buyers.
- Closing (The Reversal): Immediately after the open, sellers aggressively take control. The candle forms a large bearish (red or black) body and closes deep into the body of Candle 1.
2.3. Key Conditions for Pattern Validity
For the pattern to be officially recognized as a strong reversal signal, two non-negotiable rules must be met:
- Midpoint Close Rule: The bearish Candle 2 MUST close below the midpoint (50%) of the real body of the bullish Candle 1. A deeper close into Candle 1 strengthens the signal of seller conviction.
- Context Rule: The pattern MUST be preceded by a clear, established uptrend. If it appears during a sideways or consolidation phase, it loses its meaning as a powerful reversal indicator.
3. When and Where the Pattern Appears
The Dark Cloud Cover pattern is a versatile tool, but its predictive power relies entirely on the market context and the timeframe where it appears.
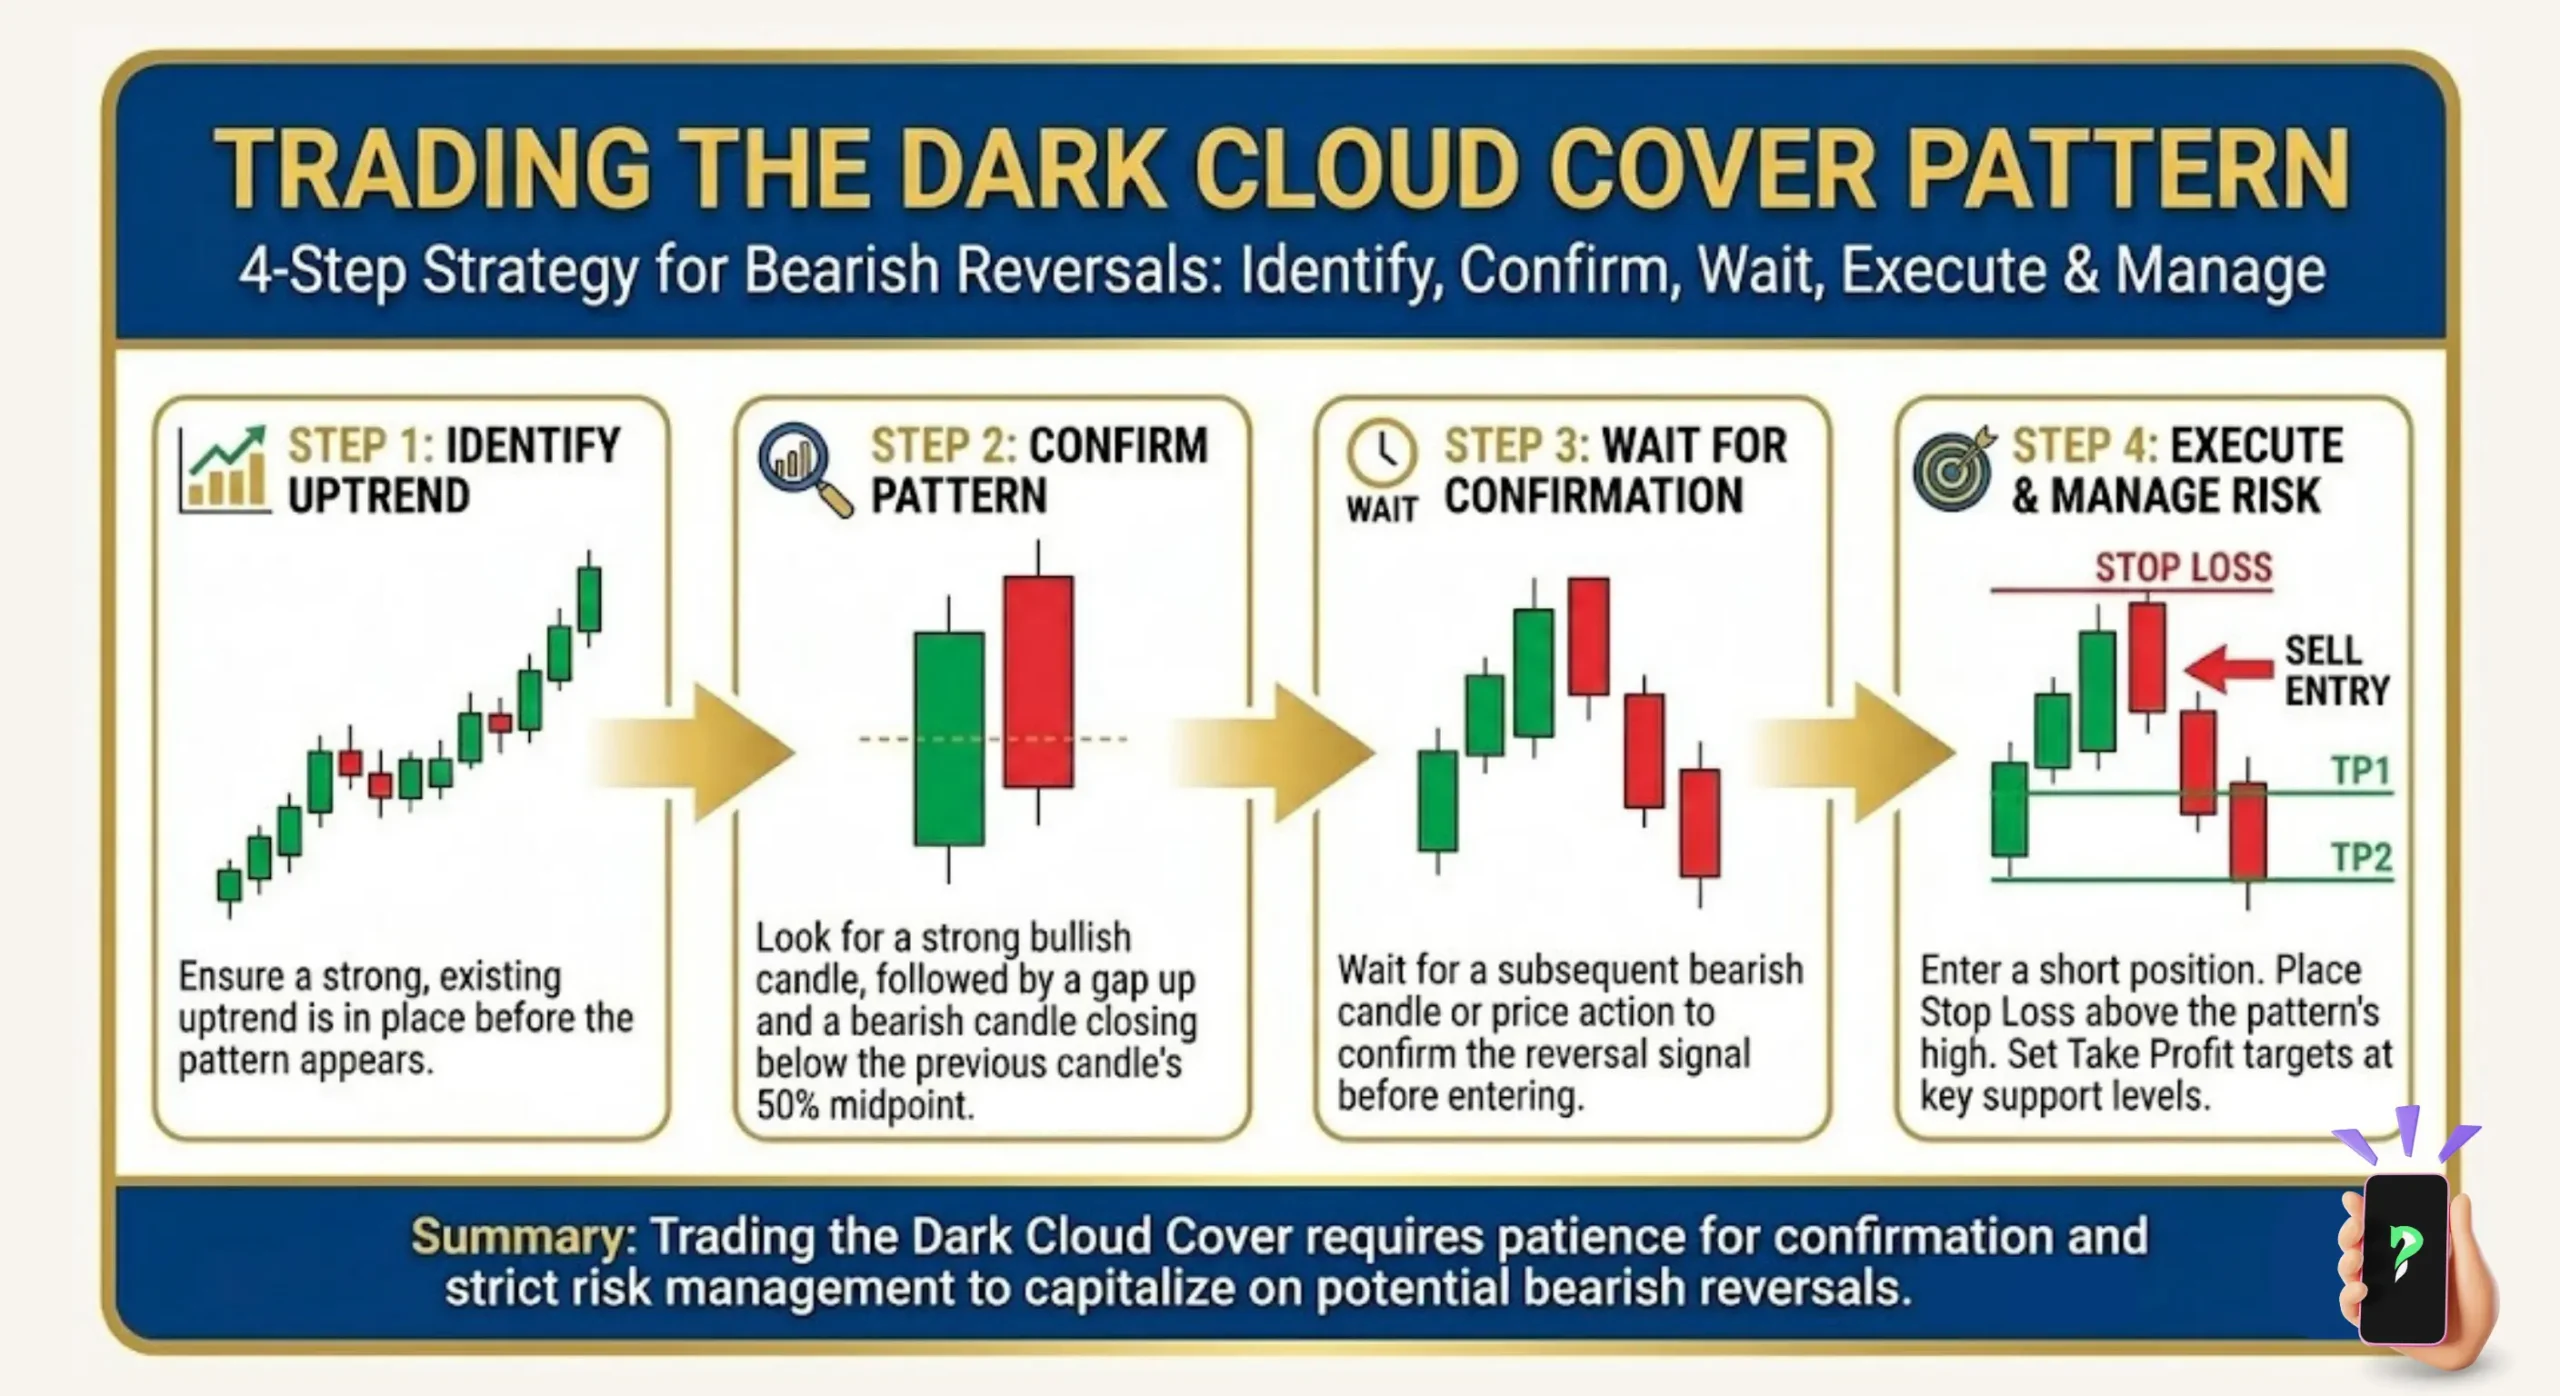
The pattern must appear after a clear, established uptrend to be valid. If it appears during a sideways (ranging) market, the signal is likely just noise and should be ignored. A confirmed uptrend is essential for the pattern to signal a genuine reversal. Traders must always assess current market conditions.
This two-candle pattern is universally applicable across various asset classes that utilize candlestick charts:
| Market | Significance | Common Application |
|---|---|---|
| Forex | High relevance due to 24/5 liquidity. Often used on major currency pairs, making it a critical dark cloud cover forex signal. | Timing short-term trend reversals (H1, H4 timeframes). |
| Stocks | Effective for corrections after major rallies. | Best used on Daily (D1) or Weekly (W1) charts for long-term shifts. |
| Crypto | Useful, but volatility requires extreme caution. | Prefer confirmation via volume spike or volatility expansion; always require a confirmation candle. |
The pattern’s frequency and reliability are inversely related to the timeframe used. Lower timeframes (M5, M15) show the pattern often but generate many false signals (low reliability due to market noise). Conversely, Higher timeframes (H4, Daily) show the pattern less often, but the signal carries significantly higher predictive power because it reflects a stronger consensus among institutional traders.
Rule of Thumb: Focus on identifying the pattern on Daily or H4 charts and only use lower timeframes for precise entry timing.
4. How to Identify the Dark Cloud Cover Pattern
Accurate visual identification is the first and most crucial step in trading the Dark Cloud Cover. Traders must verify the pattern against strict, quantifiable criteria, moving beyond a simple visual check.
- Uptrend Context: The pattern must form at a swing high following an established uptrend. Without a prior uptrend, the signal is invalid.
- Midpoint Close: Closing price of the bearish Candle 2 MUST fall below the midpoint (50%) of the real body of the prior bullish Candle 1. Deeper penetration confirms stronger selling conviction.
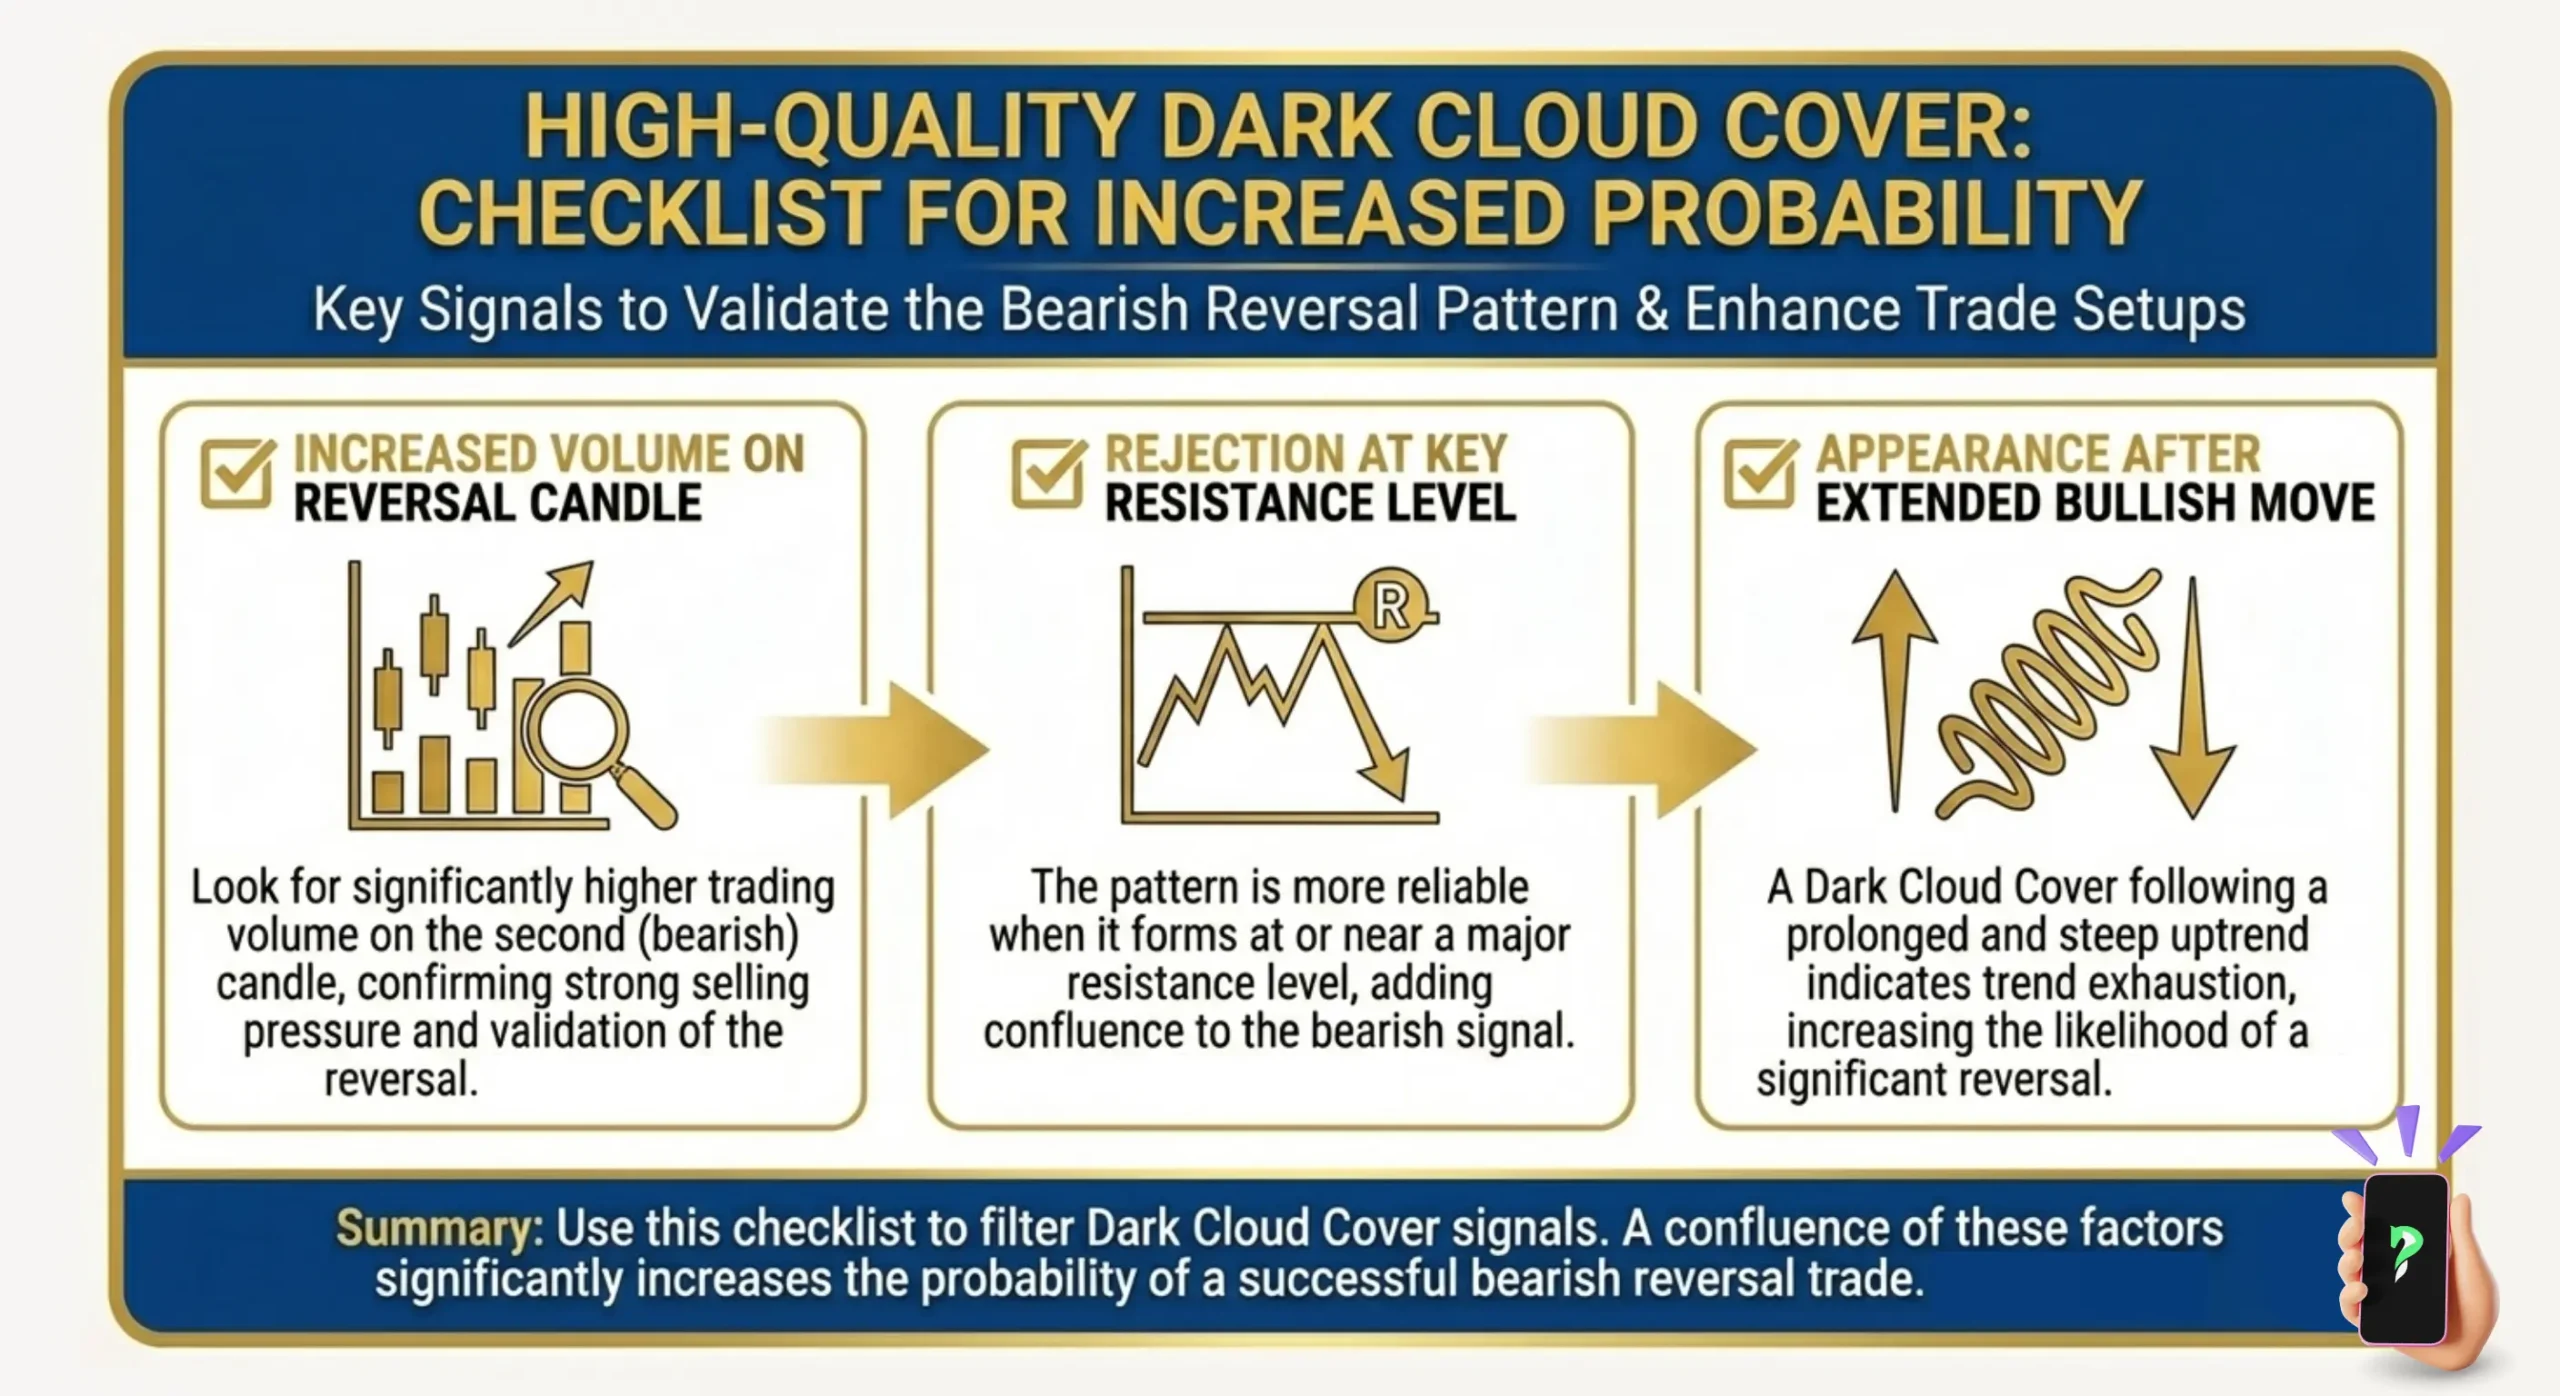
- Volume Confirmation: The bearish Candle 2 should ideally be accompanied by higher trading volume than Candle 1, indicating strong participation and selling interest. (Note: With Spot Forex, volume is typically “tick volume,” which acts only as a proxy. Therefore, use volume as a secondary confirmation, but always prioritize the strict close below the 50% midpoint, the break of Candle 2’s low, and confluence with a major resistance level).
For an optimal signal, the two candles should have:
- Long Bodies: Both Candle 1 and Candle 2 should have long real bodies, indicating decisive market action.
- Short Shadows: The upper and lower shadows (wicks) should be short, showing minimal indecision during the period.
5. Dark Cloud Cover vs. Other Candlestick Patterns
Understanding the subtle differences between the Dark Cloud Cover and similar patterns is essential to avoid misinterpretations and ensure you are acting on the strongest possible signal.
| Pattern | Number of Candles | Signal Type | Key Distinction from Dark Cloud Cover | Signal Strength |
|---|---|---|---|---|
| Dark Cloud Cover | 2 | Bearish | Closes below 50% of the prior body. | Strong |
| Bearish Engulfing | 2 | Bearish | The bearish candle’s body completely covers (engulfs) the entire body of the prior bullish candle (100% coverage). | Very Strong |
| Piercing Line | 2 | Bullish | It is the inverse pattern, appearing in a downtrend. The bullish candle closes above 50% of the prior bearish body. | Strong |
| Evening Star | 3 | Bearish | Requires three candles: a large bullish candle, a small body/Doji candle (the “star”), and a final large bearish candle. | Highest (Three-candle patterns generally offer greater confirmation). |
Key Takeaway: The Bearish Engulfing is the most aggressive form of this reversal and is often prioritized over the Dark Cloud Cover when both appear, while the Evening Star provides the highest degree of confidence due to its three-step confirmation process.
6. Accuracy and Reliability of the Pattern
The Dark Cloud Cover is classified as a strong reversal signal, but its reliability is heavily dependent on context and confirmation factors. No candlestick pattern is 100% accurate.
Historical backtesting suggests the Dark Cloud Cover has a moderate success rate (often cited around 60-65%), but this figure heavily depends on your chosen timeframe, the specific market, and your strict adherence to confirmation rules (QuantifiedStrategies, n.d.). As noted by market analysts, the pattern should be treated as an early warning system rather than a standalone entry signal; it always requires a bearish follow-through to be valid (TrendSpider, n.d.).
Its confidence rating significantly increases when the following conditions are met:
- Deep Penetration: The bearish candle (Candle 2) closes very deep into the bullish candle (Candle 1), ideally 75% or more.
- Confluence with Resistance: The pattern appears at a major confluence point, such as a strong historical resistance level, a psychological round number (e.g.,
1.1000), or a long-term Moving Average. - Trending Environment: The pattern is completely ineffective in sideways or choppy markets. If the broader market context isn’t a clear uptrend, the signal is likely just noise and should be ignored.
7. Examples of Dark Cloud Cover on a Chart
Let’s analyze two hypothetical scenarios, one in the stock market (where literal gaps occur) and one in Forex (where continuous liquidity changes the pattern’s appearance), to illustrate how the setup works in real-time.
7.1. Stock Scenario: The Classic Gap-Up ($XYZ Stock)
In traditional equity markets, the Dark Cloud Cover is often characterized by a distinct “gap up” at the open due to overnight orders. Here is how this classic pattern typically unfolds when a stock hits a major price ceiling.
- Prior Uptrend: Stock XYZ has been in a strong rally for three weeks, moving from $50 to $65. The price is currently testing a major historical resistance zone at the $65 level.
- Candle 1 (The Bull): The first day closes strongly bullish at $65. The real body of this candle spans from the open at $62 to the close at $65. (The midpoint of this body is calculated as: $62 + ($65 – $62) / 2 = $63.50).
- Candle 2 (The Dark Cloud):
- Open: The next morning, the price gaps up, opening optimistically at $66 (above the Candle 1 close). This shows buyer enthusiasm.
- Close: However, sellers (Bears) immediately dominate. By the end of the day, the price is aggressively pushed down, and the candle closes at $62.80.
- Confirmation: The closing price of $62.80 is clearly below the midpoint of the first candle ($63.50). This confirms the Dark Cloud Cover pattern.
- What the Example Tells Us: The pattern’s power comes from its location (at a resistance level) and the clear failure of buyers to maintain the gap-up. On the third day, the price opens lower and continues to fall. Traders who entered a short position or exited long positions after the close of Candle 2 would have profited as the stock entered a downtrend toward the next support level at $58.
7.2. Forex Scenario: The Resistance Sweep (EUR/USD)
Let’s look at a classic Forex application where literal “gaps” are rare, but the shift in market momentum is identical.
- Timeframe & Context: EUR/USD on a Daily (D1) chart has been in a steady uptrend and is now testing a major psychological resistance level at 1.1000.
- The Setup: Candle 1 is a strong bullish (green) candle. Candle 2 opens exactly at (or very slightly above) Candle 1’s close. It initially pushes up to pierce the 1.1000 resistance, but immediately faces massive selling pressure. It closes deep in the red, well below the 50% midpoint of Candle 1.
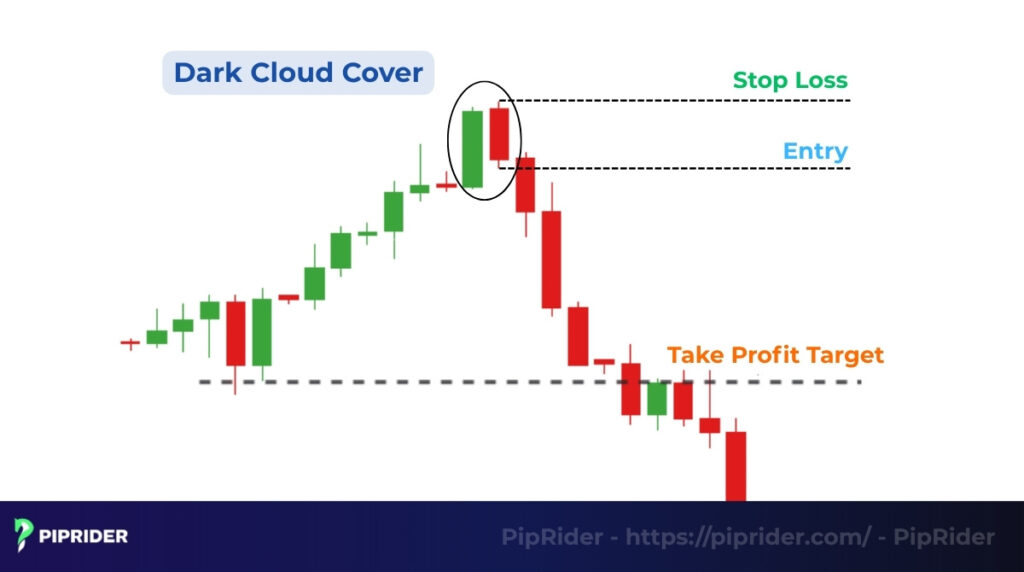
- Entry (Confirmation): A short position is executed only when the next daily candle breaks and closes below the low of Candle 2.
- Stop-Loss (SL): Placed at the high of Candle 2, plus a 5-10 pip buffer (e.g., Spread x 2) to survive typical Forex market noise and avoid stop-hunts.
- Take-Profit (TP): Set at the nearest structural support level, or targeting the 50% to 61.8% Fibonacci retracement zones of the prior uptrend.
8. How to Trade Using the Dark Cloud Cover
The Dark Cloud Cover pattern is a signal, not an entry order. Successful trading requires patience and a strict plan that defines exactly where to enter (Entry), where to exit if wrong (Stop-Loss), and where to take profits (Take-Profit).
8.1. Entry Strategy: The Confirmation Rule
To minimize the risk of false signals, always let the market tip its hand before committing your capital. Here are the three entry approaches based on your risk appetite:
- Aggressive Entry (High Risk, Best R:R): Enter a short (sell) position immediately at the close of Candle 2. You are anticipating the reversal early, which gives the best entry price but lacks confirmation.
- Standard Entry (Balanced): Enter a short position the moment the next candle’s price breaks below the low of Candle 2. This confirms immediate bearish momentum.
- Conservative Entry (Low Risk, Worse R:R): Wait for the next candle to officially close below the low of Candle 2. This is the safest confirmation but may result in a wider stop-loss distance.
8.2. Stop-Loss (SL) Placement: Defining Risk with a “Buffer”
The pattern itself provides the perfect structural point to define your maximum risk, but in the Forex and Crypto markets, you must actively protect your position against market noise, spread widening, and stop-hunts.
- The Placement: Place your Stop-Loss order above the highest point of the pattern (the high of Candle 2)—but never exactly on the high.
- The Pro Buffer Rule: Always add a small distance (a buffer) above the high to avoid being prematurely stopped out by a random volatility spike. Use this professional baseline formula:
SL = High of Candle 2 + Max(Spread x 2, ATR Buffer) - The Rationale: If the price trades above this adjusted buffer zone, it mathematically confirms that buyers have regained complete control. The reversal pattern is officially invalidated, and the short trade must be closed to protect your capital.
8.3. Take-Profit (TP) Target: Identifying Objectives
Your take-profit target should be based on structural levels that the price is likely to test next.
- Conservative Target: Target the nearest significant Support Level or the low of the preceding swing (the last trough before the pattern formed).
- Dynamic Target: Use the Fibonacci Retracement tool on the preceding uptrend. Common targets include the 50% or 61.8% retracement levels, which often act as magnetic price points.
- Pro Tip (Trailing Stop): Since the Dark Cloud Cover signals a major trend reversal, consider taking partial profits at your first target and using a trailing stop for the remaining position to ride the new downtrend.
8.4. Risk-Reward (R:R) Ratio
Always ensure your potential profit (TP) is significantly greater than your maximum risk (SL). Before pulling the trigger, measure the setup. Aim for a Risk-Reward Ratio of at least 1:2 or 1:3 (meaning you stand to gain twice or three times as much as you risk). If the R:R is less than 1:1, skip the trade—the math is not in your favor.
9. Tips to Improve Accuracy and Common Mistakes to Avoid
The Dark Cloud Cover is a powerful visual tool, but its effectiveness multiplies when combined with proper risk management and market context. These are essential trading tactics.
9.1. Tips for Higher Accuracy
To optimize accuracy and minimize the risk, you should apply the following tips:
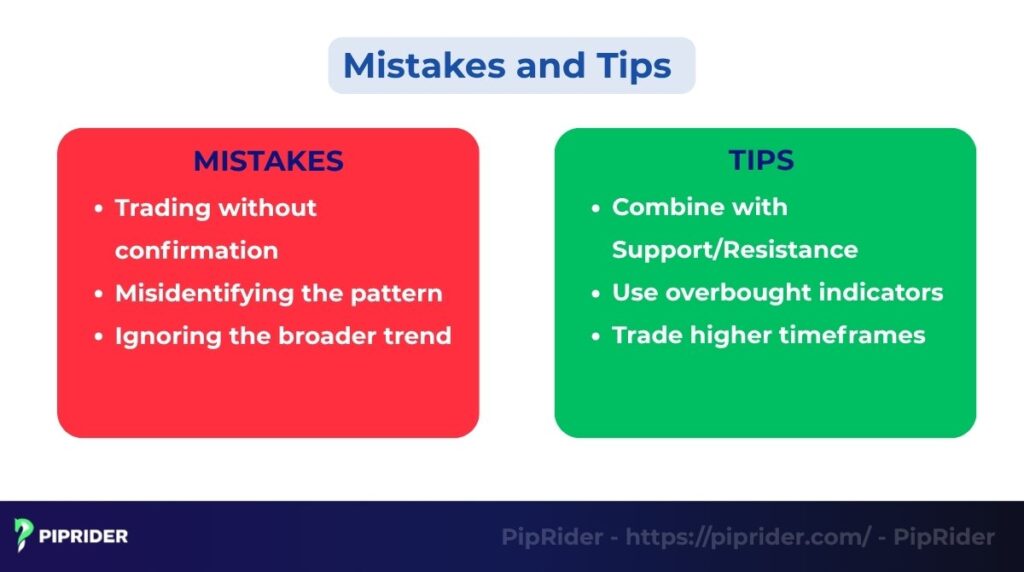
- Combine with Support/Resistance (S/R): Only take signals that form exactly at a strong resistance level. This confluence confirms institutional selling is likely occurring at a price ceiling.
- Use overbought indicators (RSI/Stochastics): Check for overbought conditions (RSI >70) when the pattern forms. This validates the reversal signal, as the rally is overextended.
- Trade higher timeframes: Focus on Daily (D1) or H4 charts. Higher timeframes filter out market noise and show stronger commitment from major market players, leading to more reliable signals.
9.2. Common Mistakes Traders Must Avoid
Even experienced traders make mistakes when trading candlestick patterns. Ensure you do not commit the following errors:
- Trading without confirmation: ALWAYS wait for the candle after the pattern to break the low of Candle 2 before entry. Entering early leads to a high risk of False Signals (Whipsaws).
- Misidentifying the pattern: Strictly enforce the 50% Midpoint Rule. Premature entry based on weak signs will lead to errors; the close MUST be below 50% of the prior body.
- Ignoring the broader trend: Do not enter a short position against strong, long-term bullish momentum. Check Weekly/Monthly charts to confirm the Broader Trend is actually topping out before acting on a Dark Cloud Cover signal.
10. FAQs (Frequently Asked Questions)
Here are quick answers to the most common questions about the Dark Cloud Cover pattern:
11. Conclusion
The Dark Cloud Cover pattern is a staple in the technical analyst’s toolkit, providing a clear, early warning of a bearish shift in momentum. Its effectiveness lies in its simple, powerful psychological narrative: the failure of buyers to maintain their initial strength and the aggressive takeover by sellers.
Mastery of this pattern is a key step toward making informed and disciplined trading decisions. Success in trading this pattern is not just about seeing the two candles. It’s about strictly adhering to the 50% rule, placing a clear Stop-Loss above the pattern’s high, and always waiting for confirmation from the next candle and external indicators.
Ready to deepen your technical analysis skills? Explore dozens of other essential candlestick patterns, chart formations, and indicators to refine your trading edge.
You can find more detailed articles and strategies from https://piprider.com/ in the dedicated Analysis section.
Infographic Section
-
Dark Cloud Cover: Bearish Reversal Pattern -
4 Step Strategy for Bearish Reversals -
Checklist for Increased Probability


