
the Marubozu stands out as one of the most decisive single candlestick patterns, signaling pure momentum without any hesitation from buyers or sellers. Defined by its complete lack of wicks, the Marubozu shows the absolute dominance of buyers or sellers for an entire trading session, a stark contrast to the indecision of a long legged doji candlestick.
It offers high-conviction signals for trend confirmation, identifying crucial breakout levels, and determining strong support and resistance. This type of charting is essential for technical traders.
This guide will break down the structure, explain the underlying market psychology, and provide actionable trading strategies focused on Volume validation and strict risk management.
Key Takeaways
- A single candlestick signifies that the opening and closing prices are the same as the period’s high and low.
- Represents the absolute control of one market side (buyers or sellers) from the moment the candle opens to the moment it closes.
- Classified into bullish (strong buying pressure) and bearish (strong selling pressure).
- Used for confirming the strength of a trend and identifying well-structured breakout and support/resistance levels.
- Never trade in isolation. Validation via volume spikes (Stocks/Crypto) or volatility expansion (Forex) is essential to confirm the strength of the move.
1. What is a Marubozu Candlestick?
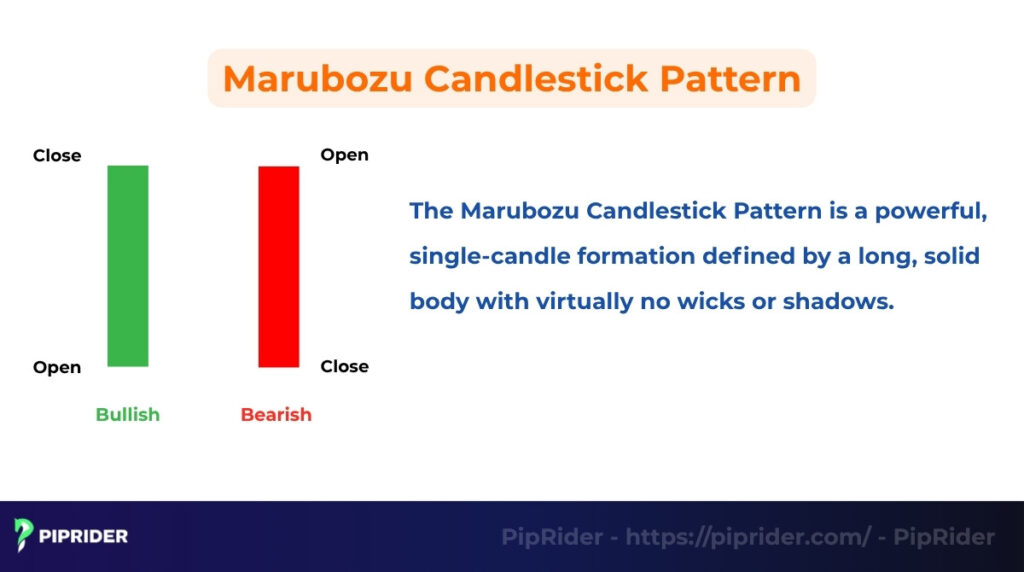
The Marubozu Candlestick Pattern is a decisive, single-candle formation characterized by a long, solid body with little to no wicks (Investopedia, n.d.). In its strictest structural form, the open and close prices correspond exactly to the session’s high and low extremes. According to the foundational principles of Japanese charting, this lack of price rejection signifies overwhelming control by a single market force (Nison, 2001).
Key Structural Characteristics: The Two-Tier Definition
To trade the Marubozu effectively, traders must move beyond the “no-wick” myth and understand the technical reality of its structure. This distinction is critical for filtering out weak signals in high-volatility markets.
- The Strict Marubozu (The Theoretical Ideal): In this perfect formation, the Open/Close prices are mathematically identical to the High/Low extremes. There are zero shadows or wicks.
- Psychology: Represents absolute, uncontested dominance from the opening bell to the closing second.
- Occurrence: Rare on lower timeframes; carries immense weight when identified on Daily or Weekly charts.
- The Practical Marubozu (Market Reality): In fast-moving markets like Forex or Crypto, a candle is often classified as a Marubozu even with minimal wicks.
- The 5% Rule: For the momentum signal to remain valid, the real body must represent at least 95% of the total candle range (Bulkowski, 2008). If the wicks exceed 5% of the total length, the candle signals a potential loss of control or a minor rejection, losing its Marubozu status.
- The Relative Length Rule (Contextual Size): A Marubozu is only significant if its body is “long” relative to recent price action.
- Benchmarking: The body should be at least two to three times larger than the average candle size of the previous 20 periods, or significantly exceed the current Average True Range (ATR). A tiny candle with no wicks is simply “low-volatility noise,” not a momentum signal.
2. How Does a Marubozu Pattern Work?
The Marubozu reflects a significant order flow imbalance. In technical terms, it proves that one side (buyers or sellers) was aggressive enough to absorb all opposing liquidity throughout the session. The lack of significant wicks indicates that there was very little “tug-of-war”; instead, it was a one-sided drive, signaling high institutional commitment.
The pattern typically signals strength in two primary market scenarios:
- Decisive Breakouts: The Marubozu often acts as the “hammer” that breaks a major horizontal support or resistance level. Its solid body confirms that the breakout is not a “fakeout” caused by retail noise, but a genuine shift in market structure.
- Trend Acceleration: When appearing mid-trend, it acts as a momentum reinforcement. It signals that the dominant side is doubling down on their positions, suggesting that the “path of least resistance” remains firmly in one direction.
Trend Continuation vs. Reversal Signal
A Marubozu’s meaning is derived entirely from its location relative to the previous price action:
- Continuation (Most Reliable): When a Marubozu forms after a consolidation or a minor pullback in an existing trend, it validates the trend’s health. This is its most common and high-confluence use case.
- Reversal (Exhaustion Signal): On rare occasions, if a Marubozu appears after a long, vertical move far from the Mean (Moving Averages), it may represent a “Buying or Selling Climax.” This is the final surge of FOMO before the trend runs out of breath.
3. Types of Marubozu: Bullish, Bearish, and Variants
The Marubozu pattern appears in two primary forms. While they are mirror images structurally, each provides a distinct and powerful signal about which side is dictating the order flow.
3.1. Bullish Marubozu (The Green/White Candle)
The Bullish Marubozu is a definitive bullish candlestick pattern, indicating a significant order flow imbalance where demand completely outstrips supply.
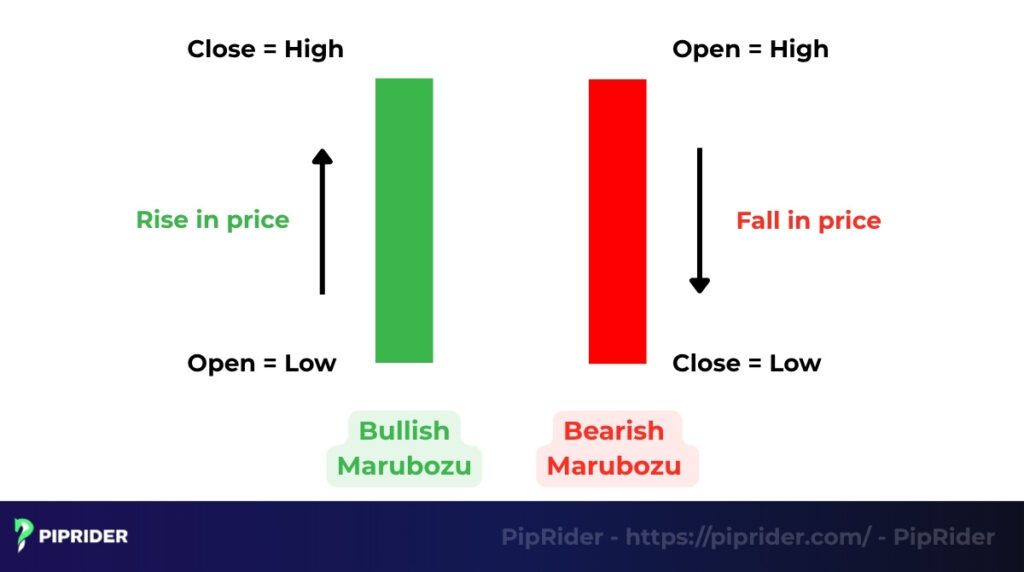
- Identification: It is a long, green (or white) candle with virtually no upper or lower shadow. Structurally, the open price equals the low price, and the close price equals the high price (Open=Low and Close=High). This serves as a powerful visual representation of total market control.
- Market Psychology & Significance: It signifies that buyers were in aggressive, uncontested control from the opening bell to the final second. In an uptrend, it validates the absolute dominance of buyers. It acts as a strong trend continuation pattern or a decisive breakout signal, indicating that the path of least resistance is firmly upward.
- Practical Example: If the price is consolidating below a major horizontal resistance level and a Bullish Marubozu breaks cleanly above that level, validated by a volume spike or ATR expansion, it gives a highly confident entry signal for a long position. It demonstrates sustained buyer commitment rather than a temporary fakeout.
3.2. Bearish Marubozu (The Red/Black Candle)
The Bearish Marubozu is a definitive bearish candlestick pattern, indicating a severe order flow imbalance where supply completely overwhelms demand.
- Identification: It is a long, red (or black) candle with virtually no upper or lower shadow. Structurally, the open price equals the high price, and the close price equals the low price (Open=High and Close=Low).
- Market Psychology & Significance: It indicates total dominance by sellers. The lack of a lower wick proves that the market closed at its absolute point of maximum pain for buyers. In a downtrend, it signals accelerating momentum, validating the existing downward structure or confirming a sharp breakdown of a support level.
- Practical Example: If the price is trading near a critical support level and a Bearish Marubozu closes cleanly below that floor on high volume, it signifies strong institutional conviction for a continued downward movement. This offers a clear, well-structured setup for a short position.
3.3. Marubozu Variants: Identifying One-Sided Momentum
In a perfect market, a Marubozu has zero wicks. However, real-world price action often produces ‘partial’ versions such as Opening and Closing Marubozus (CandleScanner, n.d.). Understanding these variants is critical so you don’t miss strong trend signals just because a tiny shadow appears on one end.
- The Opening Marubozu (Conviction from the Start) This variant signifies that the dominant side took control the moment the candle opened, leaving no wick at the starting price.
- Bullish Opening: The Open price is the absolute Low. A tiny upper wick suggests minor profit-taking before the close, but the buyers remained aggressive throughout.
- Bearish Opening: The Open price is the absolute High. A tiny lower wick indicates a small bounce at the end, but sellers dominated the initial direction.
- The Closing Marubozu (Strength until the Finish) Technically more significant for continuation traders, this variant shows that the market closed at its extreme, proving no one wanted to bet against the move at the end.
- Bullish Closing: The Close price is the absolute High. Even if there was a small dip after the open (lower wick), the bulls overwhelmed the market to finish at the top.
- Bearish Closing: The Close price is the absolute Low. Despite a small initial rally (upper wick), the bears collapsed the price to finish at the very bottom.
Expert Trading Insight: Closing Marubozus are often higher-probability signals for “Next Candle Open” entries. Because there is no wick at the close, it indicates that the momentum is still at its absolute peak exactly when the session ends.
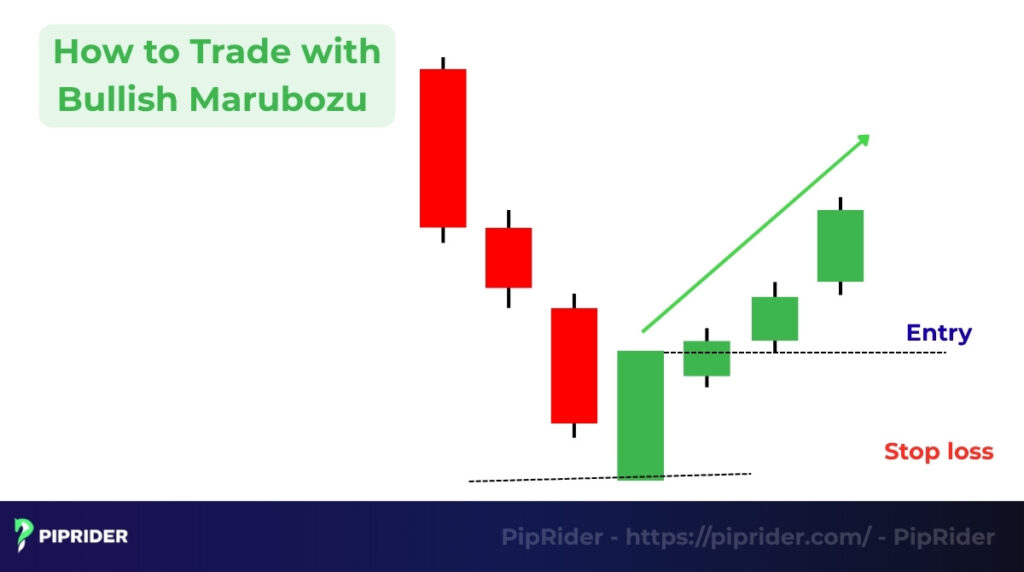
4. How to Trade with Marubozu
Identifying a Marubozu only provides the initial signal; turning it into a profitable trade requires a robust, rule-based strategy. The key is defining precise entry, stop-loss, and profit targets based directly on the pattern’s strong structure and the market’s context.
4.1. Entry Signals: Choosing Your Style
Identifying a Marubozu provides the signal, but your execution style determines your long-term survival. To avoid “chasing” a long-bodied candle after the move has already extended, choose one of these three entry modes:
- Aggressive Entry (Momentum): Enter at the open of the very next candle (C2). This is only recommended if the Marubozu is breaking out of a long consolidation and is supported by a significant volume spike (Stocks) or strong tick momentum (Forex).
- Conservative Entry (Confirmation): Wait for C2 to break the High (for Longs) or Low (for Shorts) of the Marubozu candle. This validates that the directional pressure is still intact and reduces the risk of entering on a “final push” exhaustion candle.
- Pullback Entry (Efficiency): Wait for the price to retrace and retest the 50% midpoint of the Marubozu body or the recently broken S/R level. This provides a superior Risk-to-Reward (R:R) ratio, though it carries the risk of missing the trade if the trend is exceptionally strong.
4.2. Exit & Risk Management: Protecting Your Capital
Because Marubozu candles often represent high-volatility moves, placing a stop-loss without a “safety buffer” frequently leads to premature stop-outs due to market noise or broker spreads.
- Stop-Loss (SL) Placement: Never place your SL exactly at the high/low of the Marubozu. In decentralized markets like Forex, you must account for the spread and random volatility.
- The Buffer Formula: Stop-Loss (SL) = High/Low ± Buffer
- Defining the Buffer: To ensure your position isn’t “hunted” by market noise or spread expansion, use a buffer of at least 2 × Spread or 0.2 to 0.3 × ATR (Average True Range). This ensures your position survives minor volatility wicks before the trend resumes.
- The “Long Body” Trap: If the Marubozu is exceptionally large (e.g., following a news event), a standard SL at the opposite end may result in a poor R:R ratio. In these cases, it is often better to reduce position size or use the 50% midpoint as a structural SL.
- Take-Profit (TP) Target: Aim for the next major structural Support or Resistance level. Always ensure the setup maintains a minimum 1:2 Risk-to-Reward ratio to maintain a sustainable mathematical edge.
5. Trading Tips for Marubozu
Successfully trading the Marubozu requires validating its momentum signal with external tools and strictly adhering to market context. Follow these professional guidelines to filter out weak signals and avoid common traps:
- Validation through Volume and Volatility: Never trade a Marubozu in isolation. For centralized markets (Stocks/Crypto), look for a significant Volume spike relative to the previous 20 periods. In decentralized markets like Forex, prioritize Volatility Expansion; the candle body should significantly exceed the current Average True Range (ATR) and be supported by a surge in Tick Volume (proxy) (OANDA, nd.).
- Combining with Trend Indicators: The most effective Marubozu setups occur when the pattern aligns with a Moving Average (e.g., 20 or 50 EMA). A Marubozu that rejects a dynamic EMA during a trend or breaks out as the RSI crosses the 50-neutral zone offers a high-confluence entry. However, be cautious if the RSI is already deep in overbought (>70) or oversold (<30) territory, as the candle might represent an exhaustion move.
- Multi-timeframe Discipline: Always verify the dominant direction on a High Timeframe (Daily or H4) before taking a signal on a Low Timeframe (H1 or M15). A Bullish Marubozu on the M15 is only a high-confluence trade if the H4 trend is also bullish. This “top-down” approach is essential for filtering out minor price noise.
- Context over Formation: Avoid trading Marubozu patterns in sideways or choppy consolidation. This is a momentum signal; it requires a clear established trend or a decisive breakout of a major structural level to be valid. Furthermore, do not confuse a Marubozu with a pin bar; while both are long candles, a Pin Bar signals price rejection, whereas a Marubozu signals total directional commitment.
6. Real-World Marubozu Trading Examples
The following cases illustrate how to convert structural signals into high-confluence trades. These examples highlight the divergence between trading centralized markets (Stocks) and decentralized markets (Forex).
Example 1: Bullish Marubozu Breakout (EUR/USD, H4 Chart)
- The Signal: A Bullish Closing Marubozu formed, closing at 1.1198, breaking the 1.1200 resistance.
- Validation: Supported by volatility expansion (body > 2.5x ATR) and a spike in tick activity during the London session open.
- Trade Execution:
- Entry (Conservative): Entered at 1.1207 after the next candle broke the Marubozu’s high.
- Stop-Loss (SL): Placed at 1.1137 (Low of 1.1140 minus a 3-pip buffer).
- Take-Profit (TP): Target set at 1.1333 (Next Daily Resistance).
- Management: Once the price reached a 1:1 R:R ratio, the SL was moved to Breakeven to risk-free the trade.
Example 2: Bearish Marubozu Breakdown (AAPL, Daily Chart)
- The Signal: A Bearish Opening Marubozu collapsed through the triangle support at $176.00.
- Validation: Centralized Volume spiked to 3x the 20-day average, confirming institutional selling.
- Trade Execution:
- Entry (Aggressive): Entered Short at $175.50 on the open of the next candle.
- Stop-Loss (SL): Placed at $178.10 (High of $178.00 plus a $0.10 buffer).
- Take-Profit (TP): Target set at $170.30 based on the triangle’s measured move.
- Management: As momentum accelerated, a trailing stop was placed behind the high of each subsequent bearish candle to capture maximum profit.
Marubozu Trade Example Summary Table
| Market | TF | Setup | Entry Mode | Entry | Stop-Loss | Take-Profit | R:R Ratio |
|---|---|---|---|---|---|---|---|
| EUR/USD | H4 | S/R Breakout | Conservative | 1.1207 | 1.1137 | 1.1333 | 1:1.8 |
| AAPL | Daily | Triangle Breakdown | Aggressive | $175.50 | $178.10 | $170.30 | 1:2.0 |
7. Advantages and Limitations of the Marubozu
The Marubozu is the market’s way of “shouting” its intentions. While it offers high-speed momentum, its aggressive nature comes with a price. Understanding these trade-offs is essential for professional execution.
Advantages
- Decisive Visual Signal: Unlike Dojis or Spinning Tops that reflect indecision, the Marubozu provides immediate clarity. It proves one side has completely “absorbed” the opposition, leaving no doubt about the current sentiment.
- Clear Structural Invalidation: It offers objective points for Stop-Loss placement. Since the candle represents a high-conviction move, the high or low of the Marubozu serves as a natural “line in the sand” where the trade setup becomes invalid.
- Reliable Breakout Confirmation: It is arguably the best pattern for validating a breakout. When a Marubozu shatters a key S/R level with a volume spike (Stocks) or ATR expansion (Forex), the probability of a “fakeout” is significantly reduced.
Limitations
- The “Long Body” R:R Trap: This is the pattern’s greatest paradox. Because the candle is so strong, it is often very long, meaning a standard SL at the opposite end creates a poor initial Risk-to-Reward (R:R) ratio. Traders must often wait for a pullback or use the “50% Midpoint rule” to stay mathematically profitable.
- The Sideways “False Alarm”: In low-liquidity or choppy markets, a Marubozu can be misleading. Without a clear trend context, it may simply be a temporary “stop-run” or news-driven spike that fails to sustain momentum, leading to a whipsaw.
- Requires Confirmation: No matter how solid it looks, a Marubozu should never be traded in isolation. It needs contextual validation, such as RSI alignment, session liquidity, or volume/tick activity to confirm that the move is backed by institutional flow.
8. Frequently asked questions about Marubozu Candlestick Pattern
9. Conclusion
The Marubozu Candlestick Pattern is the clearest visual indicator of absolute dominance in price action. Its primary role is providing powerful trend verification and validating decisive breakouts.
Success with this pattern demands discipline. Never trade it in isolation; always verify the signal with higher-timeframe trend analysis and volume/volatility indicators. Finally, practice strict risk management: because the Marubozu’s long body can skew your Risk-to-Reward ratio, be prepared to use pullback entries or 50% midpoint stop-losses to maintain your mathematical edge.
To explore more high-confluence setups and professional trading systems, visit the Analysis section at Piprider.


