
The Piercing Candlestick Pattern is a potent, two-candle bullish reversal signal. For experienced traders, merely spotting the pattern is insufficient; its value lies in recognizing the aggressive psychological shift and the technical confluence required for a high-probability trade.
This guide moves beyond basic identification, focusing on the critical validation factors: Volume spikes, market structure, and indicator synergy, that transform this signal into a reliable trade entry. Piprider will detail the precise execution plan to leverage the Piercing Line effectively.
Key Takeaways
- The 50% rule: The bullish piercing candle must close above the 50% midpoint of the prior bearish body. This “piercing” action is the core validation of buyer enthusiasm.
- Confluence is key: The pattern’s reliability requires alignment with major Support levels and a definitive spike in volume on the second candle.
- Risk management: Always define the Stop Loss (SL) by placing it just below the Piercing Line’s absolute low.
- Strength comparison: The Piercing Candlestick signals a strong rejection of lower prices but does not represent the complete buyer domination seen in the Bullish Engulfing pattern.
1. What is a Piercing Candlestick Pattern?
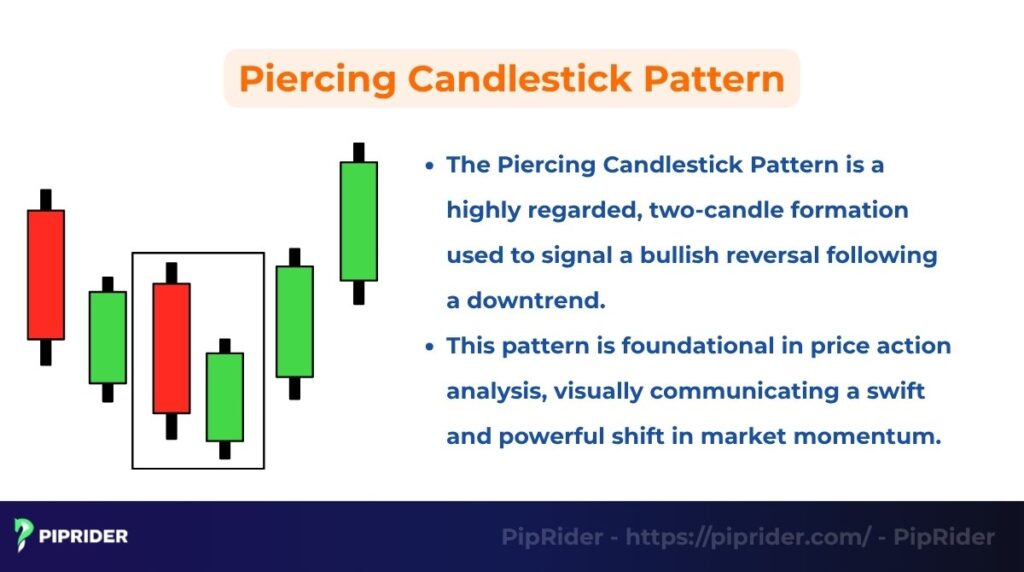
The Piercing Candlestick Pattern is a highly regarded, two-candle formation that signals a bullish reversal following a sustained downtrend (Bajaj Finserv, 2025). Foundational in price action analysis, this pattern visually communicates a swift shift in market momentum where buyers begin to overwhelm sellers at a potential price floor.
1.1. Structure of the Piercing Pattern
To accurately identify a high-probability Piercing Pattern, traders use the following structural checklist:
- Established downtrend: The pattern must appear after a clear series of lower lows. It is not a reversal signal if the market is moving sideways.
- Candle 1 (Bearish setup): A long, bearish (red/black) candle that continues the existing downward momentum, confirming seller control.
- Candle 2 (Bullish reversal):
- The gap down: The second candle must open below the previous candle’s close (creating a visible gap, common in stocks and indices).
- The 50% pierce: The candle must rally and close above the 50% midpoint of the first candle’s real body.
- Volume validation: A noticeable spike in trading volume on the second candle significantly increases the pattern’s reliability.
1.2. Invalid setups: When to ignore the pattern
Not every two-candle setup that looks like a Piercing Line is tradable. Avoid the following “Invalid setups”:
- Failure to reach midpoint: If the second candle closes below the 50% level of the first candle, it is considered a “Thrusting Pattern,” which is often a bearish continuation signal rather than a reversal.
- No prior downtrend: If the pattern forms in a range-bound (sideways) market, it is likely market noise and lacks the momentum required for a trend reversal.
- Small candle bodies: If both candles have very small real bodies (resembling Dojis), the signal is weak as it indicates indecision rather than a decisive shift in power.
1.3. Significance in a Downtrend Context
The Piercing Pattern signals a decisive psychological and technical failure of the bears. The second candle opens lower, reinforcing selling pressure, but the aggressive close above the 50% midpoint proves buyers have successfully rejected lower prices.
This decisive action suggests a critical market support level has been established and the downtrend is likely exhausted, providing a high-probability entry for long positions.
2. Why the Piercing Pattern Works: Market Psychology
The Piercing Line provides a clear visual of a sudden, decisive shift in market control. For experienced traders, it is the graphical representation of a failed bearish attack and a subsequent, aggressive bullish counter-punch. Understanding “why” it works requires looking at the interplay between seller exhaustion and buyer absorption.
- Sellers reach exhaustion: The first long bearish candle confirms that sellers are in total control. The subsequent gap-down at the start of the second candle represents the final push of bearish conviction. However, when the price fails to stay down despite this gap, it signals that selling pressure has reached a climax—sellers are exhausted, and there is no more supply to push prices lower.
- Aggressive buyer absorption: As sellers fail to capitalize on the gap-down, buyers see an attractive “discounted” price. They step in aggressively, absorbing all remaining sell orders. The move back above the 50% midpoint of the previous candle proves that buyers are not just testing the waters; they are actively dominating the order flow.
- The bear trap & short covering: The initial gap-down lures late-coming bears into opening new short positions. When the price rallies sharply, these traders are caught in a “bear trap.” As the price crosses the 50% midpoint, these bears are forced to “cover” (buy back) their positions to limit losses. This forced buying creates a feedback loop, generating the upward momentum that fuels the trend reversal.
- Rapid sentiment conversion: The Piercing Pattern marks the exact moment market sentiment flips from “Sell the Rallies” to “Buy the Dips.” The asset has transitioned from a state of oversupply to one of high demand at a verified support level.
Read more:
Cup And Handle Pattern: Definition, Strategies & Target
3. Piercing Candlestick Pattern vs. Other Candlestick Setups
Precision in candlestick pattern identification is the difference between a winning trade and a “bull trap”. The Piercing Line is frequently misidentified by novice traders, particularly when compared to other high-probability setups.
3.1. Piercing Pattern vs. Bullish Engulfing
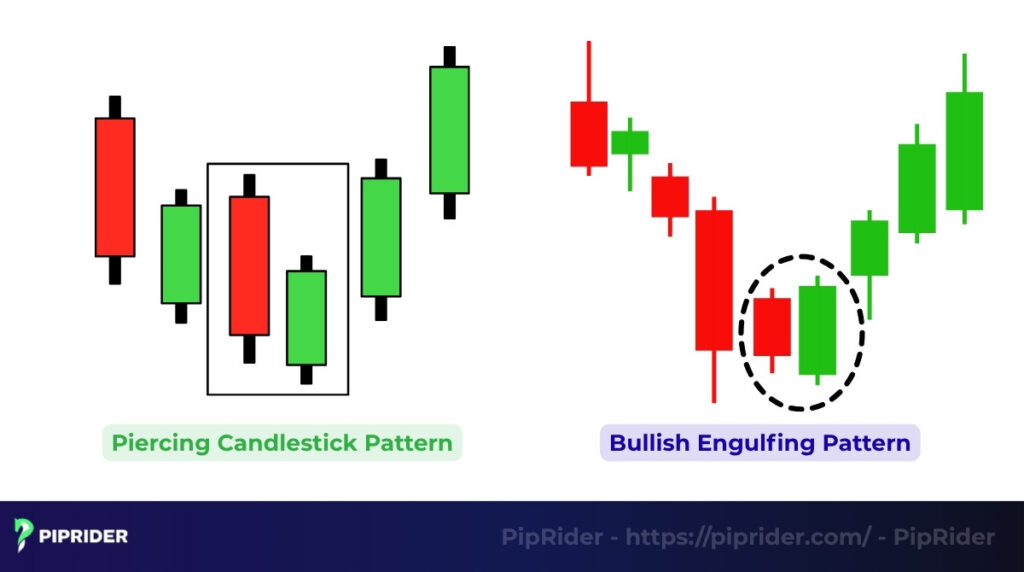
The Bullish Engulfing pattern is the primary source of confusion. While both are two-candle bullish reversals, the degree of buyer domination differs significantly.
- The 50% rule vs. Total coverage: In a Piercing Pattern, the second candle “pierces” the first but stays within its upper half (closing above 50% but below the open). In an Engulfing pattern, the second candle’s body completely swallows the first, indicating absolute buyer control.
- Psychological nuance: The Piercing Pattern is often a “rejection” of a support level, whereas the Bullish Engulfing is a “takeover” by buyers.
| Feature | Piercing Candlestick Pattern | Bullish Engulfing Pattern |
| Mandatory close | Must close above 50% midpoint of Candle 1 | Must close above the Open of Candle 1 |
| Body coverage | Partial (Pierces) | Full (Swallows) |
| Statistical power | High probability with volume confirmation | Considered the strongest two-candle reversal signal |
3.2. Piercing Pattern vs. Thrusting Pattern (The Trap)
Recognizing the Thrusting Pattern is vital for risk management. The Thrusting Pattern looks almost identical to the Piercing Line but is actually a bearish continuation signal.
- The failed pierce: If the second bullish candle fails to close above the 50% midpoint of the previous bearish candle, it is a Thrusting Pattern.
- The result: This failure indicates that while buyers tried to push back, they lacked the strength to overcome even half of the sellers’ momentum. Traders should avoid buying here, as the downtrend is likely to resume.
3.3. Piercing Pattern vs. Dark Cloud Cover
This comparison is mandatory, as the Dark Cloud Cover pattern is the exact opposite (bearish) twin of the Piercing Line. Misinterpreting the context leads to trading in the wrong direction.
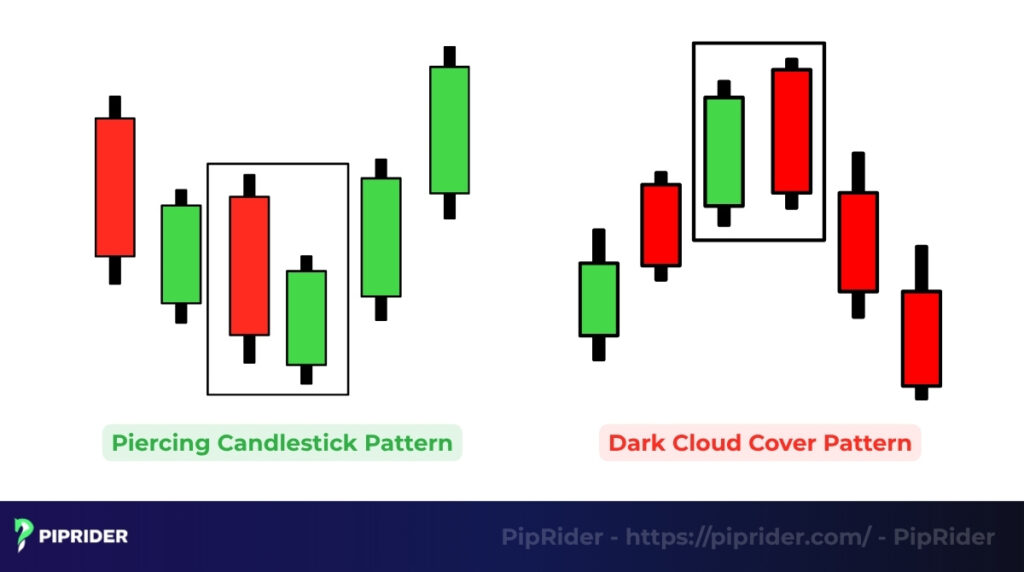
- Context check: A Piercing Pattern is only valid after a downtrend. If you see this structure after an uptrend, it is likely a Dark Cloud Cover forming (a bearish reversal).
- Confirmation: Always use support and resistance to verify context. A “piercing-like” look at a resistance level is a trap; a Piercing Pattern belongs exclusively at support.
4. How to Identify the Piercing Candlestick on a Chart
Identifying the Piercing Pattern accurately requires moving beyond a simple visual search for two candles. To distinguish a high-probability trend reversal from mere market noise, traders must evaluate the setup against a strict checklist of market context and structural quality.
4.1. Structural Identification Checklist
For a setup to be considered a valid Piercing Pattern, it must meet these four criteria:
- Extended downtrend: The market must be in a clear, sustained decline. The pattern is most potent when it occurs after a selling climax—a sharp, high-volume drop that suggests panic selling.
- Candle 1 (the setup): This must be a large bearish candle with a solid real body, confirming that sellers were in full control of the previous session.
- The opening gap: Candle 2 must open below the closing price of Candle 1. This gap reinforces the bearish narrative one last time before the reversal begins.
- The midpoint breach: Candle 2 must close at or above the 50% midpoint of Candle 1’s body. A deeper “pierce” (e.g., a 75% close) indicates even stronger buyer conviction.
4.2. Confirmation Filters & Priority
- Timeframe priority: Reliability is significantly higher on Daily (D1) or H4 charts. These timeframes reflect institutional commitment and filter out the “noise” found on smaller timeframes like M15.
- Support confluence: The pattern is infinitely more reliable if it forms exactly at a Major Support level, a long-term Moving Average, or a significant Fibonacci retracement level.
- Volume analysis: A high-probability setup requires a spike in volume on the second candle. This volume analysis confirms that big players are stepping in to absorb supply.
- Shadow quality: Ideal Piercing Patterns have minimal upper shadows on the second candle, indicating that buyers maintained their strength through the close.
4.3. Invalid Setups: When to Ignore
Reject the pattern entirely if it appears in a sideways market or during a shallow pullback in an uptrend. Be wary of setups where the second candle has a very small body or if the price fails to break the high of the pattern in the subsequent session. If the next candle immediately trades below the low of the Piercing Pattern, the signal is considered a “failed reversal”.
5. How to Trade the Piercing Candlestick Pattern: A Step-by-Step Strategy
Trading the Piercing Pattern effectively requires a disciplined process that moves from market context to specific execution triggers. This multi-step strategy is designed to filter out weak signals and prioritize high-probability reversal trades.
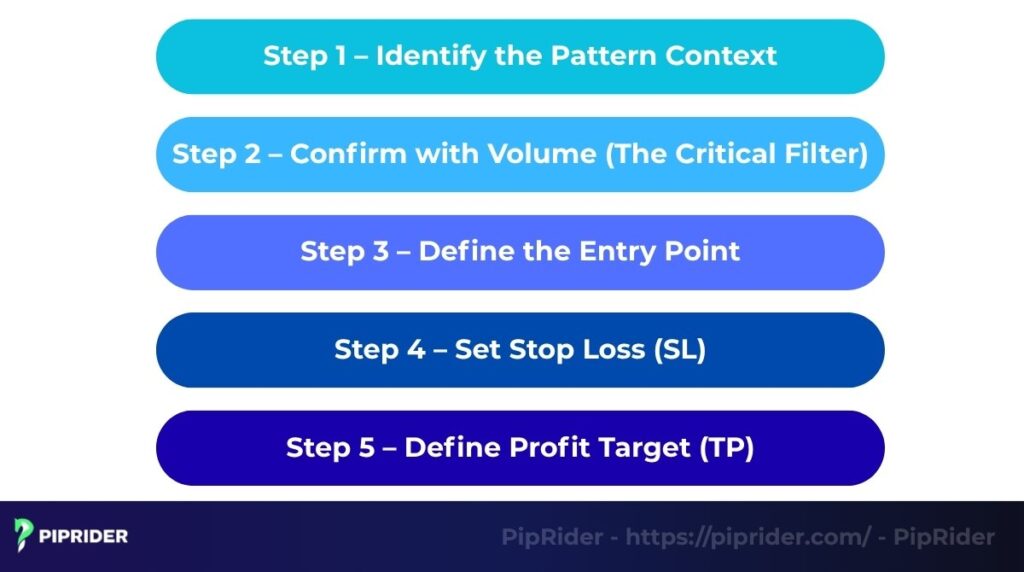
5.1. Step 1: Identify the Macro Downtrend and Support
Before looking at candles, you must establish the environment. The Piercing Pattern is only valid if it occurs after a sustained series of lower lows.
- Context: Look for the pattern forming at a major historical support level, a round number (psychological support), or a long-term Moving Average (e.g., 200 EMA).
- Verification: Ensure the market is not in a sideways “dead zone” where signals are unreliable.
5.2. Step 2: Confirm the Piercing Structure and Volume
Once the two candles form, verify they meet the strict mechanical rules:
- The 50% rule: Candle 2 must close strictly above the midpoint of Candle 1’s real body.
- Volume filter: Look for a definitive spike in volume on the second candle. High volume validates that institutional “smart money” is absorbing the sell orders and initiating the reversal.
5.3. Step 3: Wait for the Confirmation Candle
A common mistake is entering immediately after Candle 2 closes. To increase your win rate, wait for bullish follow-through:
- The trigger: Wait for a third candle to form. This candle must close bullishly and, ideally, break above the high of the Piercing Pattern. This “Confirmation Candle” proves that the momentum shift has staying power.
5.4. Step 4: Define Entry and Stop Loss (SL)
Precision in risk management is non-negotiable.
- Entry point: Place a Buy Limit or Buy Stop order slightly above the high of the second candle (or the high of the confirmation candle).
- Stop loss (SL): Place your Stop Loss 2–5 pips/ticks below the absolute low of the pattern (the lower of the two candles). This level acts as your “line in the sand”—if the price hits this, the bullish thesis is invalidated.
5.5. Step 5: Define Take Profit (TP) and Exit
Use market structure to determine your targets:
- Structural target: Set your first Take Profit at the nearest major resistance zone or the previous swing high.
- Fixed Risk-to-Reward: Ensure the trade offers at least a 1:2 Risk-to-Reward ratio. If your Stop Loss is 20 pips, your target should be at least 40 pips away.
6. Real Trading Examples: Forex, Stocks, and Crypto
To master the Piercing Candlestick Pattern, traders must recognize it across different asset classes. Unlike theoretical diagrams, real-world charts often feature “noise,” making volume and support confluence essential.
6.1. Forex Market: EUR/USD (H4 Chart)
In the high-liquidity Forex market, a true “gap down” is rare due to 24/5 trading. Here, the Piercing Pattern often appears as a candle opening slightly below or at the previous close before reversing.
- Market context: EUR/USD was in a steady 200-pip downtrend, approaching a major psychological support level at 1.0500.
- The setup: A large bearish candle hit the support. The following candle opened marginally lower and rallied to close at the 70% mark of the bearish body.
- Validation: A 20% increase in volume was noted on the reversal candle compared to the previous bearish session.
- The result: After a bullish confirmation candle, the price reversed, initiating a 150-pip rally.
6.2. Stock Market: Apple Inc. (AAPL – Daily Chart)
The stock market is where the Piercing Pattern is most “textbook” due to overnight gaps.
- Market context: AAPL suffered a 3-day sell-off following a bearish earnings outlook, pushing the price toward the 200-day Moving Average.
- The setup: Candle 1 was a “long-bodied” red candle. The next day, the stock gapped down significantly at the open.
- Validation: Buyers absorbed the supply immediately. AAPL closed the day well above the 50% midpoint of the previous day’s red body.
- The result: This “Piercing Line” at the 200-day MA acted as a floor, leading to a “V-shaped” recovery over the following week.
6.3. Crypto Market: Bitcoin (BTC/USDT – Daily Chart)
Crypto markets are highly volatile, often leading to extreme “selling climaxes” that form powerful Piercing Patterns.
- Market context: Bitcoin faced a sharp “liquidations” dump, falling from $65,000 to $58,000 in 48 hours.
- The setup: A massive bearish candle signaled panic selling. The next candle opened lower, tested the $57,500 support, and closed aggressively high into the bearish body.
- Validation: The volume on the reversal candle was the highest in two weeks, signaling institutional accumulation (absorption).
- The result: The Piercing Pattern marked the absolute bottom of the correction, followed by a sustained trend reversal.
7. Reliability and Optimal Market Conditions
The Piercing Pattern is a high-probability setup only when the market context is right. Experienced traders do not treat every “pierce” as a signal; instead, they evaluate the probability of success based on technical confluence and institutional behavior.
7.1. The “Selling Climax” Context
The reliability of a Piercing Pattern is directly tied to the intensity of the preceding downtrend.
- Optimal environment: The pattern is most effective following an extended bear run or a selling climax—a sharp, high-volume drop that suggests panic selling.
- Probability boost: When sellers are exhausted, a Piercing Line indicates that buyers have stepped in to “absorb” the remaining supply at a discounted price, marking a definitive shift in the supply-demand balance.
7.2. Strategic Confluence (The Support Floor)
A Piercing Pattern forming in the “middle of nowhere” is often market noise. Its reliability scores are highest when it aligns with established structural levels:
- Major support zones: Previous swing lows or historical “buy zones.”
- Dynamic support: Long-term Moving Averages (like the 50-day or 200-day EMA).
- Psychological levels: Round numbers (e.g., $50,000 for Bitcoin or 1.1000 for EUR/USD).
- Fibonacci retracements: Specifically the 61.8% or 78.6% levels.
7.3. Volume as a Reliability Multiplier
Volume is the “fuel” of the reversal. Without it, the Piercing Pattern is merely a technical correction.
- High probability: A definitive spike in volume (at least 20-30% above the 20-period average) on the second (bullish) candle validates that institutional “smart money” is behind the move.
- Low probability: If the second candle rallies on declining volume, it suggests a lack of buyer commitment, and the downtrend is likely to resume (often becoming a “Thrusting Pattern”).
7.4. The Reliability Scorecard
| Market condition | Impact on probability |
|---|---|
| Forms at Major Support | +25% reliability |
| Volume Spike on Candle 2 | +20% reliability |
| RSI/MACD Bullish Divergence | +15% reliability |
| Followed by Bullish Confirmation Candle | +30% reliability |
Condition to avoid: Sideways markets. The Piercing Pattern is a reversal signal, not a continuation signal. It loses all validity in range-bound or “choppy” markets where it frequently generates false signals and whipsaws.
8. Common Mistakes When Trading the Piercing Candlestick Pattern
Experienced traders avoid these critical errors that frequently lead to avoidable losses and “bull traps”:
- Confusing with Bullish Engulfing or Thrusting Patterns: This is the most common mistake. Novice traders often enter on a “Thrusting Pattern” (which fails to reach the 50% midpoint) thinking it is a Piercing Line. Conversely, they may mistake a Piercing Pattern for a Bullish Engulfing, failing to realize the Piercing Line represents a “rejection” rather than a total “takeover”.
- Trading in Sideways or Choppy Markets: The Piercing Pattern is a trend reversal tool. Using it in a range-bound market where there is no clear preceding downtrend results in “whipsaws.” Without the psychological fuel of seller exhaustion, the pattern lacks momentum.
- Skipping the Confirmation Candle: Many traders enter aggressively at the close of the second candle. Without waiting for a third candle to break the pattern’s high, you risk entering a “dead cat bounce” where the downtrend resumes almost immediately.
- Ignoring the Volume Filter: A Piercing Pattern on low or declining volume is a major red flag. It indicates that the price increase is due to a lack of sellers rather than a surge in institutional buyers. These setups have a high failure rate.
- Neglecting Higher Timeframe Bias: Trading a Piercing Pattern on an M15 chart while the Daily trend is strongly bearish is a high-risk move. Institutional levels on H4 or D1 charts always override small-timeframe signals.
9. Combining the Piercing Pattern with Technical Indicators
For experienced traders, the Piercing Pattern is rarely traded in isolation. High-probability execution requires confluence, the alignment of price action with technical indicators. Using indicators helps filter out false “pierces” and identifies the exact moment of market overextension.
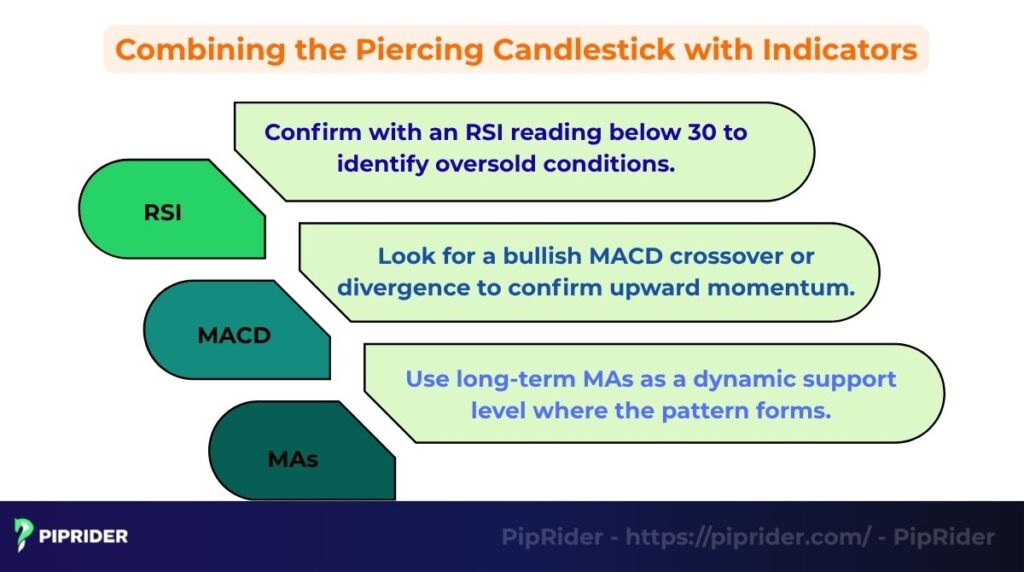
9.1. Relative Strength Index (RSI): Identifying Overextensions
The RSI is a powerful leading indicator that confirms if the preceding downtrend has reached an “extreme”.
- Oversold conditions: A Piercing Pattern is significantly more reliable when the RSI is below 30. This confirms that the bearish momentum is overextended and a mean reversion is likely.
- Bullish divergence: The strongest signal occurs when the price makes a “Lower Low” while the RSI makes a “Higher Low” (Bullish Divergence) exactly as the Piercing Pattern forms. This indicates that while the price is dropping, the internal selling pressure is actually weakening.
9.2. MACD: Confirming the Momentum Shift
While the RSI identifies the “bend” in the trend, the MACD (Moving Average Convergence Divergence) confirms the “break”.
- Bullish crossover: Look for the MACD line to cross above the Signal line immediately following the pattern’s completion. This validates the shift from bearish to bullish momentum.
- Histogram analysis: A transition of the MACD histogram from red (negative) to green (positive) serves as secondary confirmation that buyers have officially taken control of the short-term trend.
9.3. Moving Averages: Dynamic Support and Trend Verification
Moving Averages (MAs) act as dynamic levels of support and resistance.
- The 200 EMA test: A Piercing Pattern that bounces off the 200-period Exponential Moving Average (EMA) on a Daily chart is considered a “Golden Setup,” as it represents institutional buying at a major trendline.
- Breakout confirmation: For a conservative entry, wait for the price to break above the 20-period SMA following the pattern. This ensures the short-term “bearish gravity” has been overcome.
10. Pros and Cons of the Piercing Pattern
The primary advantages of the Piercing Pattern stem from its clear structure and universal applicability, making it a favored tool for confirming bullish momentum shifts.
10.1. Pros
The primary advantages of the Piercing Pattern stem from its clear structure and universal applicability, making it a favored tool for confirming bullish momentum shifts.
- Clarity and Simplicity: The Piercing Pattern is easy to identify with clear, quantitative rules (the 50% pierce). It provides an unambiguous bullish reversal signal that is immediately actionable upon confirmation.
- Versatility across markets: The pattern’s underlying psychology (rejection of low prices) applies across various asset classes, making it highly effective in Forex, Stocks, and Crypto markets.
10.2. Cons
The drawbacks mainly relate to signal quality and context, requiring disciplined confirmation to avoid high-risk false setups.
- Susceptibility to false signals: Piercing Pattern is highly prone to generating false signals if the mandatory volume confirmation is ignored. A weak pierce without a volume spike often leads to an immediate continuation of the bearish trend.
- Reduced reliability in weak trends: The pattern’s conviction significantly decreases when it appears after a shallow pullback or in a weak, range-bound downtrend. It needs strong preceding bearish momentum to validate the reversal’s significance.
11. Frequently asked questions about Piercing Candlestick Pattern
12. Conclusion
The Piercing Candlestick Pattern is a powerful, high-conviction bullish reversal signal when found in the correct context. Its fundamental role is to confirm a decisive psychological failure of sellers and the establishment of a strong market support level. Trading decisions must always follow confirmation.
To transition this signal into a successful trade, the critical takeaway remains: Always utilize multi-factor confirmation. Never trade the pattern in isolation. A high-probability setup requires the strict confluence of: Price Action, Volume, Technical Indicators (like MACD).
Mastering the Piercing Line elevates your market timing and risk control. For continued learning and in-depth reviews of actionable setups, follow our dedicated sections on Forex Chart Patterns and Broker Reviews at Piprider. Don’t forget to define your take profit level before entry.
Infographic Section
-
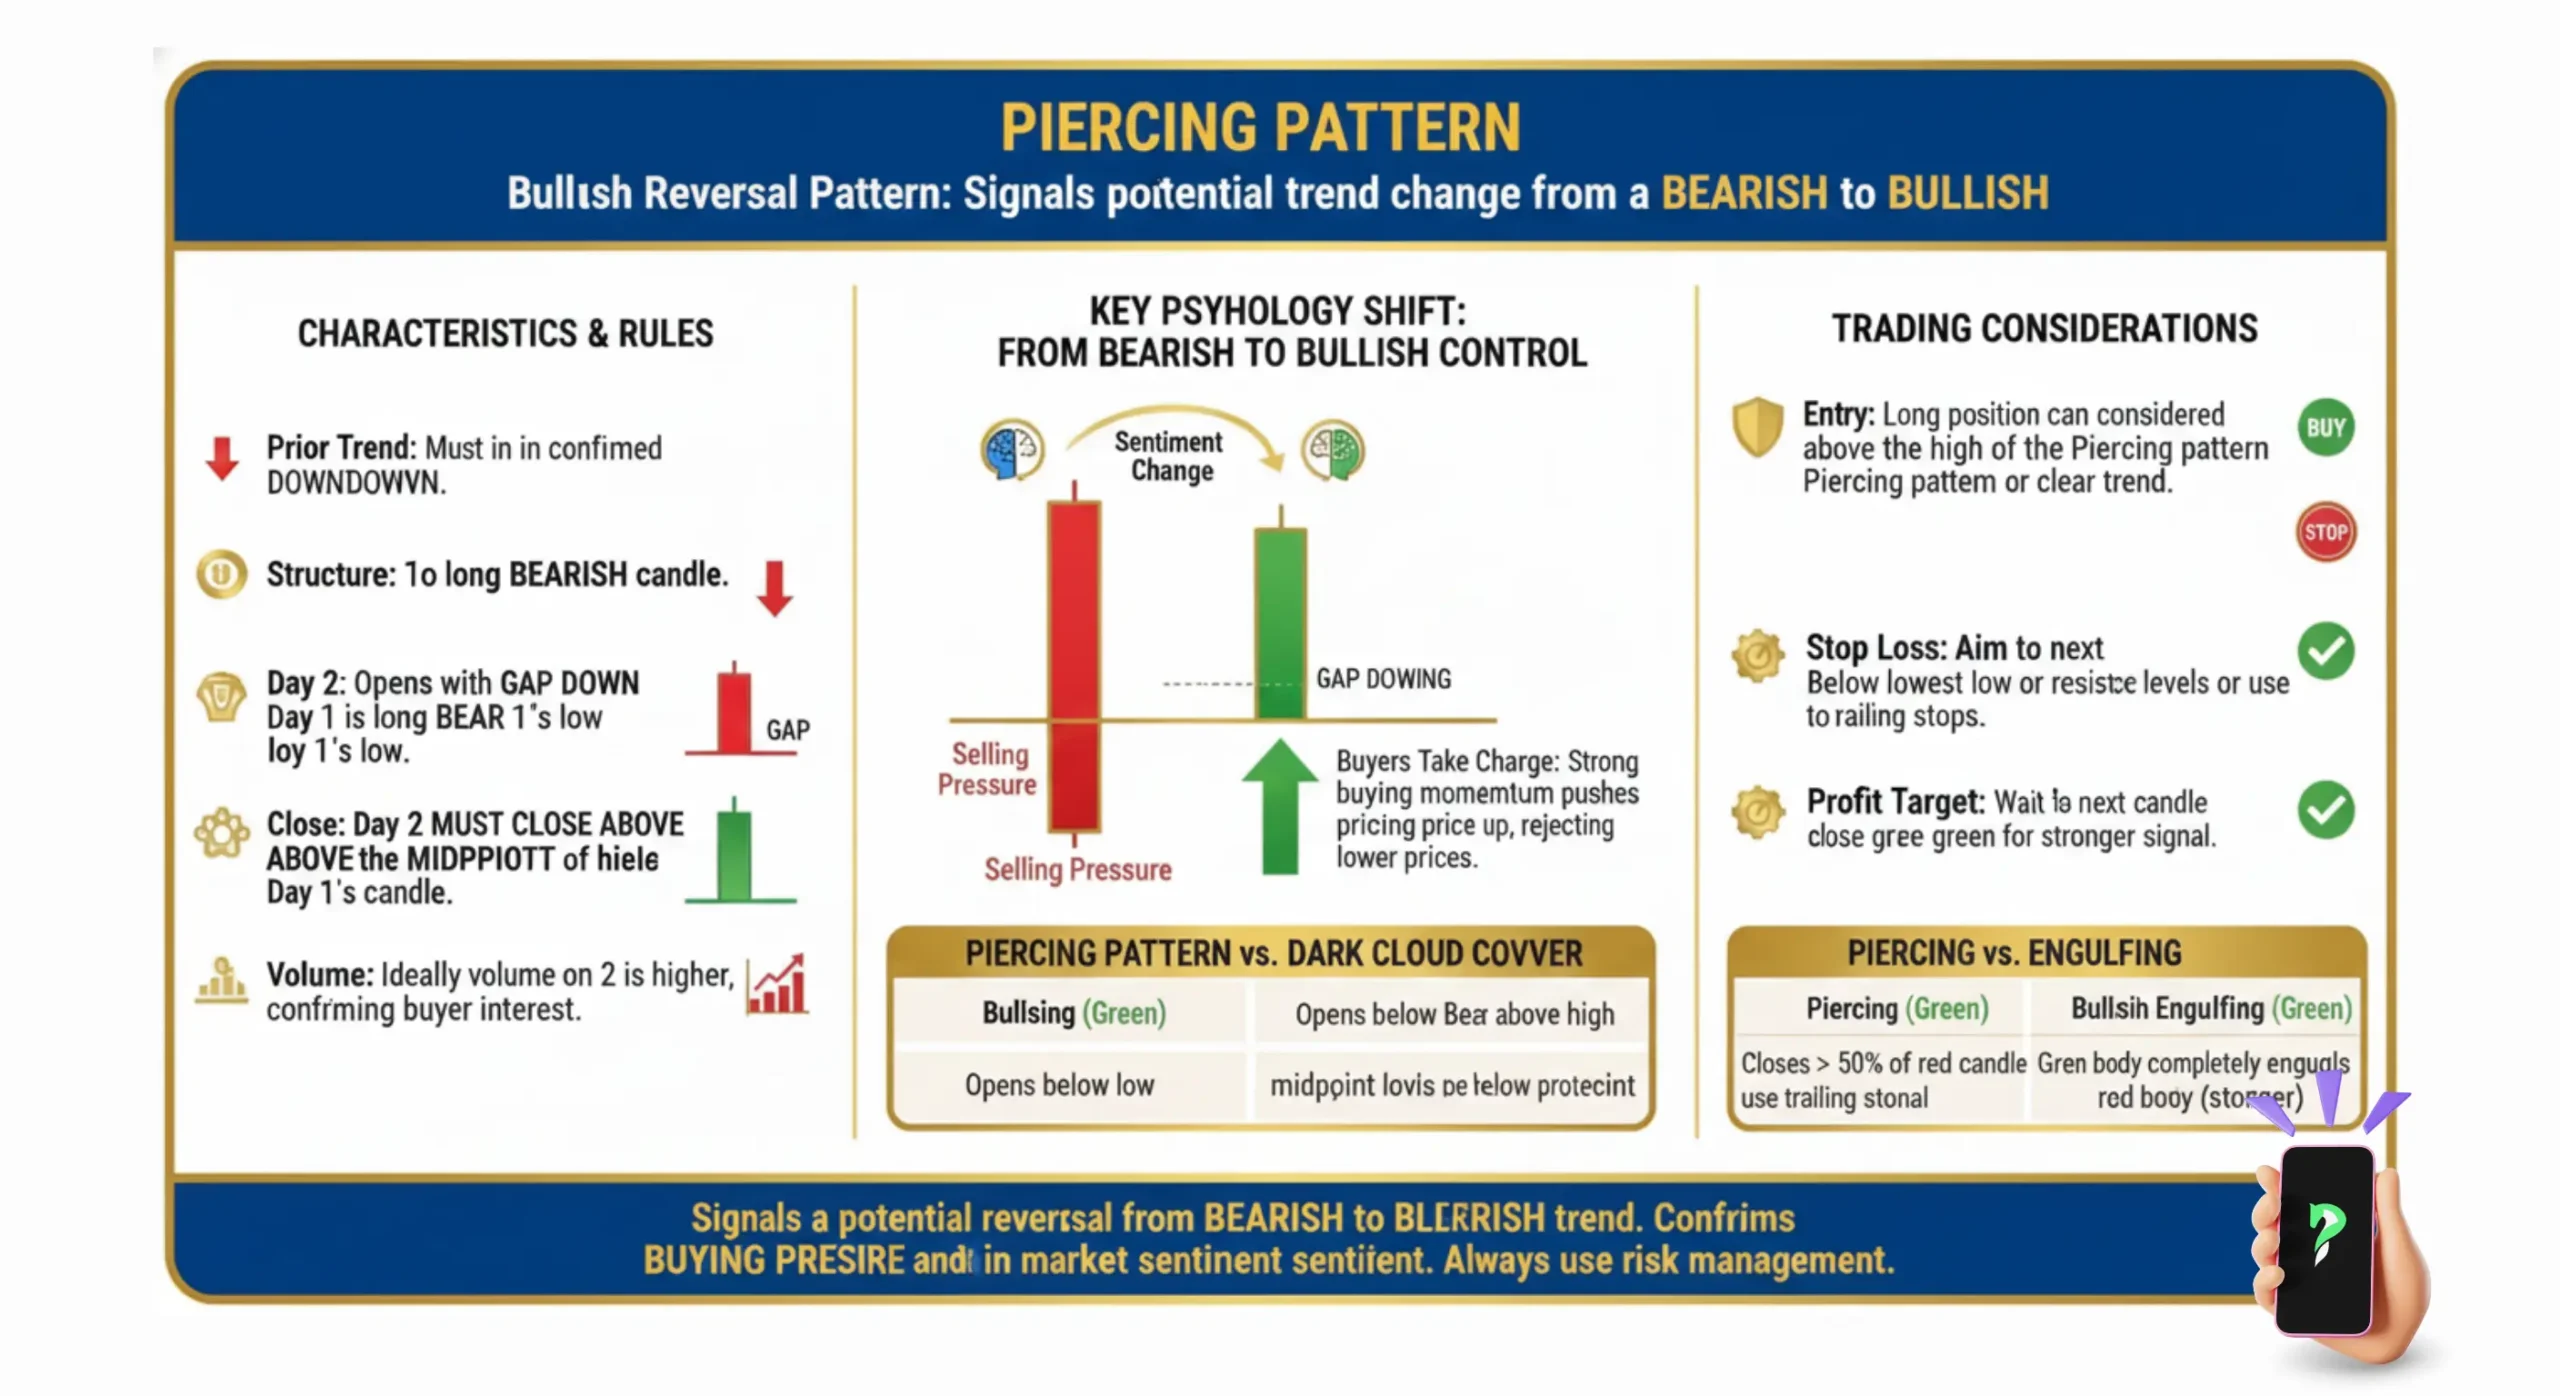
Signals potential trned change from a bearish to bullish -
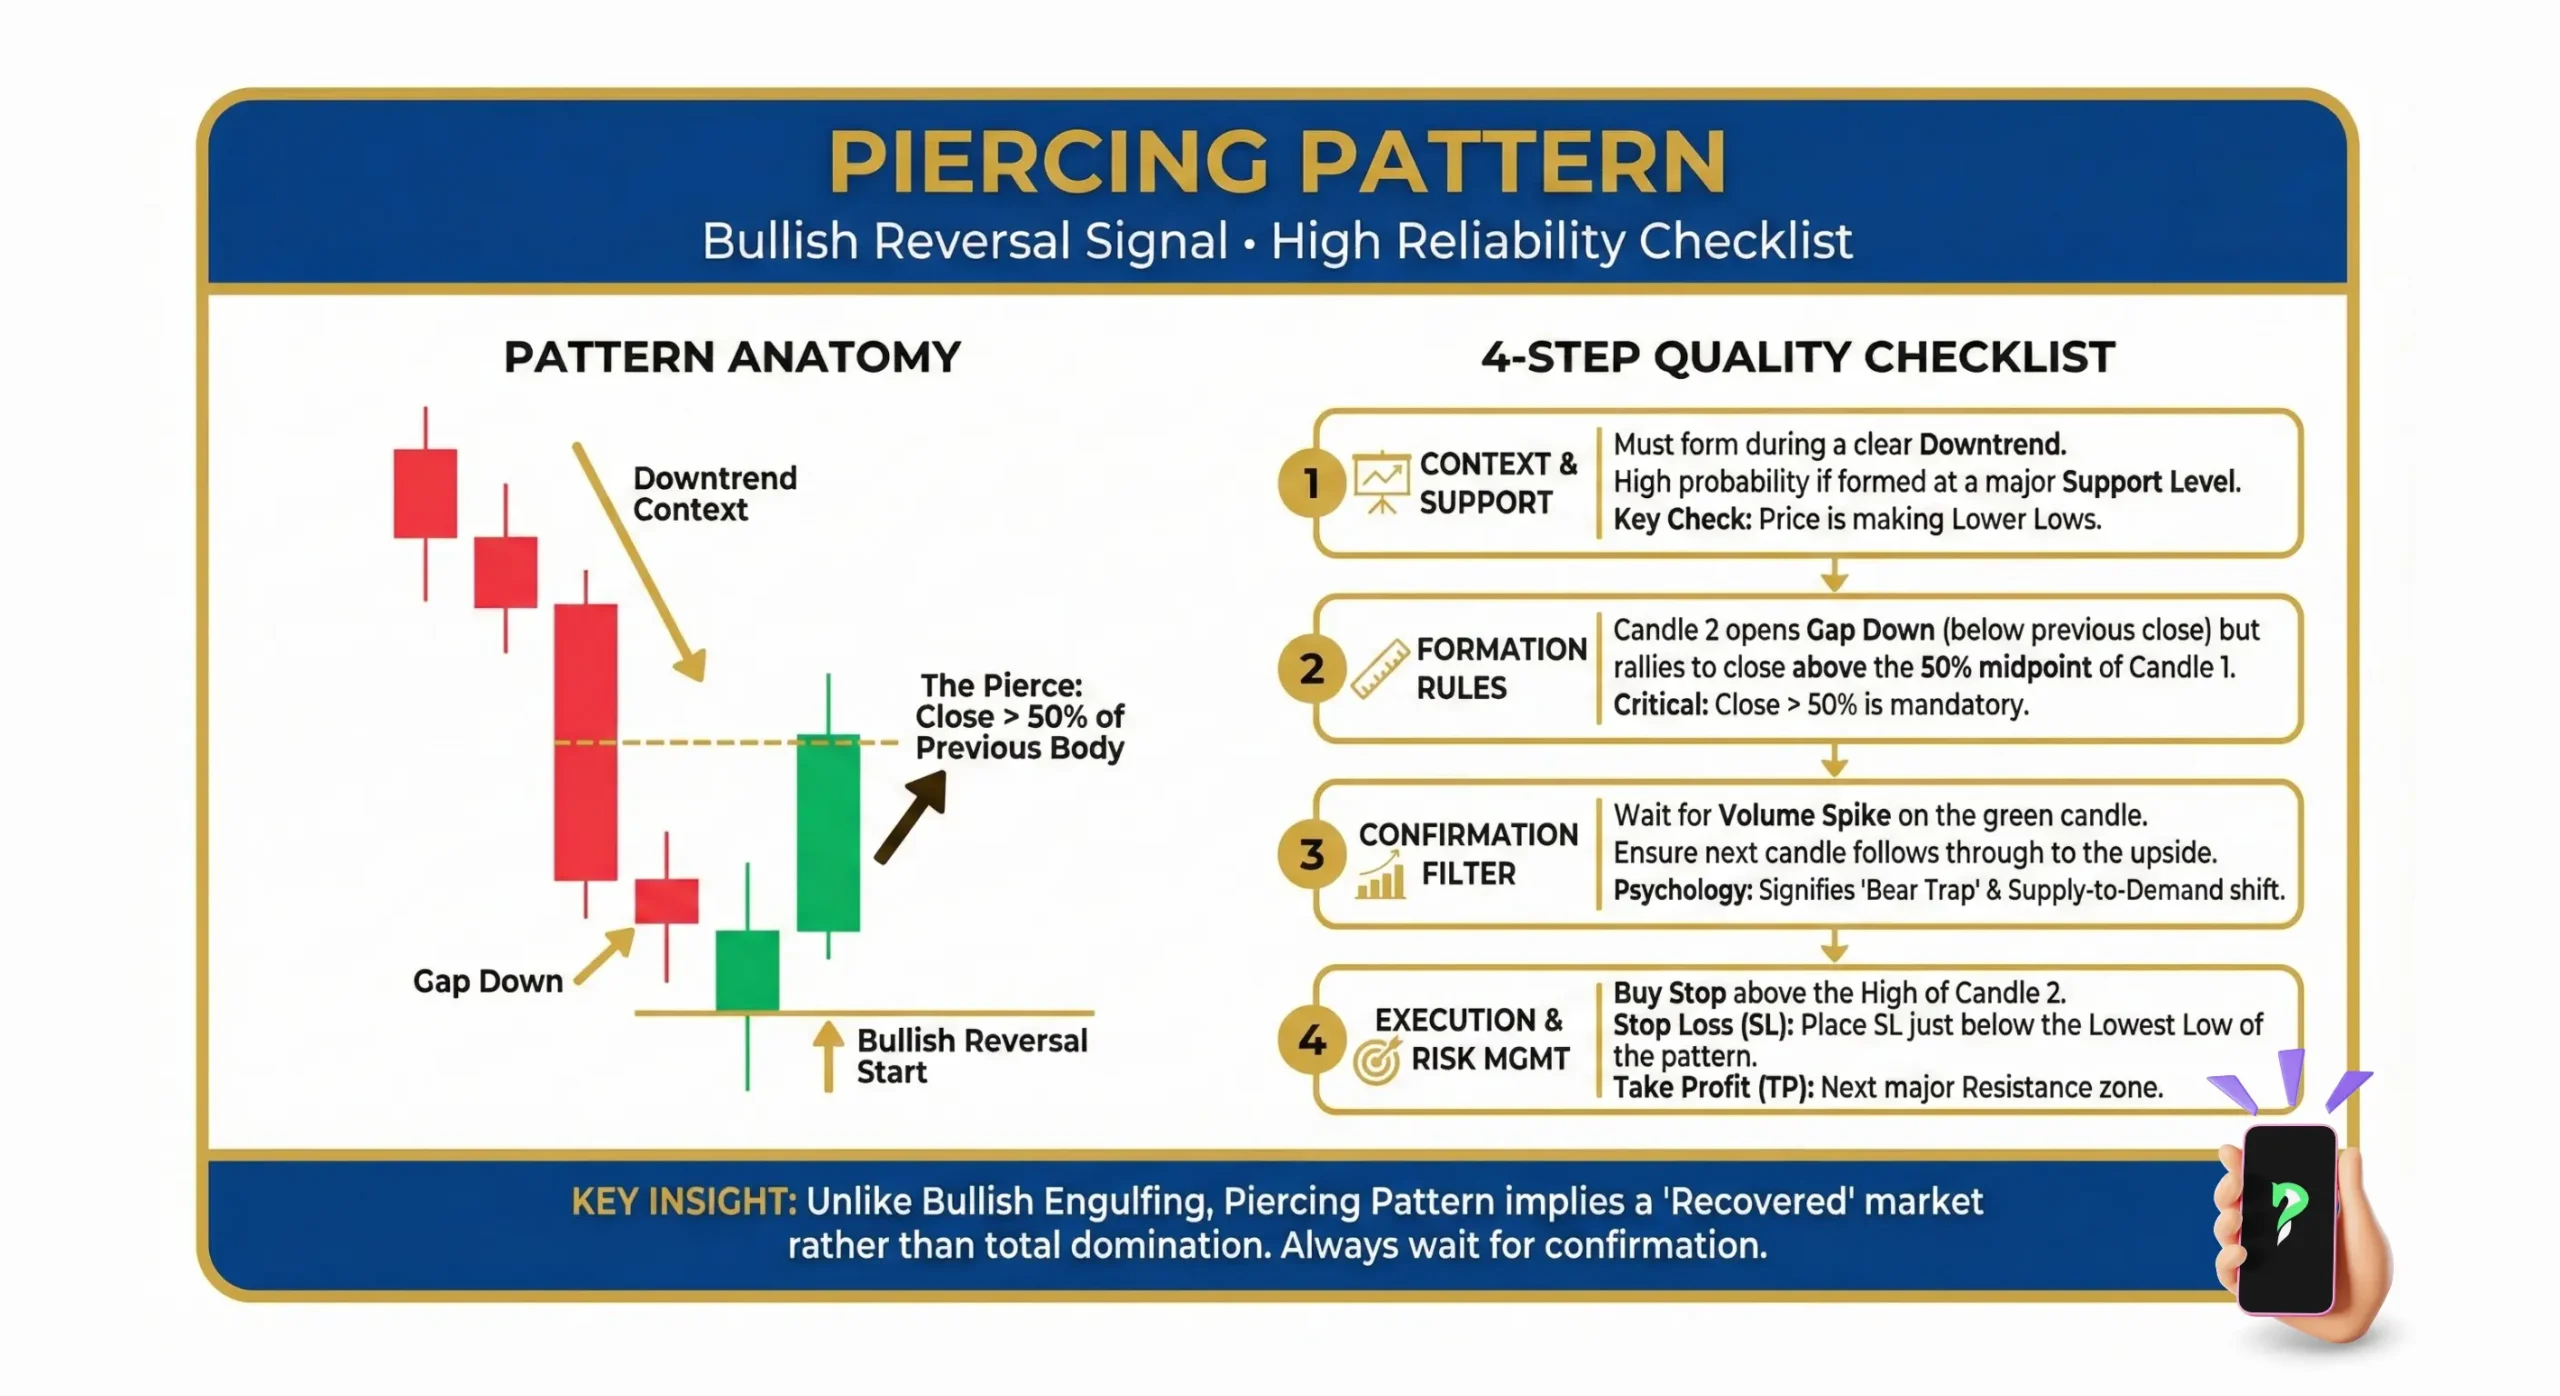
4-step quality checklist -
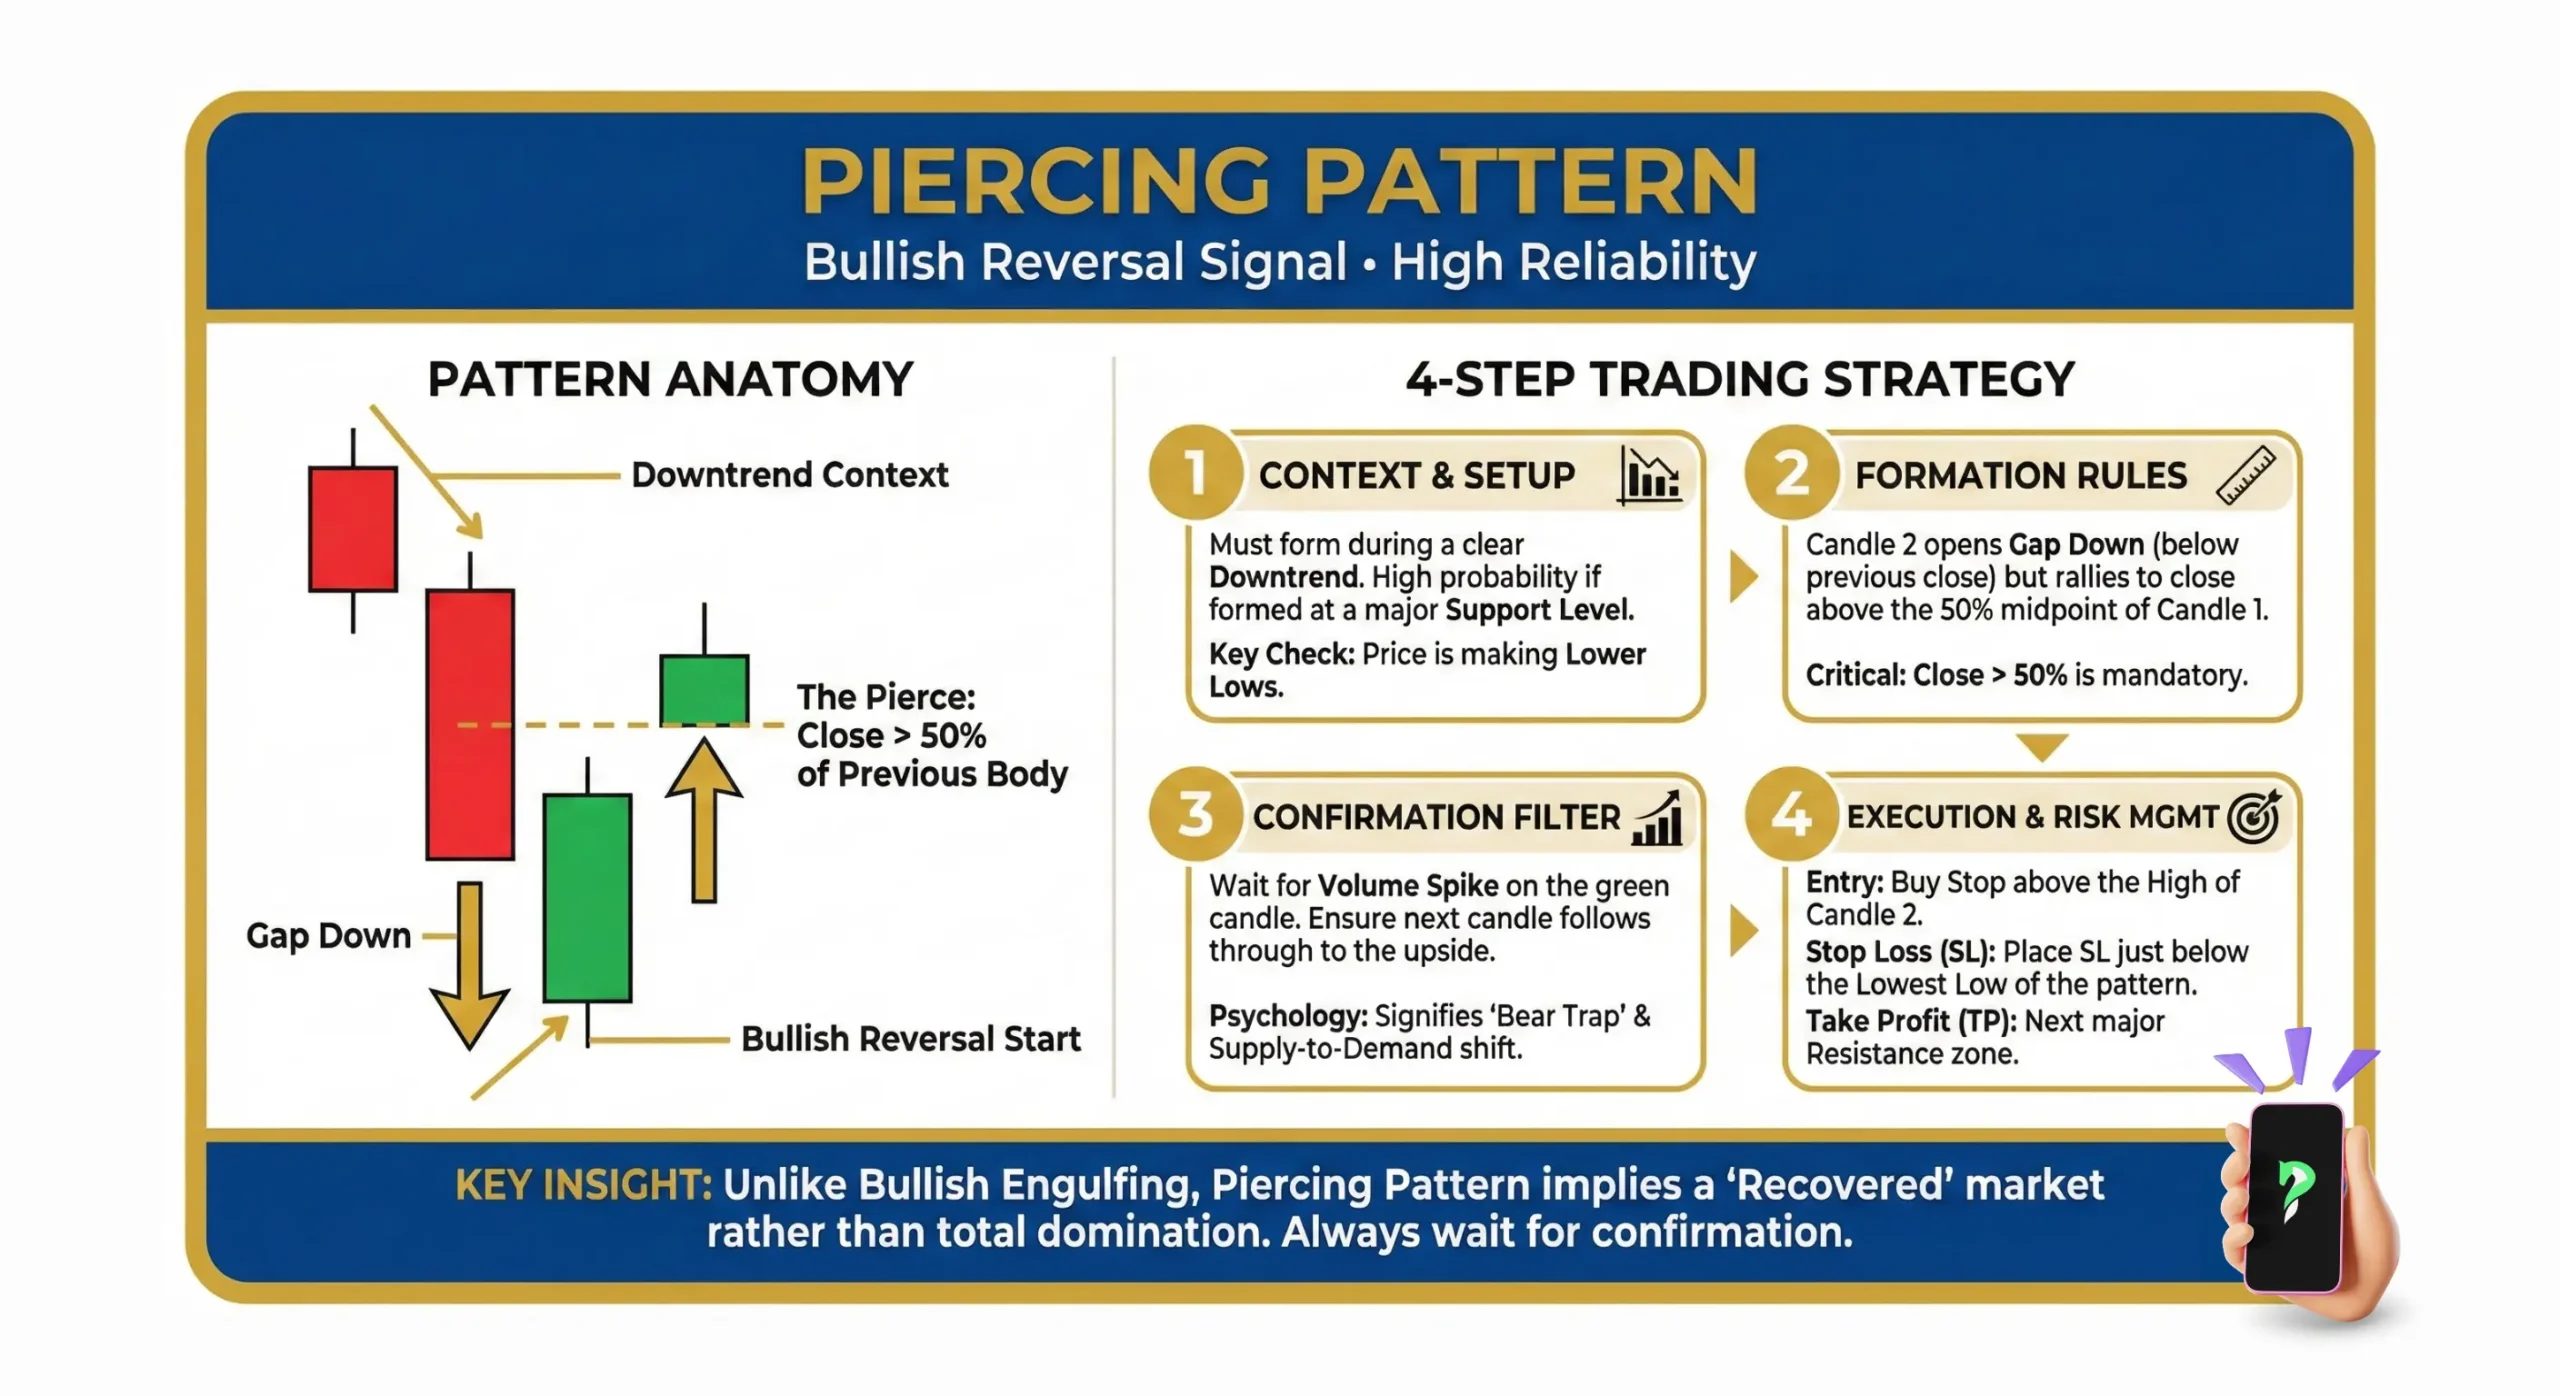
4-step trraing strategy


