Author for Forex Learn Levels 1–3, creating accessible, research-driven modules that simplify forex and personal finance for beginner to intermediate learners.
The Williams %R (Williams Percent Range) is a momentum oscillator developed to measure where the current closing price sits relative to the highest high and lowest low of a specific look-back period (N periods). Rather than predicting the future, it helps traders objectively identify overbought or oversold conditions and spot potential shifts in market momentum....
The quest for a reliable momentum indicator is often hampered by the noise inherent in classics like the standard Stochastic Oscillator, signals that flicker and mislead in choppy markets. Enter the Stochastic Momentum Index (SMI), the ingenious solution developed by William Blau. Designed to filter out market static, the SMI provides an uncluttered and precise...
The Money Flow Index (MFI) is a momentum indicator that measures the flow of capital into and out of an asset. Often described as the “volume-weighted RSI,” the MFI distinguishes itself by integrating both price action and trading volume into a single oscillator. While standard indicators like the Relative Strength Index (RSI) only track the...
Single candlestick patterns are the foundational language of technical analysis. They capture the emotional battle between buyers and sellers within a single trading period, offering clear and immediate insights into market sentiment. Mastering these simple, one-candle formations, such as the Hammer and Doji, is the first step toward reading price action effectively on any candlestick...
The thrusting candlestick pattern is a two-candle bearish continuation setup that forms during active downtrends. It occurs when a bullish counter-attack fails a critical structural test: the second candle penetrates the first but cannot close past its 50% midpoint. This rejection confirms that sellers have absorbed the buying pressure, making it a valuable tool for...
Continuation candlestick patterns are trend-pause setups that can offer clean entries when the trend context and confirmation are present. Treat them as probabilistic signals, your edge comes from structure, confirmation, and risk control, not the pattern name. This guide delivers the structural and psychological insights required to identify both bullish and bearish continuation setups and...
The ABCD harmonic pattern is the fundamental building block of many harmonic formations. It is a widely used technical tool based on Fibonacci ratios and market symmetry. When properly identified, this price pattern provides a structured framework for defining potential entry and exit zones. Mastering this structure is valuable for trading ABCD pattern strategies across...
CFD trading (Contract for Difference) is a flexible yet high-risk financial instrument that lets traders profit from asset price movements without taking physical ownership. This comprehensive guide delivers a clear overview of CFDs, covering the definition, mechanics, key benefits, and associated risks. You will find practical instructions on how to start trading, how to choose...
This article provides a detailed overview of the VWAP indicator (Volume-Weighted Average Price). It explains the formula, practical applications, and popular trading strategies using this tool. The guide directs traders on how to differentiate VWAP from other average indicators, identify its critical limitations, and understand crucial caveats for maximizing trading efficiency. 1. What is the...
Comparing CFDs vs Spread Betting is one of the most common questions from traders in the UK and Europe. Both are powerful leveraged products that allow you to trade on price movements without owning the underlying asset, but there are critical differences in tax, structure, and strategy. In this guide, Piprider will break down these...
Many traders struggle to identify periods of consolidation right before a major market move. The TTM Squeeze indicator, developed by John Carter, was specifically designed to address this challenge. It accurately signals these quiet periods of low volatility, which often precede an explosive breakout. This comprehensive guide provides a detailed methodology for using the TTM...
The True Strength Index (TSI) is a momentum oscillator that uses a unique double-smoothing technique to filter out market noise. Unlike standard indicators, TSI provides a crystal-clear view of the trend by focusing on three critical signals: Zero-Line Bias (Trend Direction), Signal Crossovers (Entry Timing), and Divergence (Reversal Warnings). In this guide, Piprider breaks down...
When major indices hit new highs, a common question arises: Is this strength genuine, or is the rally masking underlying weakness? To answer this, traders need a tool that looks beyond simple price movement to gauge the market’s internal health. This is the exact purpose of the TRIN Arms Index, also known as the Short-Term...
Professional trading often shifts the focus from simple win rates to the mathematical balance between risk and return. This balance is defined by the risk-reward ratio, a critical metric used to evaluate whether a trade’s potential payout justifies the capital at risk. By utilizing the ratio risk reward concept, traders can establish a framework where...
In trading, a single reason is rarely enough to risk capital. Professional traders look for multiple, independent factors that all point to the same conclusion. The powerful technique is known as confluence in trading. This guide will teach you how to build a powerful confluence strategy, moving from simple single-signal trading to a more robust,...
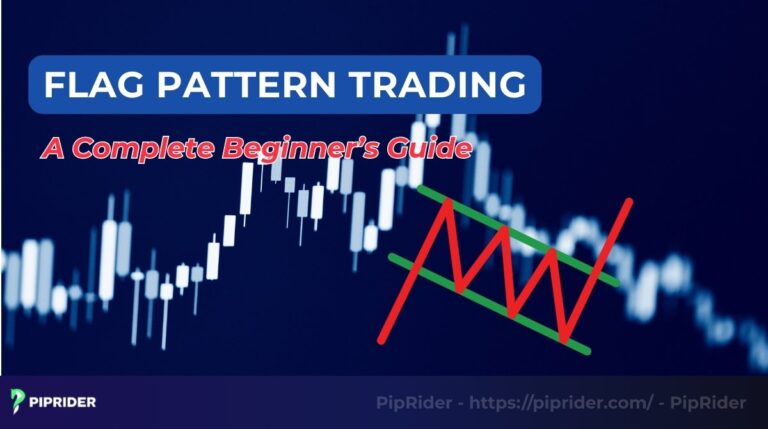
Ever see a strong market trend and feel like you’ve missed the boat, only to watch it pause for a moment before continuing its powerful move? That pause is often a flag pattern. In technical analysis, the flag is a classic continuation pattern that provides a high-probability opportunity to join a trend that’s already in...
The Hikkake Pattern is a false-breakout candlestick setup built around an inside bar. It traps traders on the wrong side of the move and can signal either a short-term reversal or continuation, depending on market context. Derived from the Japanese word for “to trick” or “to trap,” this price pattern is highly valued by technical...
The Long-Legged Doji (LLD) is a significant single-candlestick formation that identifies high volatility and a temporary balance between buyers and sellers. It is not a guaranteed directional signal, but rather a warning that the current trend’s momentum may be reaching a state of exhaustion. For experienced traders, recognizing this state of market neutrality helps improve...