
This article provides a detailed overview of the VWAP indicator (Volume-Weighted Average Price). It explains the formula, practical applications, and popular trading strategies using this tool. The guide directs traders on how to differentiate VWAP from other average indicators, identify its critical limitations, and understand crucial caveats for maximizing trading efficiency.
Key Takeaways
- A VWAP is an intraday benchmark reflecting the average asset price, specifically weighted by trading volume
- The calculation is cumulative throughout the day and automatically initiates a new calculation at the start of each trading session
- The indicator primarily serves as a dynamic support/resistance level and a trend confirmation tool for short-term trading
- It is superior for Day Trading and institutional execution because it incorporates liquidity data, unlike SMA or EMA
-
Anchored VWAP (AVWAP) extends the tool’s utility to swing trading and multi-day analysis
1. What is the VWAP Indicator? How to calculate it?
The Volume-Weighted Average Price (VWAP) is a technical analysis tool that calculates the average price of a security for the current trading day, critically factoring in the traded volume.
VWAP reflects the true average price at which an asset has been transacted, defining the genuinely “fair” market price (or value of a security) from a volume perspective. It is an effective tool used by professional traders to assess trend, liquidity, and optimal execution points.
Formula and Mechanics
The VWAP formula aggregates the total dollar value traded and divides it by the total volume traded throughout the trading day. The calculation is cumulative from the opening bell and is strictly intraday-only, resetting completely at the opening of every new trading session.
VWAP = ∑(Typical Price × Volume) / ∑(Volume)
Where:
- Typical Price is calculated as (High + Low + Close) / 3 for each interval.
- The sum ( ∑ ) represents the cumulative total from the start of the trading day.
| Calculation Component | Significance |
| ∑(Price×Volume) | Total dollar value traded up to that point |
| ∑(Volume) | Cumulative volume traded in the session |
| VWAP Result | The average price, weighted by volume |
VWAP in Forex: The tick volume Ccaveat
Unlike stocks or futures, the spot Forex market is decentralized (OTC), meaning there is no single “total volume” data. Most Forex platforms use tick volume (the number of price changes) as a proxy for actual traded volume. While VWAP remains a powerful tool in Forex, traders should be aware that the line reflects volume from a specific data feed (like OANDA or TradingView) rather than the entire global market.
2. VWAP vs. Other Average Indicators: The Volume Advantage
VWAP differs fundamentally from the Simple Moving Average (SMA) or Exponential Moving Average (EMA) because it uniquely integrates volume into its calculation, offering a more robust benchmark.
Unlike simple averages that treat every price point equally, VWAP gives higher weight to prices where more assets or instruments were exchanged. This means that price action accompanied by large institutional buying or selling pressure significantly impacts the VWAP line, providing a truer reflection of market conviction.
This feature makes VWAP the preferred indicator for assessing liquidity-driven momentum in short-term trading.
| Criterion | VWAP | SMA/EMA |
| Weighting Factor | Volume-Weighted (incorporates liquidity) | Price-Weighted only |
| Scope | Intraday (standard); Event-based (anchored) | Flexible timeframes; Multi-day capable |
| Primary Use | Day Trading, Execution quality | Swing Trading, Long-term trend analysis |
| Market View | Reflects where the majority of capital was spent | Reflects price over time, ignores trade size |
The Distinct Advantage: VWAP provides a more “real-world” view of the price paid by the majority of participants.
3. Anchored VWAP (AVWAP): Extending Beyond Intraday
While standard VWAP resets daily, Anchored VWAP (AVWAP) allows traders to choose the starting point (the “anchor”). This makes it a powerful tool for swing trading.
When to Anchor VWAP?
- Major news/Earnings: Start the calculation from the moment a high-impact news event occurs to see the new “fair value”
- Significant highs/lows: Anchor to a major market peak or trough to track the average price since that trend began
- Breakouts: Anchor to the candle that broke a significant consolidation zone
4. Practical Application of VWAP in Trading
Short-term traders use VWAP to gain crucial short-term insights, confirm trend bias, and optimize execution quality.
4.1. Trend Confirmation and Bias Assessment
VWAP provides an immediate assessment of the market’s current disposition relative to the volume-weighted average:
- Bullish Bias: When the price consistently holds and closes above the VWAP line, it indicates that buyers are aggressively entering the market, confirming a strong intraday uptrend. This confirms the current price trend.
- Bearish Bias: When the price holds and closes below the VWAP line, sellers are dominant, confirming a strong intraday downtrend.
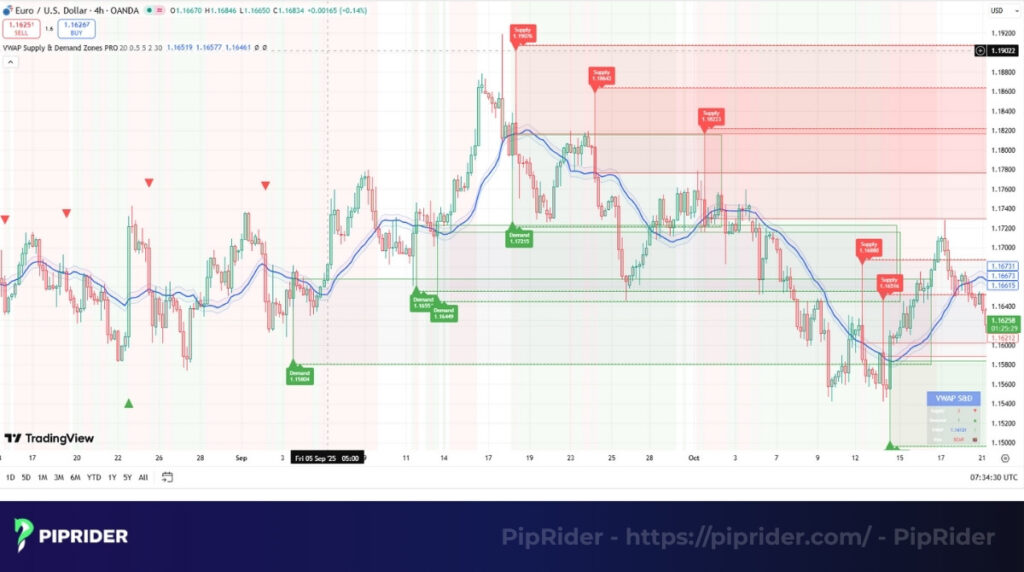
4.2. Dynamic Support and Resistance
The VWAP line often functions as a dynamic price floor or ceiling, offering high-probability entry or exit zones:
- Support: During an established uptrend, traders look for the price to pull back and touch the VWAP line. A subsequent bounce confirms its use as a support level for a Long entry.
- Resistance: During a downtrend, traders look for the price to rally up to the VWAP line. A rejection confirms its use as resistance for a Short positions entry.
4.3. Institutional Execution
Large institutions use VWAP as a key performance metric to execute massive block orders efficiently. Their algorithms aim for a final average execution price that is better than the day’s VWAP to demonstrate superior execution quality and minimal market impact.
5. Popular Trading Strategies Based on the VWAP Indicator
VWAP forms the foundation of several low-risk, high-probability intraday strategies centered around disciplined entry points and exit points.
5.1. Strategy 1: The VWAP Pullback Trade (Mean Reversion Entry)
This strategy aims to enter a strong trend when the price briefly corrects to the average price level
- Market condition: Price is trading consistently above (bullish) or below (bearish) the VWAP for the majority of the session (trend day)
- Trigger: Wait for a pullback to the VWAP line followed by a confirmation candle (e.g., pin bar or bullish engulfing)
- Invalidation/SL: Place SL below the recent swing low or below the VWAP line with a buffer based on ATR
- Exit/TP: TP1 at the recent high/low; TP2 using a trailing stop based on market structure
5.2. Strategy 2: The VWAP Breakout Trade (Momentum Entry)
Capitalizes on the market transitioning from consolidation near VWAP into a strong momentum leg
- Market condition: Price is consolidating tightly around the VWAP (low volatility/compression)
- Trigger: A high-volume candle decisively closes above (long) or below (short) the VWAP
- Invalidation/SL: Place SL on the opposite side of the breakout candle or below the consolidation range
- Exit/TP: Target the next standard deviation band (+1/+2) or a fixed 1:2 risk/reward ratio
5.3. Strategy 3: Using VWAP Bands
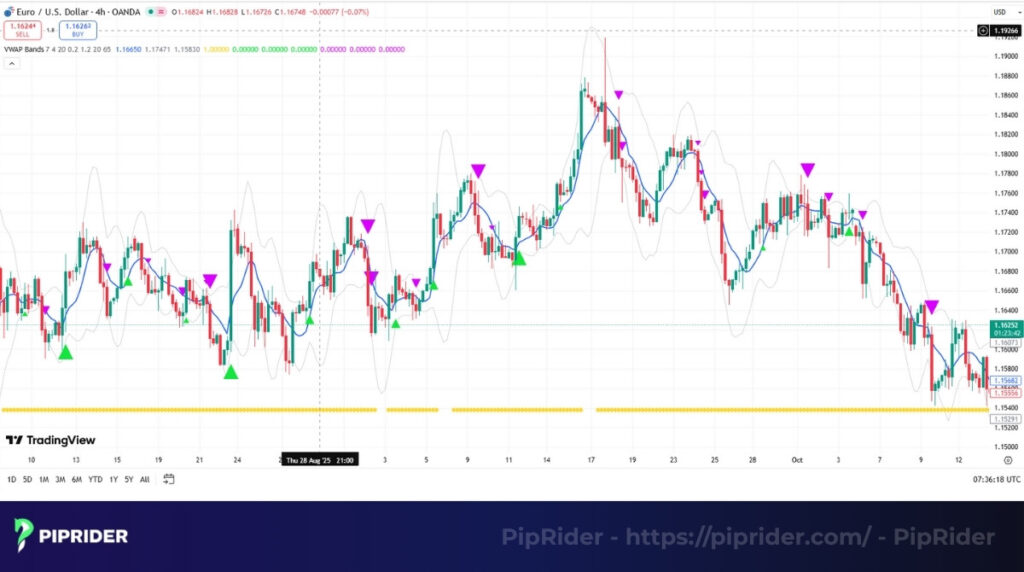
Utilizes standard deviation bands to identify overextended price action in non-trending markets
- Market condition: Sideways or range-bound market (range day) where bands are relatively flat
- Trigger: Price touches the +2 or -2 standard deviation band, accompanied by an RSI divergence or reversal price action
- Invalidation/SL: Place SL just beyond the band or the daily high/low
- Exit/TP: The central VWAP line is the primary target for mean reversion
6. How to Add VWAP on TradingView
TradingView offers robust support for volume-weighted tools, providing both the traditional session-based VWAP for standard day trading and the highly customizable Anchored VWAP for event-driven analysis. Depending on your strategic needs, here is how to apply both to your workspace:
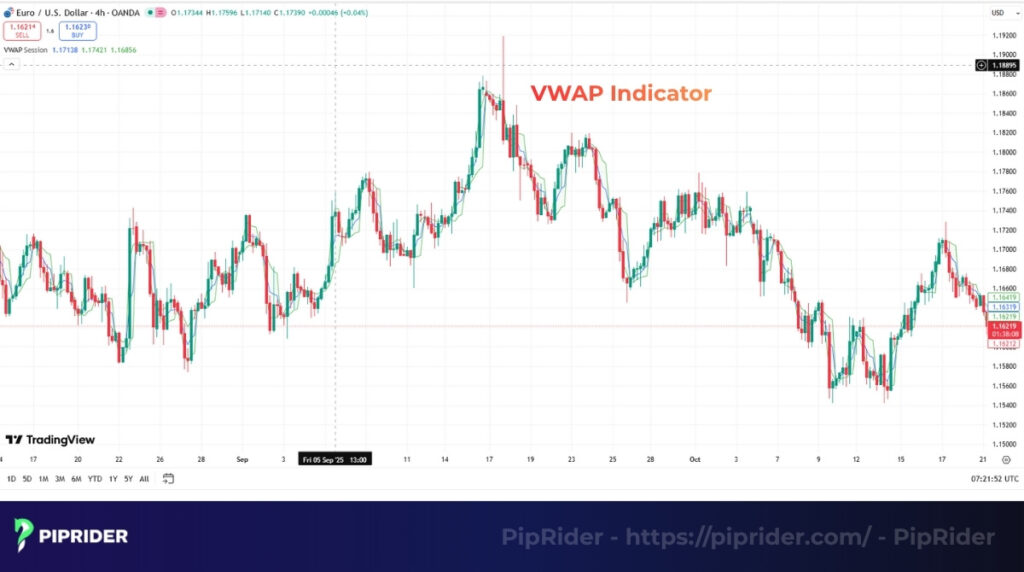
6.1. The Standard VWAP (Session-Based)
This is the default tool used by intraday traders. It automatically anchors to the start of the daily trading session and resets at the market open.
- Open the Indicators menu at the top of your chart.
- Search for “VWAP” and select the built-in Volume Weighted Average Price option.
- Note: Because it automatically handles intraday resets, no manual anchoring is required.
6.2. The Anchored VWAP (Event-Driven)
This variation allows you to manually dictate the exact starting point of the volume calculation, making it perfect for tracking momentum after a major news event, earnings report, or structural breakout.
- Navigate to the left-side drawing toolbar and expand the Trend Line tools group.
- Select the Anchored VWAP tool.
- Click directly on the specific candlestick where you want the calculation to begin. The VWAP line will instantly project forward from that exact moment in time.
7. Limitations and Critical Trading Caveats
While powerful, Volume-Weighted Average Price has specific limitations, and improper use is a common source of trading errors.
7.1. Core Limitations
The inherent design of VWAP imposes strict boundaries on its application, which must be respected by traders, especially when viewing intraday charts:
- Intraday only: VWAP is strictly an intraday indicator and resets daily. It cannot be used for multi-day analysis, swing trading, or long-term investing. It is only useful on intraday charts.
- Lagging indicator: VWAP is a lagging indicator. It reflects the average of past price and volume data and is used to confirm the existing trend or bias, not to predict future price movement.
7.2. Critical Trading Caveats
Ignoring the operational context of Volume-Weighted Average Price leads to common, avoidable mistakes that undermine trading performance:
- Not used in isolation: VWAP is a confirmation tool. Always combine it with other indicators (e.g., RSI) and strict volume analysis for validation.
- Wait for confirmation: Avoid entering a trade the moment the price touches VWAP. Wait for a clear signal (e.g., a bullish candle formation) to confirm the dynamic support/resistance is holding.
- Mandatory risk management: A properly placed Stop Loss is mandatory to limit risk when a supposed support/resistance fails.
8. How VWAP Optimizes Trading Efficiency
VWAP provides a superior market perspective by factoring in both price and liquidity, leading to higher trading efficiency.
- Optimal execution: It helps traders pinpoint the ideal price for entry/exit, ensuring buying is not excessively high and selling is not excessively low relative to the day’s average transaction price.
- Emotional control: Trading based on a volume-validated benchmark like VWAP helps remove emotion, promoting systematic and objective trade planning.
- Professional alignment: Using VWAP aligns individual trading decisions with the standards employed by large institutions, improving the overall quality of technical analysis and trade timing.
9. Frequently asked questions about VWAP Indicator
10. Conclusion: Why VWAP is Essential for Day Trading
The VWAP indicator is indispensable for anyone engaged in short-term trading because it provides the most accurate, volume-validated measure of an asset’s true average price within a session. Mastering VWAP means understanding that it is a benchmark for performance and a robust indicator for intraday trend bias. By applying VWAP strategically and strictly adhering to its intraday framework, traders can significantly sharpen their market analysis and execution quality.
Don’t trade blindly; trade with professional clarity. Visit Piprider to access the advanced analytical frameworks and expert strategies that will give you your next trading edge.


