Author for Forex Learn Levels 1–3, creating accessible, research-driven modules that simplify forex and personal finance for beginner to intermediate learners.
The pin bar is a core candlestick pattern in price action trading, visually representing a sudden price rejection. While highly recognizable, its effectiveness is strictly dependent on structural context. Understanding how to validate this signal against broader market conditions can help traders filter out market noise and refine their entry decisions. This guide will provide...
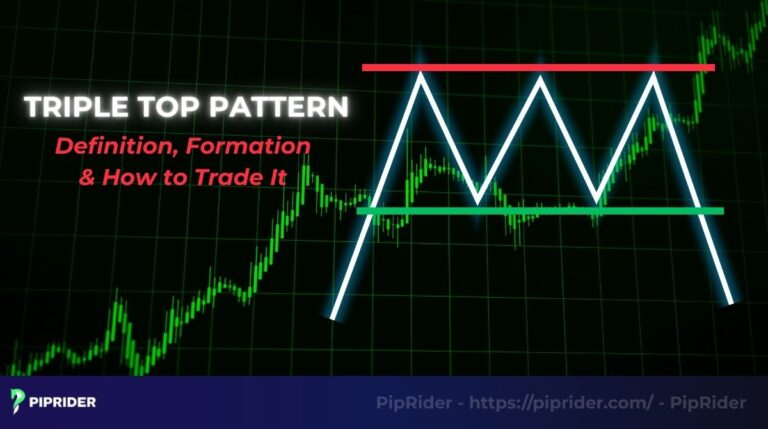
The Triple Top is a classic major bearish reversal pattern in technical analysis (StockCharts, n.d.). While highly recognizable, its real-world reliability depends heavily on strict confirmation—specifically a decisive neckline close, broader market context, and volume validation. This comprehensive guide will provide a detailed examination of the Triple Top pattern, covering its structure and the disciplined...
Harmonic patterns represent specific geometric price formations on a chart that adhere to precise Fibonacci retracement and extension ratios. These patterns in Forex trading are not random; they are believed to reflect the cyclical and repetitive nature of market psychology, often signaling potential shifts in supply and demand. Harmonic patterns are advanced Fibonacci-based reversal structures....
Identifying a reliable bullish continuation signal with a clear, measurable profit target is crucial for systematic trading. The Cup and Handle pattern is a classic technical setup, highly regarded for its distinctive shape and strong signaling power. This guide provides the complete, structural methodology required to calculate the pattern’s profit objective and integrate it into...
China’s national economy maintained its momentum of stable and sustainable growth in August 2025, according to a report released on September 15 by the National Bureau of Statistics (NBS). The data paints a picture of a resilient economy navigating both internal and external challenges, driven by strong performance in high-tech manufacturing and services, even as...
Piprider, a leading independent platform for Forex education, today announced a strategic content collaboration with Sangeeta S Maskeri, an experienced Finance Content Writer and former banking and wealth management professional. This partnership aims to significantly enhance the quality and depth of Piprider’s financial content, further solidifying its position as a trusted educational hub for traders...
Piprider, a trusted independent platform empowering over 300,000 traders globally with transparent Forex trading knowledge, resources, and analysis, today officially announced the launch of its new website, [piprider.com]. This strategic launch aims to significantly improve user experience, provide even richer insights, and solidify Piprider’s position as a leading educational and resource hub for traders of...
Maintaining discipline and avoiding costly errors are critical elements for sustainable success in trading. A trading checklist serves as an essential risk management and execution tool to achieve this consistency. This article introduces a comprehensive, 10-step checklist of critical steps. Implementing this pre-trade checklist helps traders systematically verify all market conditions and strategic criteria, fostering...
A frequent source of confusion for new traders concerns the fundamental distinction between Forex trading and Binary Options. While both methods involve speculating on price movements in financial markets, they differ significantly in their mechanics, risk profiles, profit potential, and legal frameworks. This comprehensive guide will break down these critical differences, providing clarity on the...
Forex Order Blocks are a structural element of institutional trading activity identified through concentrated price action analysis. These zones mark where significant institutional orders were executed, establishing critical supply and demand imbalances. Accurate utilization of order blocks enables traders to define high-probability entry points and refine risk parameters within a trade setup. This comprehensive guide...
Have you ever wondered how people profit from the fluctuations of currencies like the US Dollar, Euro, or Japanese Yen? Welcome to the world of Forex. Foreign exchange trading opens up immense financial opportunities, but it also comes with significant risks. In this guide, the expert team at Piprider will provide you with a clear...
If traders are new to currency trading, “What are pips in forex?” is one of the first and most fundamental questions they’ll ask. Understanding this concept is essential, as it forms the basis for everything from calculating the trade outcomes to managing risk. This guide is designed to make it simple. Piprider will provide a...
Determining the correct position size is a critical challenge for many Forex traders. Position sizing stands as a fundamental component of effective risk management, directly impacting the financial exposure of every trade. This comprehensive guide explains the mechanics of Forex lot sizes, detailing the mathematical formulas required to calculate precise position sizes and manage trading...
Trading charts can be confusing at first glance, but they contain valuable information. Indicators are the tools that help you decode the market’s story. Instead of trying to learn them all, you only need to master a few key indicators from each category. This guide will introduce the technical indicators list with 26 essentials, providing...
If you’ve ever struggled to follow a market trend, you’re not alone. The real challenge isn’t just seeing a trend, but knowing when to trust it and identifying the exact moment it shifts. The Supertrend indicator offers a solution. It is a dynamic, volatility-based tool that removes guesswork and emotional second-guessing from trend trading by...
The Stochastic Oscillator, a classic momentum indicator developed by Dr. George C. Lane in the 1950s, is essential for identifying potential trend reversals. Unlike trend-following tools, the Stochastic excels at measuring the speed and magnitude of price within a recent range. This guide provides a deep dive into the indicator’s mechanics, optimized settings for various...
One of the most common frustrations in trading is watching a perfect market entry setup fail. A trader might enter a position only to see momentum vanish, or get stopped out by a violent, unexpected price swing. Both issues stem from the same root cause: a sudden shift in volatility. Understanding a market’s rhythm, its...
Traders often struggle to balance the reliability of the MACD with the speed of the Stochastic. The Schaff Trend Cycle (STC) addresses this dilemma by fusing trend following and cycle analysis into a single, smooth indicator. Designed to minimize lag while filtering out market noise, the STC helps traders identify high-probability entry points earlier than...