

If you’ve ever struggled to follow a market trend, you’re not alone. The real challenge isn’t just seeing a trend, but knowing when to trust it and identifying the exact moment it shifts. The Supertrend indicator offers a solution. It is a dynamic, volatility-based tool that removes guesswork and emotional second-guessing from trend trading by providing a clear, color-coded boundary for price action.
This guide serves as a comprehensive masterclass on its formula, internal mechanics, and seven proven strategies to dominate trend-following setups.
Key Takeaways
- Core logic: Uses a single line derived from price midpoints and volatility (ATR) to define trend direction.
- Visual signals: Green line below price = uptrend (trailing support); red line above price = downtrend (trailing resistance).
- Customization: Highly sensitive to two parameters – ATR period and multiplier, allowing it to adapt to any asset class.
- Strategic reality: Superior in trending markets but requires systematic filtering (using EMA or ADX) to survive sideways “whipsaw” phases.
1. What Is The Supertrend Indicator?
The Supertrend indicator is a technical analysis tool designed to identify the primary direction of the market trend while filtering out short-term market noise. Unlike static indicators, it is plotted directly on the price chart, providing an immediate visual cue for entry and exit points. This indicator combines the Average True Range (ATR) and price to determine the trend.
Developed by French author and trader Olivier Seban in 2009, it has gained immense popularity in stocks, forex trading, and crypto. Its unique advantage over simple moving averages is its volatility-adjustment. The Supertrend line doesn’t just follow price; it maintains a distance based on the market’s current “breath” (volatility), making it an exceptional trailing stop-loss tool.
2. How does the Supertrend indicator work? (The Mechanics of Precision)
The Supertrend is far more than a simple color-changing line; it is a sophisticated volatility-adjusted boundary. Its core intelligence lies in its ability to bridge the gap between raw price action and market “noise” using the Average True Range (ATR). Here is a deep dive into its internal engine:
- The volatility-proof buffer: Unlike standard Moving Averages that only track price, the Supertrend accounts for market “breath.” By applying a Multiplier to the ATR, the indicator creates a dynamic safety zone. In high-velocity environments (e.g., during NFP or CPI volatility), the buffer widens to prevent “stop-outs” from temporary price spikes. Conversely, in low-volatility regimes, the line tightens to protect accumulated profits.
- The typical price anchor: The calculation is anchored to the typical price (High + Low) / 2. By ignoring the bias of the “Close” and focusing on the median of the candle’s range, the Supertrend remains remarkably stable, shielding traders from anomalous end-of-session ticks.
- The “ratchet” mechanism (Trailing logic): This is the Supertrend’s “secret sauce.” In an uptrend, the line is mathematically programmed to move only upwards or remain flat—it never moves down. This creates a one-way street logic that transforms the indicator into a rigid, objective trailing stop-loss. The “flip” only occurs when the market provides a decisive closing price on the opposite side of this boundary.
- Non-repainting integrity: For Forex traders, “Repainting” is a nightmare. The standard Supertrend is a non-repainting indicator. Once a candle closes and the signal is locked, it becomes a permanent part of the price history. This integrity is why it remains a foundational tool for both manual strategies and high-frequency algorithmic systems.
3. Components of the Supertrend Indicator
To master the Supertrend, you must understand the four components that dictate its behavior
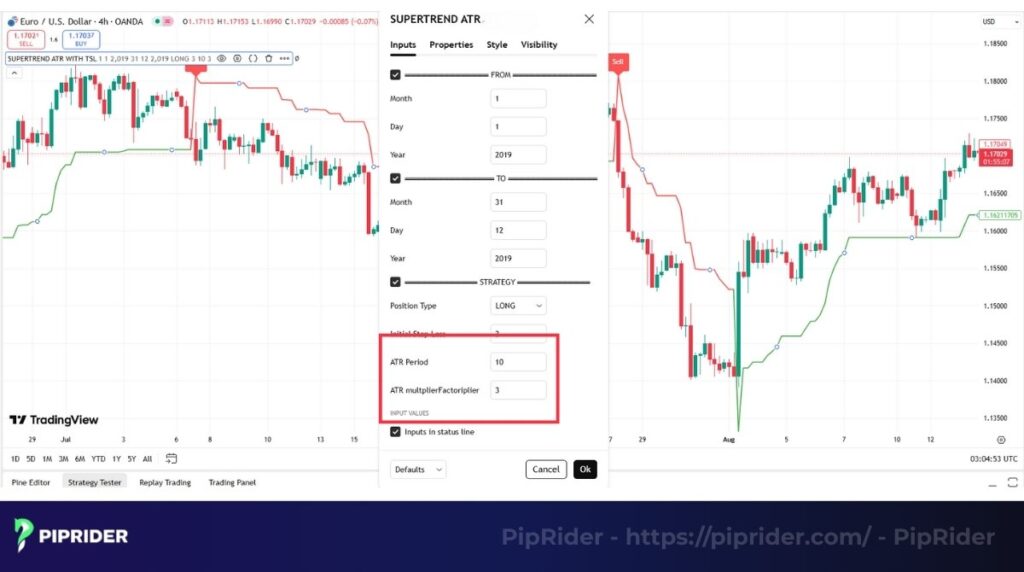
3.1. The Primary Inputs (The Dials)
The image above shows there are the only two “dials” traders can turn, and they control the entire behavior of the indicator.
- ATR period (memory): Usually set to 10. This defines how far back the indicator looks to calculate volatility. A shorter period (e.g., 7) makes the line “nervous” and fast; a longer period (e.g., 20) makes it “calm” and stable.
- Multiplier (sensitivity): Usually set to 3. This determines the distance of the line from the price.
- Low multiplier (1.5 – 2): Tight trailing stop; catches early trends but suffers in choppy markets.
- High multiplier (4 – 5): Loose trailing stop; remains in major trends for longer but gives back more profit on reversals.
3.2. The Hidden Components: Upper and Lower Bands
Behind the single line on your chart, the Supertrend calculates two invisible boundaries at all times:
- The upper band: Midpoint + (ATR × Multiplier) — acts as potential resistance.
- The lower band: Midpoint – (ATR × Multiplier) — acts as potential support.
The indicator displays the Lower Band during an uptrend and the Upper Band during a downtrend. Crucially, the “Final Band” logic ensures that the green line never moves down and the red line never moves up. This creates a true trailing stop that locks in progress.
4. Supertrend indicator formula and calculation
The Supertrend’s brilliance lies in its ability to transform a simple mathematical concept into an incredibly intuitive visual guide. While manual calculation is unnecessary, understanding the Supertrend indicator’s formula is crucial for appreciating how the indicator functions.
4.1. The basic band formulas
The supertrend indicator initially calculates two preliminary bands for each candle. These are like dynamic channels that constantly adjust to price.
Here are the formulas for these basic bands:
Upper Band = [(High + Low) / 2] + (ATR x Multiplier)
Lower Band = [(High + Low) / 2] – (ATR x Multiplier)
Where:
- (High + Low) / 2 is the typical price or midpoint of the candle.
- Multiplier is your chosen sensitivity setting (e.g., 3).
4.2. The calculation process in simple steps
The real intelligence of the Supertrend lies in its method for combining these basic bands. The indicator is specifically designed to remain on one side of the price until a confirmed break occurs.
Step 1: Calculate the ATR
The process begins by calculating it for each candle based on the chosen period (e.g., 10).
Step 2: Calculate the basic bands
Using the newly calculated ATR and the specified multiplier, the indicator then determines the Upper and Lower Band values for that candle.
Step 3: Apply the trend logic
This final, crucial step is what gives the Supertrend its characteristic “stickiness”.
- The Supertrend’s appearance changes based on the market’s trend. In an uptrend, a green Lower Band provides a support point. For a flip to a downtrend, the price must decisively cross and break below it.
- Conversely, in a downtrend, a red Upper Band provides a resistance point. A confirmed reversal is signaled by a decisive break above that same band.
4.3. A simple example of the calculation
To make this crystal clear, let’s look at how the basic bands are calculated for a single candle, ignoring the complex “flip” logic for a moment. This will help you understand the core mechanics.
Let’s assume the following for a single candle on the GBP/USD chart with the default settings (10, 3):
- High of the candle = 1.2550
- Low of the candle = 1.2500
- Current ATR(10) value = 0.0020 (20 pips)
- Multiplier = 3
Now, we just plug these numbers into the basic formulas:
Step 1: Calculate the midpoint price
| Midpoint = (1.2550 + 1.2500) / 2 = 1.2525 |
Step 2: Calculate the ATR component
| ATR Component = 0.0020 (ATR) x 3 (Multiplier) = 0.0060 |
Step 3: Calculate the final bands
| Upper Band = 1.2525 + 0.0060 = 1.2585 Lower Band = 1.2525 – 0.0060 = 1.2465 |
So, for this specific candle, the indicator’s two hidden bands are at 1.2585 and 1.2465. The Supertrend will then decide which of these (or a previous value) to display on the chart based on whether the price is currently in an uptrend or a downtrend.
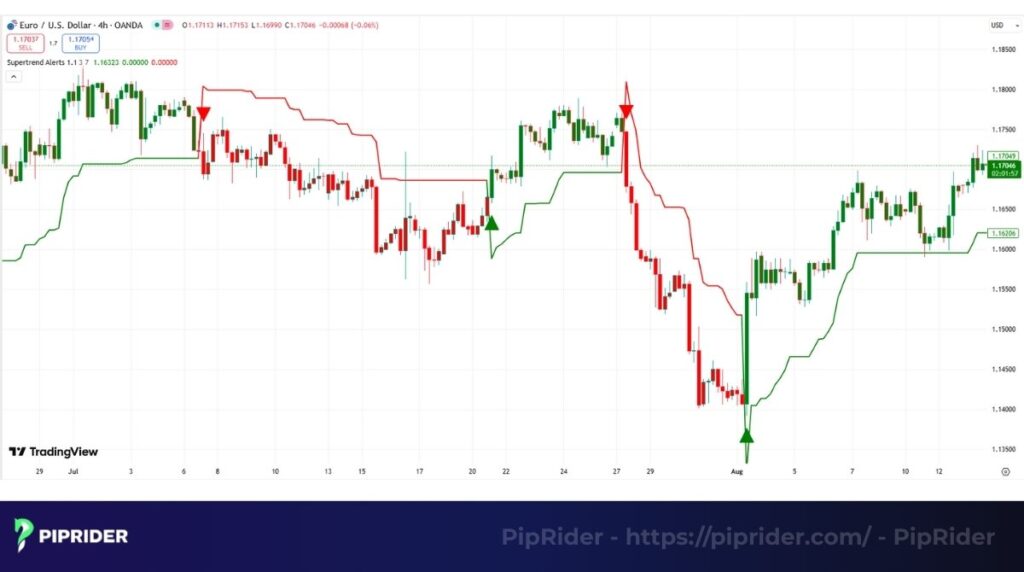
5. How to Trade Supertrend: Professional Execution (SOP)
The best part about the Supertrend is that its signals are incredibly simple and visual. However, seeing a signal and knowing how to trade it are two different things. Seeing a green line is easy; trading it profitably requires a disciplined Standard Operating Procedure (SOP).
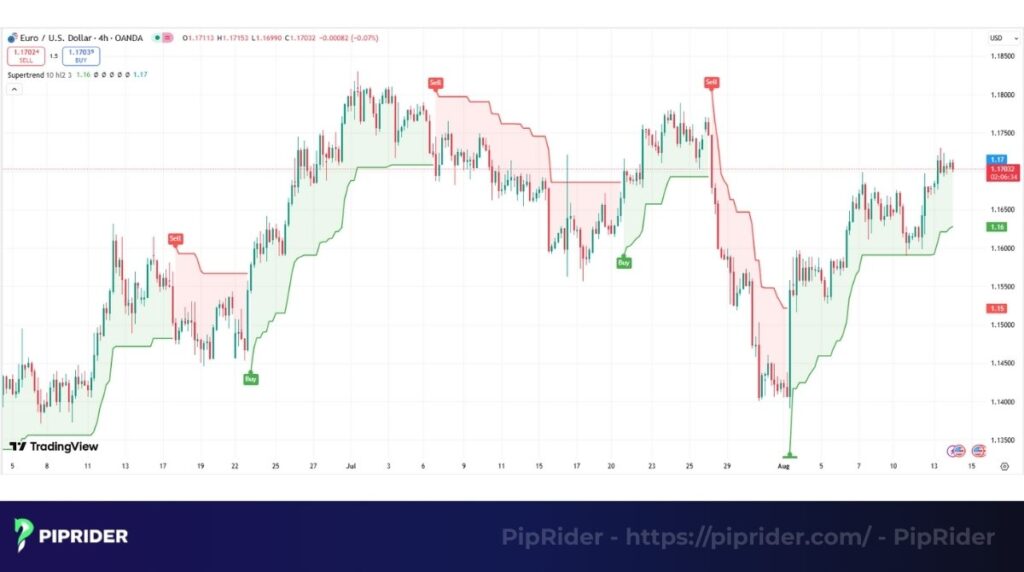
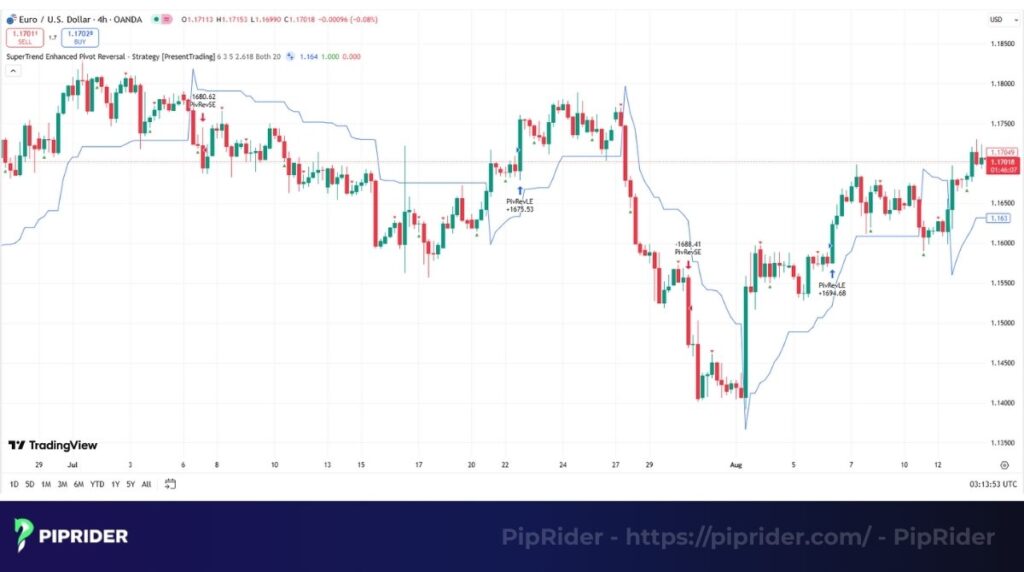
5.1. The Buy Signal Execution
Based on the chart above, a buy signal is your cue that the market’s momentum has likely shifted from bearish to bullish. Let’s break down how to trade this setup effectively.
- The signal: A buy signal is triggered when a bar closes decisively above the red Supertrend line. This action causes the indicator to flip to green on the subsequent bar.
- Actionable steps:
- Entry: The standard approach is to enter a buy order at the opening price of the bar immediately following the flip.
- Stop loss: Traders have two logical choices for an initial stop loss. The more aggressive option is just below the low of the breakout bar, while a more conservative option is just below the new green Supertrend.
- Trade management: As price moves favorably, the green Supertrend will trail behind it, serving as an effective dynamic trailing stop. A position is typically held until a bar eventually closes below it. This dynamic trailing stop helps traders identify optimal exit points.
5.2. Trading the sell signal
Conversely, a sell signal indicates that the bears have likely taken control of the market.
- The signal: The sell signal occurs when a bar closes decisively below the green Supertrend, causing it to flip to red on the next bar.
- Actionable steps:
- Entry: A sell order can be placed at the opening price of the bar that follows the flip.
- Stop loss: The initial stop can be positioned either just above the high of the breakdown bar or slightly above the new red Supertrend.
- Trade management: The short trade is held as long as the red Supertrend remains above the price. An exit signal is triggered when a bar finally closes back above this red boundary.
5.3. Important notes on lag and false signals
While the signals are simple, understanding the indicator’s limitations is crucial for long-term success.
Note 1: Inherent lag
The Supertrend is always reactive. It will only signal a trend change after a significant price movements has already occurred. The indicator’s design means it will never catch the absolute peak or trough; its goal is to capture the main body of the trend.
Note 2: Vulnerability to whipsaws
The indicator’s biggest weakness is its poor performance in sideways market conditions. When a market lacks a clear trend, the price will constantly “whipsaw” across the line, generating a series of frustrating and costly wrong signals. For this reason, a trader must always use a secondary tool, such as a long-term EMA or the ADX, to confirm that a tradable trend is actually in place.
6. Optimized Settings by Trading Style
While the default settings of (10, 3) are a fantastic starting point, one of the Supertrend’s greatest strengths is its flexibility. Adjusting the Period and Multiplier allows a trader to fine-tune the indicator’s sensitivity to match a specific trading style and time frames.
This adjustment always involves a trade-off: a faster setting will produce earlier signals with more noise, while a slower setting generates fewer signals with higher reliability.
The Supertrend indicator can be used on any of the major trading platforms that supports custom indicators.
| Trading style | ATR period | Multiplier | Common time frames | Reasons |
| Scalping | 7 | 2–3 | 1-minute, 5-minute | For scalping, speed is everything. A shorter period makes the indicator react instantly to small price moves, but this comes with a high risk of false signals. |
| Intraday Trading | 7–10 | 2–3 | 15-minute, 1-hour | This range is often considered the ideal balance for many intraday traders. Using the default 10, 3 or a slightly faster 7, 2 on an hourly chart provides a great balance, capturing the main session trends without getting shaken out by minor noise. |
| Swing Trading | 10–14 | 3–4 | 4-hour, Daily | For swing trading, reliability is more important than speed. A setting like 14, 3 or even 12, 4 on a daily chart will help you stay in a trend for several days or weeks, filtering out the volatility. |
Important note: The platforms mentioned are just examples of where these styles are popular. The Supertrend indicator can be used on any platform that supports custom indicators.
Whether trader are looking for the Supertrend indicator on Webull, Thinkorswim, or as a NinjaTrader 8 script, the principles of adjusting these settings remain the same. This also applies to the Metatrader 4 version (often called the Supertrend for MT4).
7. Intraday trading strategies using Supertrend
The Supertrend is a favorite among intraday traders due to its clarity and simplicity. Let’s break down four distinct strategies traders can use to find and manage trades within a single trading session.
7.1. Strategy 1: The Flip Entry (Conservative vs. Aggressive)
The basic Supertrend breakout is the most straightforward way to use the indicator, acting directly on its primary signal.
This is the most common use of the indicator, acting based on the color change (flip) of the Supertrend line. This strategy is divided into two modes based on risk appetite and market conditions:
Mode A: Conservative (Breakout + Filter)
- Logic: Enter trades after the new trend has been confirmed and a noise filter has been applied.
- Rules: Wait for the candle to close above the Supertrend line. Only enter trades when there is further confirmation from the major trend (e.g., price above the 200 EMA) or strong candlestick momentum (large candlestick body).
- Advantages: Higher win rate, avoids false signals (whipsaws).
Mode B: Aggressive (News/Reversal)
- Logic: Enter trades immediately when momentum changes suddenly.
- Rules: Enter trades at the opening price of the next candlestick after the flip signal. Often applied after strong news releases (such as NFP, CPI) that cause a V-shaped trend reversal.
- Critical filter: Avoid entering trades if the signal candle is a very large “News Spike” candle (piercing too far from the line) because the price will usually retrace afterward.
7.2. Strategy 2: The Supertrend Pullback (High Probability)
The Supertrend pullback is a more conservative and, in my opinion, a higher-probability strategy. Instead of entering on the initial breakout, we wait for the first successful test of the new trend.
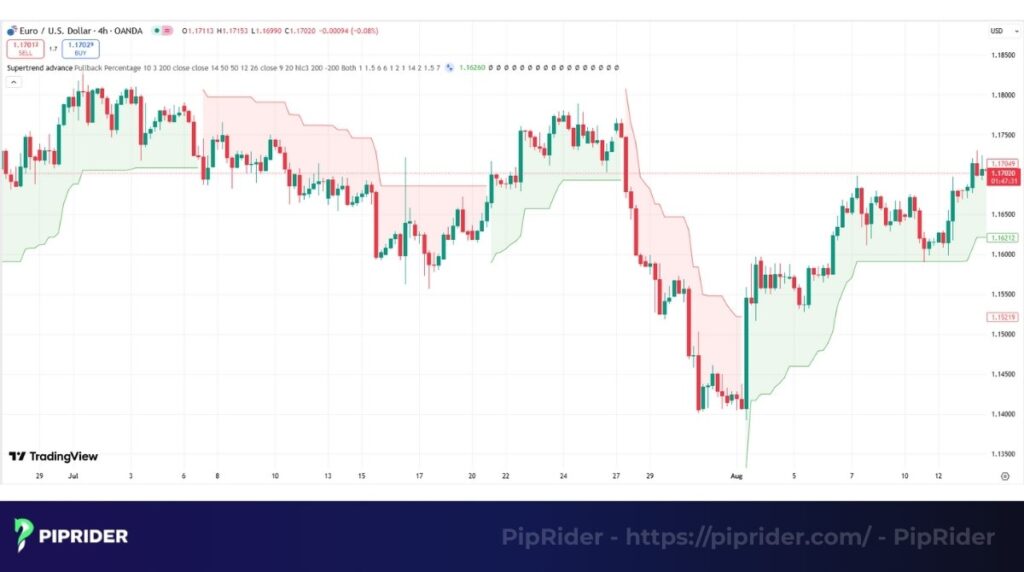
After a new trend is established, the price will often pull back to test the Supertrend line, which is now acting as dynamic support or resistance levels. Traders enter on this retest.
The rules for a buy trade:
- Establish the trend: The indicator must be in an uptrend and below the price.
- Wait for the pullback: Allow the price to correct downwards and make contact with the indicator’s line.
- Confirm the bounce: Look for a positive candlestick pattern to form right at the indicator’s line.
- Entry: Enter a long trade after the confirmation candle closes. Traders can place their stop just under the low point of this candle.
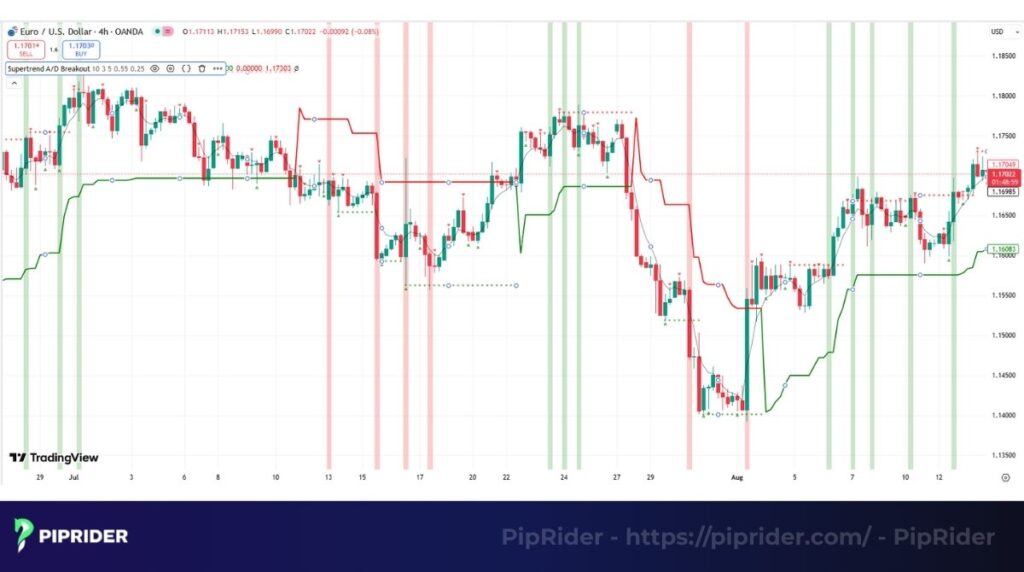
7.3. Strategy 3: Range-Break Confirmation
This strategy uses the Supertrend to confirm a decisive market move from a period of consolidation.
A market often consolidates in a tight range before its next big move. Use the indicator’s flip as our confirmation that the breakout is real and a new trend is starting.
The rules for a buy trade:
- Identify the range: Draw support and resistance lines around a clear sideways channel.
- Wait for the price breakout: Watch for a candle to close decisively above the range’s resistance.
- Confirm with Supertrend: The indicator must flip from red to green either on the breakout candle or within the next 1-2 bars. This is your final confirmation.
- Entry: Enter after the Supertrend has flipped to green.
8. Swing trading and long-term strategies using Supertrend
The Supertrend’s utility extends beyond just intraday trading. Its ability to track a trend makes it incredibly valuable for swing and position traders who hold trades for days, weeks, or even months.
For these styles, the key is to pair the Supertrend with other tools to focus on the big picture and filter out short-term noise.
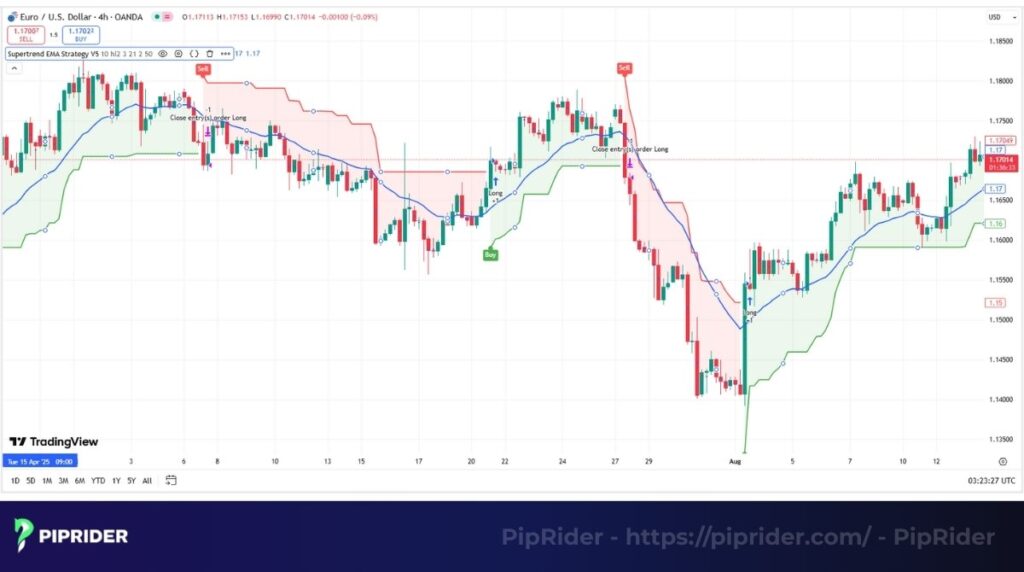
8.1. Strategy 1: The Trend-Following Filter (200 EMA)
The Supertrend trend-following system is a time-tested and solid strategy created to ensure you are trading in alignment with the primary market trend.
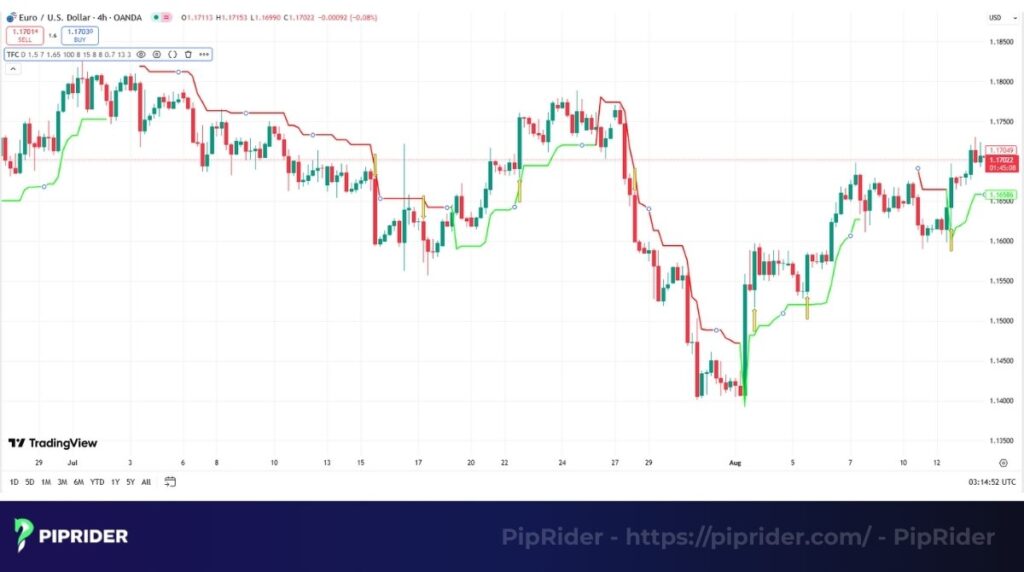
Use a long-period moving average, like the 100-period or 200-period EMA, as the primary trend filter. The Supertrend is then used as the entry and exit trigger, but traders only take signals that align with the direction of the main EMA.
The rules for a long position:
- Primary trend: The first condition is that price must be positioned above the 200 EMA on the daily chart.
- Entry signal: A long position is triggered when the Supertrend indicator on the chart changes from red to green.
- Exit signal (Trailing Stop): Traders should remain in the trade as long as the green Supertrend continues to display. An exit is triggered only after a candle closes beneath the indicator, which will cause it to turn crimson.
8.2. Strategy 2: The Supertrend breakout confirmation
This strategy uses the Supertrend to confirm a decisive market move from a major consolidation pattern, like a multi-week triangle or range.
A move out of a major consolidation on a daily or weekly chart is a significant event, often involving chart patterns that complement trend indicators to validate the strength of the new trend. The Supertrend’s flip serves as the final, objective validation that the breakout is legitimate and a new, powerful trend is underway.
The process:
- Identify the pattern: Find a clear consolidation formation on a high time frame chart.
- Wait for the price breakout: Monitor the chart for a daily candle that closes firmly beyond the boundaries of the pattern.
- Wait for the Supertrend confirmation: See the indicator change its color to validate the direction of the move. It’s best to wait for this signal, even if it arrives a candle or two after the initial price breakout. This helps traders avoid getting caught in a “fakeout.”
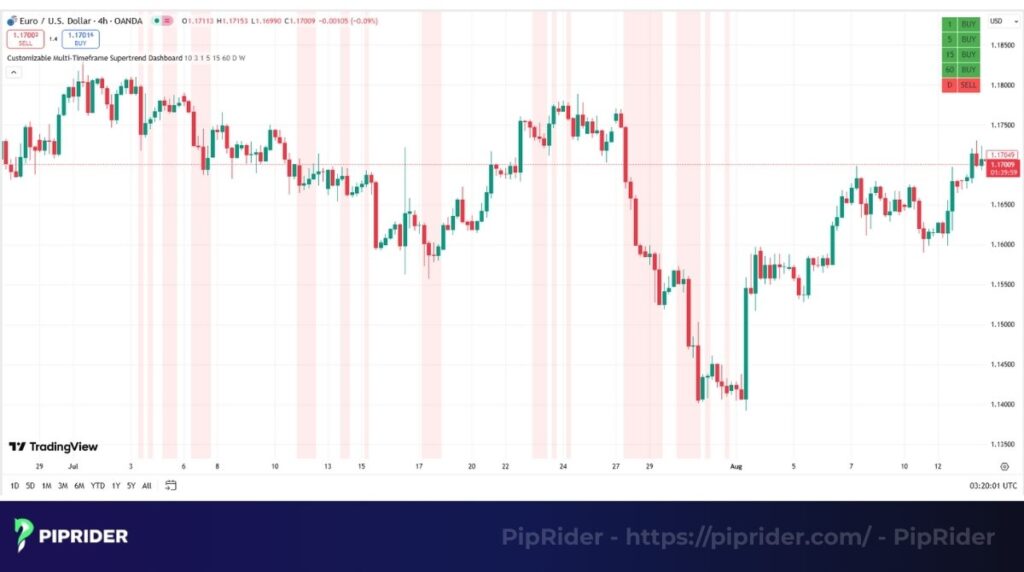
8.3. Strategy 3: Multi-Timeframe Confluence (H4/M15)
Multi-timeframe analysis is a powerful technique used by many professional traders to refine their entries.
Use a higher timeframe to define our bias (bullish or bearish) and a lower one to find a precise, low-risk entry point.
The process:
- Daily chart analysis: The first step is to check the Supertrend’s status on the daily timeframe. If its color is green, your bias for the entire day or week is bullish only.
- H1 chart entry: Next, move to the 1-hour chart and wait for the Supertrend to generate a buy signal by changing from red to green.
Filtering intraday signals with the primary trend from the daily timeframe dramatically increases the probability of any given trade and helps traders avoid fighting the main market current.
9. How to Add Supertrend on Professional Platforms
While the underlying logic is universal, the deployment process varies across the major trading ecosystems. Here is the professional SOP (Standard Operating Procedure) for setting up your terminal:
9.1. TradingView (The Industry Standard for Charting)
- Navigate to the “Indicators” tab on the top toolbar.
- Search for “Supertrend”. While there are thousands of community scripts, the “Built-in” version by TradingView is recommended for its calculation speed and stability.
- Advanced Tweak: For multi-timeframe analysis, search for “Supertrend MTF” scripts. This allows you to overlay Daily trend signals directly onto your 15-minute execution chart—a powerful confluence technique.
- Access Settings > Inputs to calibrate your ATR Length (Default: 10) and Multiplier (Default: 3).
9.2. MetaTrader 4 & 5 (The Algorithmic Workhorse)
MetaTrader requires a manual installation as the Supertrend is not a native “out-of-the-box” tool:
- Installation: Download a trusted .mq4 or .ex4 (MT4) or .mq5/.ex5 (MT5) file.
- Directory: In your terminal, go to File > Open Data Folder. Move the file into MQL4 (or MQL5) > Indicators.
- Activation: Right-click “Indicators” in the Navigator panel, hit Refresh, and drag the Supertrend onto your workspace.
- Alerts: Ensure you enable “Allow DLL imports” and “Push Notifications” in the indicator’s common settings to receive real-time “Flip” alerts on your mobile device.
9.3. NinjaTrader 8 (The Institutional Choice)
- Go to Tools > Import > NinjaScript Add-On and select the indicator’s .zip file.
- Right-click your chart, select Indicators, and add “Supertrend” (often listed under its creator’s name, Seban).
- The Edge: Use NinjaTrader’s “Market Analyzer” to scan dozens of pairs simultaneously. You can set up a column that turns Green/Red based on the Supertrend flip, ensuring you never miss a breakout across the entire FX majors list.
10. Combining Supertrend with other indicators
While the Supertrend is a powerful tool, no single indicator should ever be used in isolation. The reliability of its signals increases exponentially when confirmed by other, non-correlated indicators.
A helpful approach is to view the Supertrend as the primary trend guide, while the following indicators act as expert consultants providing a valuable second opinion.
10.1. Combining Supertrend with an EMA crossover
Pairing the Supertrend’s clarity with the proven logic of using golden crosses with trend indicators creates a classic and robust trend-following combination.
A dual moving averages crossover, such as the 21 and 50 period, serves as the primary signal that a major trend shift is underway. The Supertrend is then employed as final confirmation and as a tool for managing the trade.
The strategy:
- Wait for the EMA crossover: On a daily chart, wait for the 21-period EMA to cross above the 50-period EMA. This is your initial alert that a new uptrend may be forming.
- Wait for the Supertrend confirmation: Do not enter yet. Allow time for the Supertrend indicator to change from red to green. This confirms that price action and volatility agree with the moving average’s signal.
- Entry and exit: Take a long position after the Supertrend changes color. Its green line can then be utilized as a dynamic trailing stop.
10.2. Using the RSI as an overbought/oversold filter
Pairing the Supertrend with the RSI is an excellent method for filtering out false signals, especially in choppy markets.
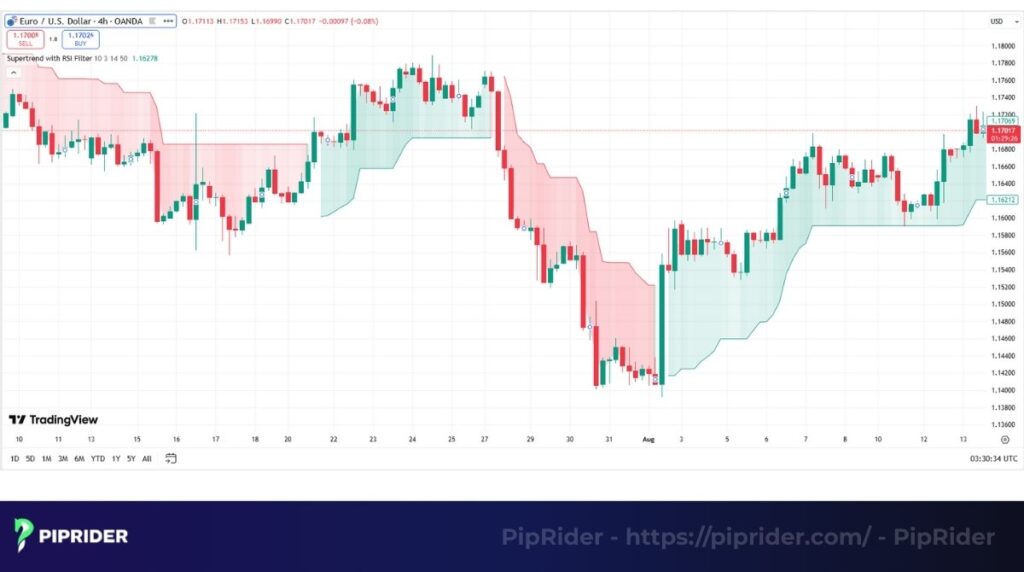
The Supertrend’s most significant drawback is its tendency to produce false triggers in sideways markets. The Relative Strength Index (RSI) is an oscillator that helps us identify overbought and oversold conditions. By combining them, traders can avoid buying when the market is already overbought or selling when it’s already oversold.
The strategy:
- Get the Supertrend signal: Wait for the indicator to change from red to green, which provides your initial buy trigger.
- Check the RSI filter: Before entering, look at the RSI (14). Is the oscillator below the 70 level? If it’s already in the overbought zone (>70), you should ignore the buy alert, as the move may be too extended.
- Entry: A much safer entry occurs when the Supertrend provides a buy signal and the corresponding oscillator reading is not overbought.
10.3. Using Bollinger Bands and Stochastic for reversals
Using Bollinger Bands and Stochastic is a more advanced strategy for spotting potential trend reversals.
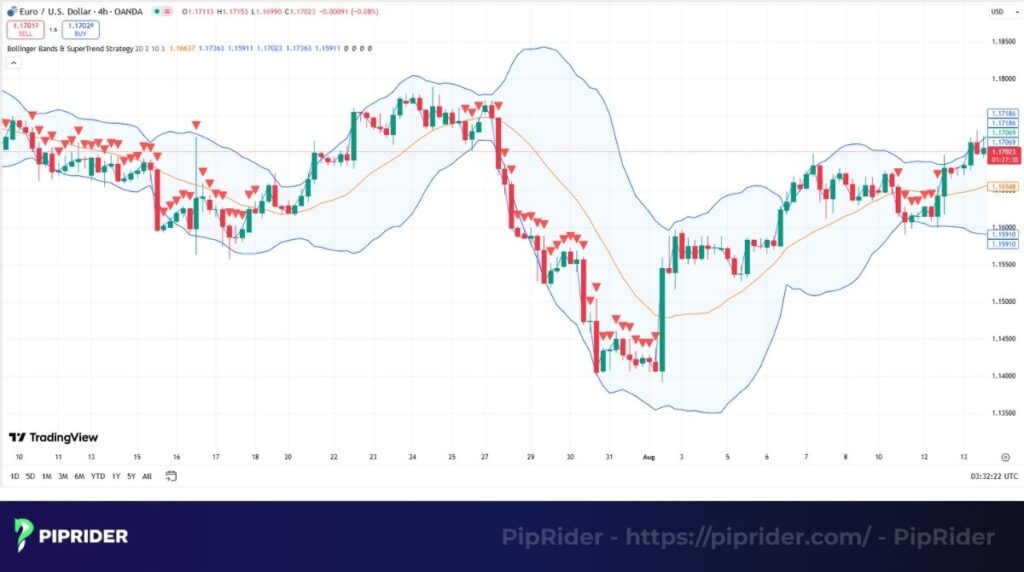
Look for a situation where the price is showing extreme behavior (touching the outer Bollinger Band), and short-term momentum (Stochastic) is reversing, all confirmed by a Supertrend flip. The principles behind the Stochastic Oscillator, as detailed on resources like Investopedia, are key here.
The strategy for a sell signal:
- Price at extreme: The price must touch or close outside the upper Bollinger Band (20, 2). This signals a statistically extreme move.
- Momentum reversal: The Stochastic Oscillator must be in the overbought zone (>80) and give a bearish crossover.
- Final confirmation: The Supertrend indicator must then flip from green to red. The confluence of three different types of signals creates a very high-probability reversal setup, far more reliable than a simple ‘super signals‘ indicator.
11. Advantages and disadvantages of Supertrend indicator
No indicator is perfect, and the Supertrend is no exception. While the indicator’s clarity makes it one of helpul tools, a trader must be brutally honest about its strengths and weaknesses. A clear understanding of both is the key to using this tool effectively.
| Feature | Detailed Advantages | Detailed Disadvantages |
|---|---|---|
| Ease of use | Visual clarity: Red/Green signals eliminate emotional second-guessing, making it ideal for systematic trading. | Lagging signal: As a trend-follower, it signals after the move has started. It will never catch the absolute top or bottom. |
| Risk control | Dynamic trailing stop: Provides an objective, volatility-adjusted level to protect profits as a trend progresses. | Sideways decay: In non-trending markets, price will “whipsaw” across the line, causing multiple consecutive small losses. |
| Objectivity | Non-discretionary: Signals are based on clear closing price rules, which is perfect for building trading algorithms. | News sensitivity: Sudden spikes can flip the indicator only for price to reverse, requiring secondary filters like the ADX. |
12. Backtesting and the “Expectancy” Reality Check
In professional trading, “Win Rate” is a vanity metric; Expectancy is the only reality that matters. To master the Supertrend, you must pivot your mindset from accuracy to statistical edge.
12.1. The “Anti-Fragile” Statistical Profile
Backtesting the Supertrend on a pair like GBP/USD typically yields a Win Rate between 38% and 46%. To a novice, this looks like failure. To a professional, this is the hallmark of a high-reward-to-risk system.
- The power of convexity: Trend-following is designed to “lose small and win big.” You may suffer five consecutive “whipsaw” losses in a ranging market, but the sixth trade—the one that catches a 400-pip trend—will wipe out all previous losses and deliver a significant net profit.
- Profit factor vs. Win rate: Focus on the profit factor (Gross Profit / Gross Loss). A robust Supertrend strategy often maintains a Profit Factor above 1.6, meaning you are making $1.60 for every $1 you risk, regardless of how often you are “right”.
12.2. Avoiding the “Curve Fitting” Trap
The greatest danger in backtesting is over-optimization—tweaking settings (e.g., using 11.2 and 2.9) to perfectly fit past data. This is “Curve Fitting” and it leads to disaster in live trading.
- The robustness test: A valid strategy should work across a range of settings. If it works at (10, 3) but fails at (12, 3), it lacks the robustness to survive changing market conditions.
- Sample size sovereignty: Never judge a strategy based on a week of data. A true reality check requires at least 150-200 trades across different cycles: Trending, Ranging, and High-Volatility “Chaos.”
- Drawdown discipline: Given the moderate win rate, strict risk management is non-negotiable. Risking more than 1% per trade is dangerous. Your account must be “bulletproof” enough to survive the inevitable string of 6-8 small losses so that you are still in the game when the “Big Trend” arrives.
13. Frequently Asked Questions (FAQs)
Here are some quick, no-nonsense answers to the questions that traders ask most often about the Supertrend indicator.
14. Conclusion
The Supertrend indicator is a master of clarity. In an industry filled with confusing noise, it provides a “line in the sand” that keeps traders disciplined. While it struggles in sideways markets, its strength in capturing major market moves is undeniable.
This guide has provided the blueprint. To get started, add this tool to your charts and test a strategy in a demo account. You’ll then directly experience the objectivity this indicator can bring to your trading. To continue your journey, explore more best technical indicators in our Learn Forex category right here on Piprider.


