
The Stochastic Oscillator, a classic momentum indicator developed by Dr. George C. Lane in the 1950s, is essential for identifying potential trend reversals. Unlike trend-following tools, the Stochastic excels at measuring the speed and magnitude of price within a recent range.
This guide provides a deep dive into the indicator’s mechanics, optimized settings for various assets, and four master strategies designed to turn momentum shifts into high-probability trading opportunities.
Key Takeaways
- Core function: Measures the closing price relative to the high-low range over a specific period.
- Sensitivity: More responsive than the RSI, providing earlier alerts for reversals but requiring careful filtering in strong trends.
- The engine: Primary signals are generated by the interaction between the fast %K line and the slow %D line.
- Strategic mastery: Success depends on combining Stochastic signals with price action, volume, and major support/resistance levels.
1. What Is The Stochastic Oscillator?
Stochastic Oscillator is a momentum indicator that tracks the “speed” of price movements. Developed by Dr. George C. Lane, it is built on a fundamental observation: as a price trend moves upward, closing prices tend to accumulate near the top of the recent range. Conversely, in a downtrend, prices close near the bottom.
Lane famously noted that “momentum changes direction before price” (Lane, 1984). This makes the Stochastic a “leading” indicator that can provide a heads-up before an actual trend reversal is visible on a price chart. It is most effective in range-bound or choppy markets but can be a powerful tool for timing pullbacks in strong trends.
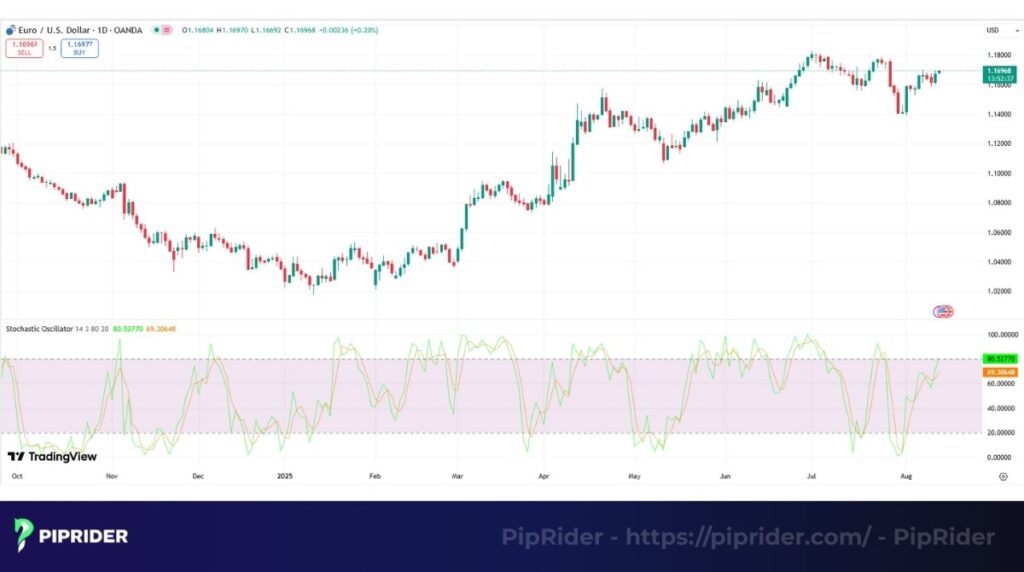
The Stochastic isn’t designed to follow long, powerful trends like the MACD. Instead, it excels at one specific job: measuring the momentum of price within a recent range to identify those “bouncing ball” moments where a reversal is likely. Stochastic Oscillator’s core purpose is to identify potential reversals by determining where the current closing price is in relation to its recent high-low range. This indicator is plotted as two lines, known as %K and %D, that move between 0 and 100.
2. Calculation: Understanding %K, %D, and Smoothing
To use the Stochastic effectively, you must understand the math behind the lines. The calculation is designed to plot price location on a scale of 0 to 100.
2.1. The Core Formulas
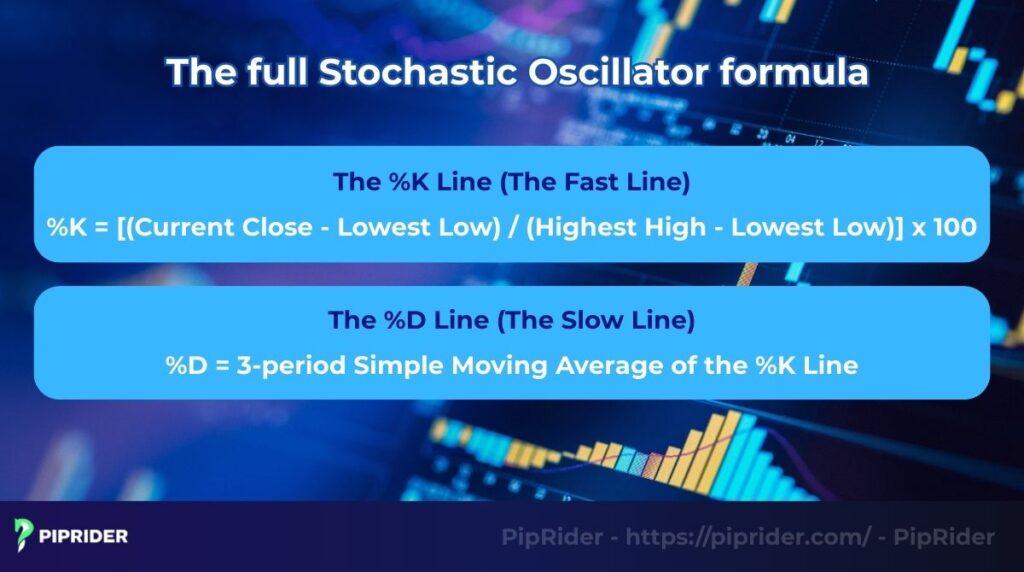
The %K Line (Fast Line): The %K line compares the current closing price to the high-low range over a set period (default is 14). A %K of 80 means the current price is at the 80th percentile of its 14-period range.
%K = [(Current Close – Lowest Low) / (Highest High – Lowest Low)] x 100
The %D Line (Slow Line): The %D line is a smoothed version of %K, acting as a signal line (Usually a 3-period Simple Moving Average).
%D = 3-period Simple Moving Average of the %K Line
2.2. Fast, Slow, and Full Stochastic
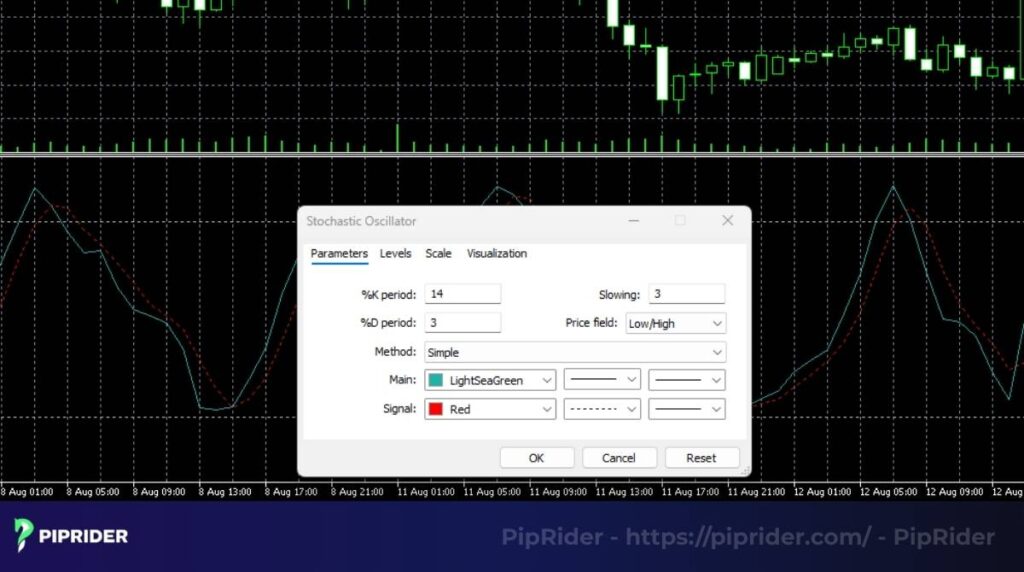
Most modern platforms use the Full Stochastic, which allows for three parameters (e.g., 14, 3, 3):
- Period (14): The look-back period for calculating the raw %K.
- Slowing (3): The first smoothing factor. If this is set to 1, you have a Fast Stochastic. If set to 3, it creates the Slow Stochastic by smoothing the raw %K before %D is even calculated.
- %D Smoothing (3): The final smoothing factor applied to create the signal line.
2.3. Practical Example
Assume the following for a 14-day period:
- Highest high: $150, Lowest low: $100, Current close: $145
- Step 1: Calculate raw %K:
- Step 2: The %D value would then be the average of the last three %K values (e.g., 90, 88, and 85), resulting in 87
3. Mastering the Primary Signals
Once you understand the mathematical structure of %K and %D, the next step is to translate these numbers into actionable trading decisions. Stochastic signals are more than just intersecting lines; they reflect the market psychology between buyers and sellers as they approach limit zones. Below are the three primary ways professional traders interpret market sentiment through the Stochastic.
3.1. Overbought And Oversold Zones
Overbought and oversold zones is the most basic function of the Stochastic. The indicator uses two key thresholds to define market extremes:
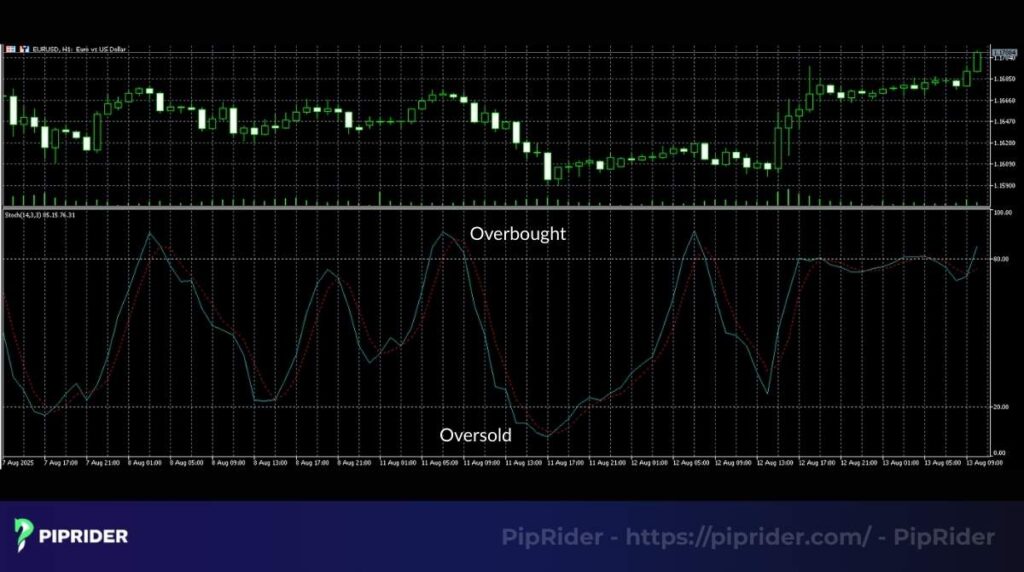
- Overbought (>80): Price is closing near the ceiling of its range. Momentum may be overstretched, but in a strong bull market, the Stochastic can “ride” the 80 level for a long time.
- Oversold (<20): Price is near the floor of its range. This suggests exhaustion among sellers.
3.2. Crossovers
- Bullish crossover: Occurs when %K crosses above %D. This indicates a shift toward upward momentum.
- Bearish crossover: Occurs when %K crosses below %D. This indicates a shift toward downward momentum. Strategic Tip: Crossovers are most powerful when they happen inside the 20/80 extreme zones.
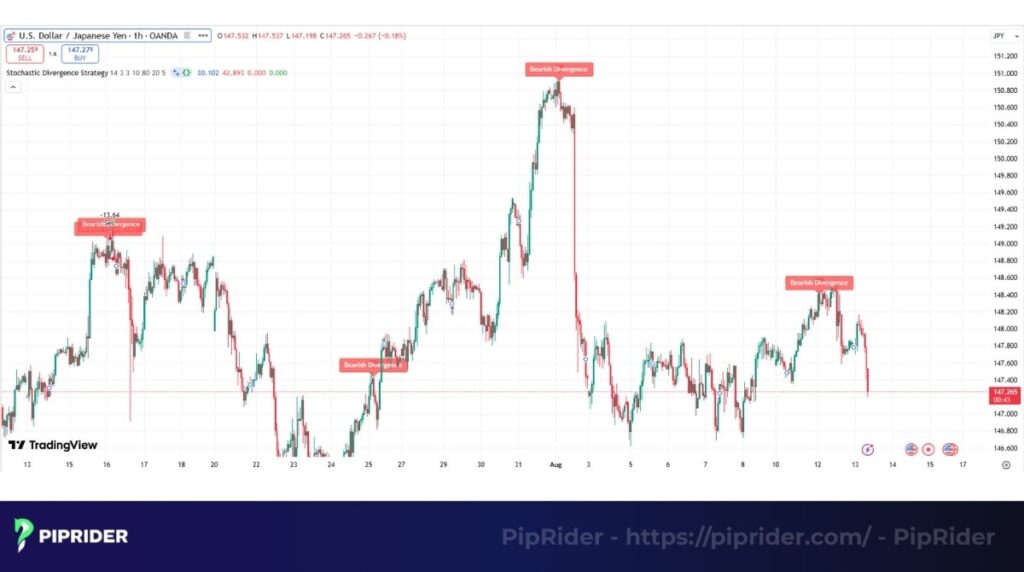
3.3. Divergence: The Warning Sign
- Regular divergence: If price makes a higher high but the Stochastic makes a lower high, it signals Bearish Divergence (reversal warning).
- Hidden divergence: If price makes a higher low in an uptrend but the Stochastic makes a lower low, it signals Trend Continuation.
4. Optimized Settings and Asset Classes
While “14, 3, 3” is the industry standard, professional traders often tweak these to match market volatility.
- The first number (14) represents the look-back period for the %K line.
- The second number (3) is the period used for the simple moving average that creates the slower %D line.
- The third number (3) is the slowing period. This applies an extra layer of smoothing, which is why “Slow Stochastic” is often the default. A setting of 1 here would create the fast stochastic.
| Style | Setting | Responsiveness | Primary use |
| Scalping | 5, 3, 3 | Very Fast | High-frequency trades on M1 or M5 charts |
| Swing trading | 14, 3, 3 | Balanced | The “Golden Standard” for H1, H4, and Daily |
| Position trading | 21, 5, 5 | Smooth | Long-term trend filtering on Weekly charts |
Recommendations by Asset:
- Scalping (M1, M5): Start with 5, 3, 3. This setup requires the indicator to be as responsive as possible, but it must be combined with strong price action skills to filter the noise.
- Day and Swing trading (M15, H1, H4): The default 14, 3, 3 is the industry standard for a reason. For these particular styles, it offers the most dependable signals.
- Position Trading (Daily, Weekly): Use a slower setting like 21, 5, 5 to focus only on the most significant, long-term market cycles.
When it comes to different assets:
- For forex trading, the standard 14, 3, 3 setting performs very effectively on both major and minor pairs across different trading sessions.
- Stocks: Use 21, 5, 5 to avoid “whipsaws” caused by daily gaps and earnings volatility.
- Crypto: Use 8, 3, 3 or 5, 3, 3. The parabolic nature of Bitcoin often requires faster settings to catch entries before the move is over.
5. Backtesting The Stochastic Oscillator
A strategy is nothing more than a hypothesis until it is tested against historical price history. From our experience, the process of backtesting is what transforms a trader from someone who thinks they have a good idea into someone who knows they have a statistical edge. Let’s walk through a basic backtest of a simple Stochastic strategy to see how it’s done.
5.1. The Backtesting Setup: Timeframe And Data
To run a meaningful test, the parameters must be clearly defined.
- The asset: Use EUR/USD, as it’s a highly liquid pair with predictable behavior.
- The timeframe: Use the 4-hour (H4) chart. This is a popular timeframe for swing trading that filters out a lot of the daily noise.
- The data period: The strategy will be tested on a full year of historical data, from January 1, 2023, to December 31, 2023 to cover different market conditions. This allows us to observe how the moving average performs across various cycles.
5.2. Analyzing The Results
After running the simulation over the entire year of data, the platform would generate a performance report. This is where traders look at the raw, unbiased numbers.
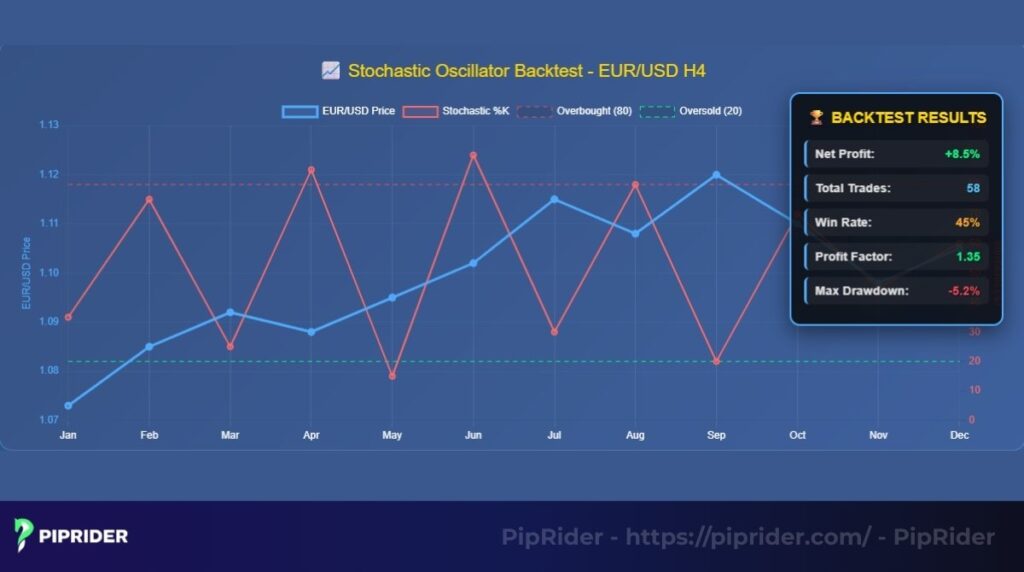
A hypothetical result:
- Net profit: +8.5%
- Total trades: 58
- Percent profitable: 45%
- Profit factor: 1.35
- Max drawdown: -5.2%
Interpretation: At first glance, a win rate of 45% might seem poor. However, this is typical of many successful mean-reversion systems. With a risk-to-reward ratio of 1:1.5, the winning trades are larger than the losing ones, resulting in a positive “expectancy” per trade.
As detailed in Dr. Van K. Tharp’s classic book, Trade Your Way to Financial Freedom, a positive expectancy is the statistical foundation of any profitable trading system (Tharp, 1999). The acceptable max drawdown of 5.2% further reinforces that this simple strategy had a positive historical edge.
5.3. Adjusting Parameters And Re-Testing
The final step is optimization. What happens if the settings are changed? The same test could be re-run with a faster Stochastic Oscillator(e.g., 8, 3, 3) or a slower one (e.g., 21, 5, 5). The goal is to see if the results can be improved, perhaps by increasing the profit factor or reducing the drawdown. This cycle of testing, analyzing, and refining is fundamental to building a solid trading strategy.
6. 4 Master Stochastic Strategies
An indicator’s signals are only useful when they are part of a complete strategy. A strategy provides a disciplined framework that tells a trader not just when to enter, but also how to manage the trade. Let’s explore several powerful ways to build a Stochastic Oscillator strategy.
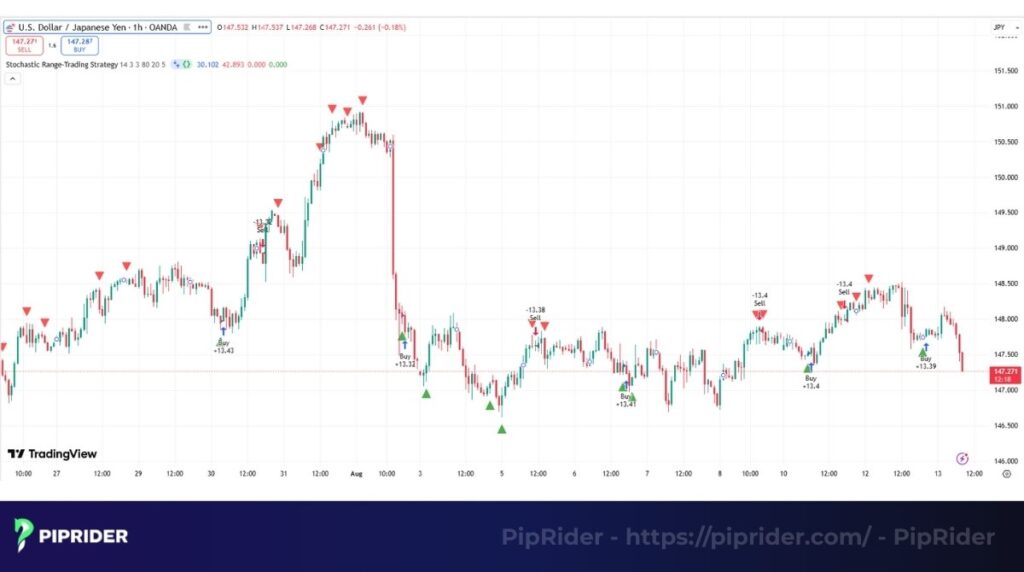
6.1. Strategy 1: The Range-Bound “Box” Reversal
Ideal for sideways markets where price bounces between horizontal support and resistance. Using a long-term moving average (like the 100 EMA) to define the primary trend.
The rules:
- Identify the range: Confirm the market is moving sideways (e.g., flat 200 EMA).
- The setup: Price must touch the Support (for Buy) or Resistance (for Sell).
- The trigger:
- Buy: Stoch < 20, followed by a Bullish Crossover.
- Sell: Stoch > 80, followed by a Bearish Crossover.
- Trade management:
- Stop loss: Just outside the range level.
- Take profit: Opposite side of the range or the 50% midpoint.
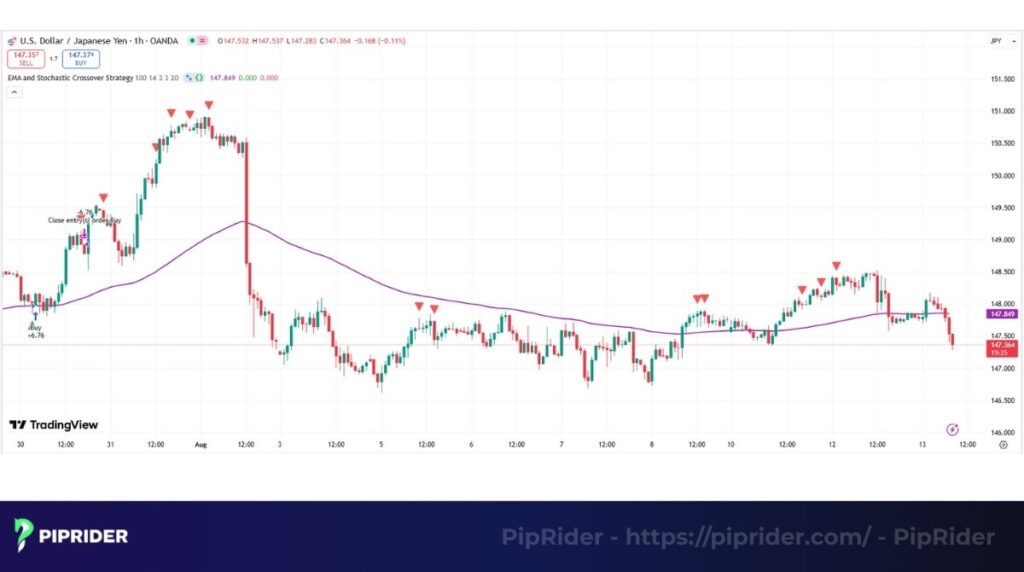
6.2. Strategy 2: The Trend Pullback (The “Dip Buyer”)
Never trade against a strong trend. This strategy uses Stochastic to time the end of a “correction”.
The rules:
- Trend filter: Add a 100-period EMA. If price > 100 EMA, trend is UP.
- The setup: Wait for a price pullback until the Stochastic drops into the Oversold (<20) zone.
- The trigger: Enter a Buy position as soon as the %K crosses back above %D.
- Trade management:
- Stop loss: Below the recent swing low.
- Take profit: 1:2 Risk-to-Reward ratio or the recent trend high.
6.3. Strategy 3: The Divergence Disagreement
This strategy relies on the mismatch between price action and momentum to predict major reversals.
The rules:
- Spot the mismatch: Price makes a new Higher High, but Stochastic makes a Lower High (Bearish Divergence).
- The confirmation: Wait for the Stochastic lines to exit the Overbought (>80) zone.
- The trigger: Enter a Sell trade when a bearish price action candle (like a Shooting Star or Engulfing) forms.
- Trade management:
- Stop loss: Above the recent price peak.
- Take profit: The next major support level on a higher timeframe.
6.4. Strategy 4: The 50-Line Momentum Breakout
Treats the 50-level as the “line in the sand” between bullish and bearish control.
The rules:
- Context: Price is breaking out of a tight consolidation range.
- The trigger: Stochastic crosses from below 50 to above 50 (for Buy) or vice versa.
- Volume confirmation: The candle causing the 50-line cross must have higher-than-average volume.
- Trade management: If Stochastic immediately crosses back across the 50-line, exit the trade.
7. Stochastic Oscillator vs. Stochastic RSI (StochRSI)
Traders often confuse these two due to their names, but they operate on different data layers:
- Stochastic Oscillator (The Original):
- Core: Measures the position of the Price relative to its high-low range.
- Characteristics: Moves more smoothly and produces fewer “false” signals. It directly reflects price behavior.
- Use Case: Best for identifying reversals on higher timeframes or in trending markets.
- Stochastic RSI (The Indicator of an Indicator):
- Core: Applies the Stochastic formula to the values of the RSI indicator instead of the price.
- Characteristics: Extremely sensitive and volatile. It oscillates from 0 to 100 much faster than the standard version.
- Use Case: Ideal for short-term scalpers looking for rapid entries in micro-movements.
Verdict: If you are a beginner, stick to the Standard Stochastic Oscillator. StochRSI often leads to “signal overload” and over-trading for those not yet skilled in price action filtering.
8. How to Setup Stochastic on TradingView
Follow these steps to configure the Stochastic Oscillator professionally on the TradingView platform:
- Open Your Chart: Go to TradingView and load your preferred asset.
- Add the Indicator:
- Click the “Indicators” button on the top toolbar.
- Search for “Stochastic” and select the built-in version provided by TradingView.
- Configure Inputs:
- Click the Gear icon (Settings) next to the indicator name.
- %K Length: Set to 14.
- %D Smoothing: Set to 3.
- %K Smoothing (Slowing): Set to 3 (This creates the “Slow Stochastic” which is more reliable).
- Customize Style:
- Navigate to the Style tab.
- Upper Band: Set to 80 (Use Red for visual association with selling/overbought).
- Lower Band: Set to 20 (Use Green for visual association with buying/oversold).
- Background: You may add a light fill to the 20-80 area to highlight when the lines exit the “normal” range.
- Save and Apply: Click OK. You can also select “Save as Default” to ensure every new chart uses these settings automatically.
9. Advantages And Disadvantages Of The Stochastic Oscillator
To use the Stochastic Oscillator effectively, traders must understand its unique “superpowers” and its critical failure points.
| Feature | Detailed advantages | Detailed disadvantages |
|---|---|---|
| Market context | Superior in ranging markets: This is its primary strength. It excels at identifying turning points at the edges of a sideways range where other indicators fail. | Ineffective in parabolic trends: In a powerful “runaway” trend, the indicator can stay overbought for weeks, generating multiple false sell signals. |
| Signal timing | Early warning system: Because it measures momentum rather than price, it often provides a signal before the price reversal is obvious on the chart. | Whipsaws & Noise: Its high sensitivity, especially on faster settings (5,3,3), can lead to many “false crosses” that don’t result in price moves. |
| Objectivity | Rule-based decision making: The clear 80/20 zones and %K/%D crossovers provide objective, non-discretionary entry and exit signals. | Encourages over-trading: The sheer frequency of signals on lower timeframes can lead traders to take too many low-quality positions. |
| Versatility | Cross-asset utility: The underlying logic of measuring closing price relative to a range works universally across Forex, Stocks, and Crypto. | Requires heavy filtering: It cannot be traded in isolation. It must be paired with price action or trend filters (like EMA) to be profitable. |
10. Frequently Asked Questions (FAQs)
Here are some quick, no-nonsense answers to the questions traders ask most frequently about the Stochastic Oscillator.
11. Conclusion
The Stochastic Oscillator has earned its reputation by mastering the art of the reversal. Unlike trend-following tools, this indicator is a finely tuned instrument for measuring momentum, identifying when price movement is running out of steam.
Its true power is unlocked by embracing its niche: finding high-probability turning points in ranging markets and pinpointing precise “buy the dip” opportunities.This guide has provided the blueprint. The final step is to add this classic indicator to your charts and test the Stochastic Oscillator strategies we’ve discussed.
To continue this journey, explore more advanced guides in our best technical indicators category right here on Piprider.


