
Years ago, I sat staring at my trading screen, heart racing as I tried to guess where the market was headed. Trends seemed like waves in a stormy sea unpredictable and overwhelming. Then I stumbled upon the DMI indicator, and it felt like finding a compass in the chaos.
The DMI indicator, or Directional Movement Index, is a tool that helps traders like you and me spot trends and gauge their strength. It’s not about predicting the future but understanding the market’s rhythm. Whether you’re new to Forex or sharpening your skills, this guide will walk you through what the DMI indicator is, how it works, and how to use it to trade with confidence.
In this article, I’ll share practical tips from my own trading experience, break down the DMI’s components, and show you how to read its signals. By the end, you’ll know how to apply this tool to your strategy and avoid common pitfalls. Ready to dive in and make sense of market trends? Let’s get started.
Key Takeaways
- DMI uses +DI and -DI lines to show whether buyers (+DI > -DI) or sellers (-DI > +DI) are driving the market, helping traders spot bullish or bearish trends.
- The ADX line indicates how strong a trend is above 25 signals a robust trend, below 20 suggests weak or no trend, guiding traders to act or wait.
- By comparing price highs and lows over 14 periods, DMI cuts through noise, offering clear signals for trend-following strategies in Forex pairs like EUR/USD or USD/JPY.
- DMI excels when markets move decisively but struggles in choppy, sideways conditions, where frequent +DI/-DI crossovers can mislead.
- Pairing DMI with tools like moving averages or RSI filters out false signals, aligning trades with market momentum for better decision-making.
1. What is the DMI indicator?
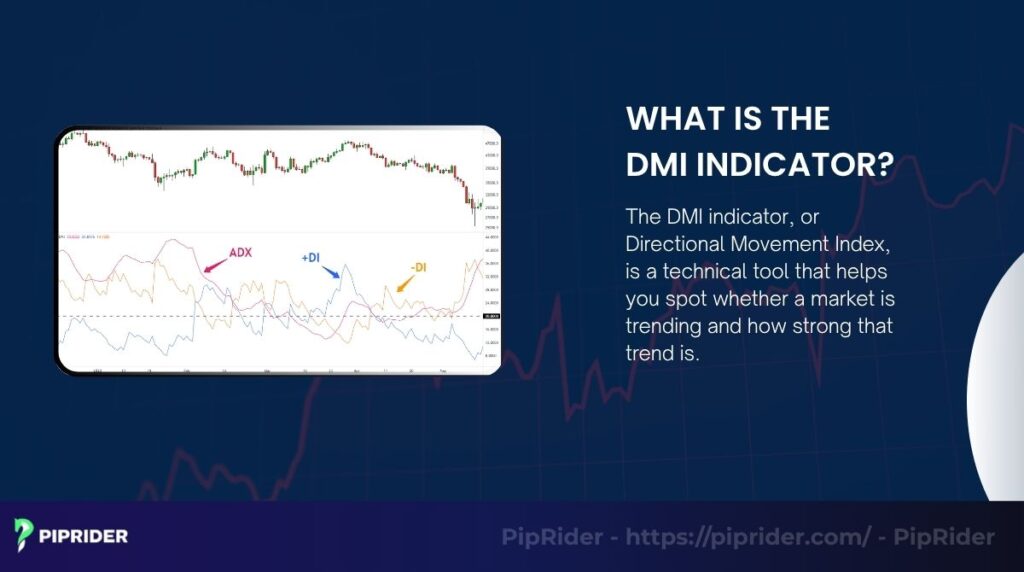
The DMI indicator, or Directional Movement Index, is a technical tool that helps you spot whether a market is trending and how strong that trend is. Created by J. Welles Wilder in 1978, it’s like a guide that cuts through market noise. Instead of guessing price moves, it focuses on the strength and direction of trends, making it perfect for Forex trading.
The DMI has four parts:
- +DI (Positive Directional Indicator): Shows upward price movement.
- -DI (Negative Directional Indicator): Tracks downward price movement.
- ADX (Average Directional Index): Measures trend strength, regardless of whether the trend is up or down.
Additionally, some advanced platforms also provide the ADXR (Average Directional Movement Index Rating), which is a smoothed version of the ADX, helping to provide a more stable assessment of trend strength.
I’ve found the DMI especially useful on platforms like MT4 for pairs like EUR/USD. It doesn’t predict prices but helps you ride the market’s flow. Think of it as a map for navigating Forex trends.
Summary: The DMI indicator is a powerful tool for identifying trend direction and strength. Its components +DI, -DI, ADX, and ADXR work together to simplify market analysis. Understanding these basics sets you up to use DMI effectively in your trading.
2. How does the DMI indicator work?
When I first used the DMI indicator, I was amazed at how it turned messy price data into clear signals. Understanding its mechanics helped me trust it more. Let’s dive into how this tool actually works in Forex trading.
The DMI indicator measures trend strength and direction by comparing price movements over time, typically 14 periods. It doesn’t just look at closing prices but analyzes highs and lows to capture the market’s true momentum. This makes it a reliable guide for spotting trends in pairs like GBP/USD or USD/JPY.
Here’s a simple breakdown of its process:
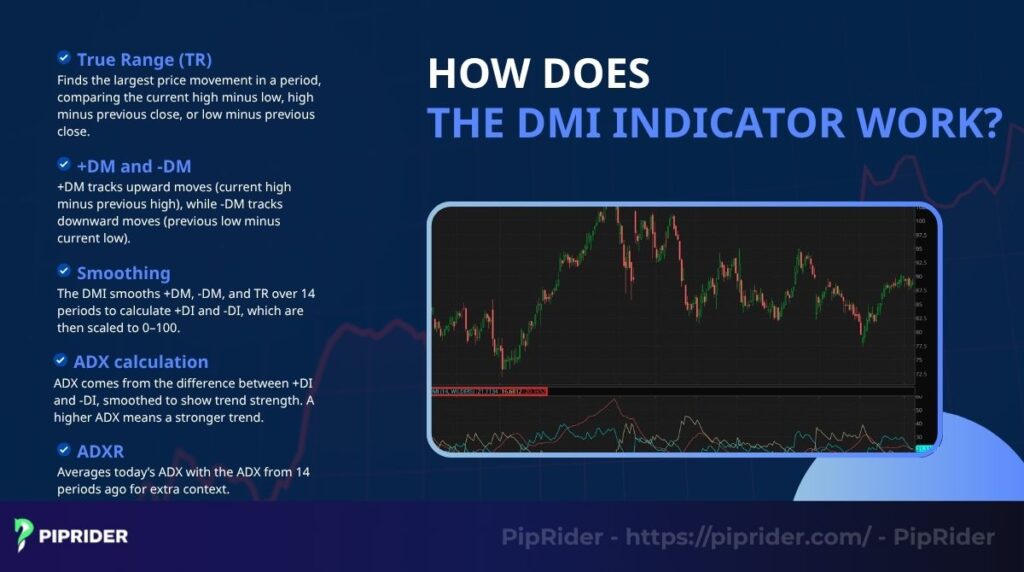
- True Range (TR): Finds the largest price movement in a period, comparing the current high minus low, high minus previous close, or low minus previous close.
- +DM and -DM: +DM tracks upward moves (current high minus previous high), while -DM tracks downward moves (previous low minus current low).
- Smoothing: The DMI smooths +DM, -DM, and TR over 14 periods to calculate +DI and -DI, which are then scaled to 0–100.
- ADX calculation: ADX comes from the difference between +DI and -DI, smoothed to show trend strength. A higher ADX means a stronger trend.
- ADXR: Averages today’s ADX with the ADX from 14 periods ago for extra context.
In trending markets, the DMI shines by highlighting strong moves, but in choppy markets, it may signal caution. I’ve noticed it works best when you pair it with a visual chart, like on TradingView, to see how +DI and -DI interact.
| ADX level | Trend strength |
| Below 20 | Weak or no trend |
| 20–25 | Potential trend forming |
| Above 25 | Strong trend |
Summary: The DMI indicator works by analyzing price highs and lows to calculate +DI, -DI, and ADX, helping traders identify trend direction and strength. Its calculations, though complex, boil down to a clear picture of market momentum, making it a go-to tool for trend trading.
3. DMI indicator formula
To better understand how the DMI indicator works, let’s take a closer look at its core formulas:
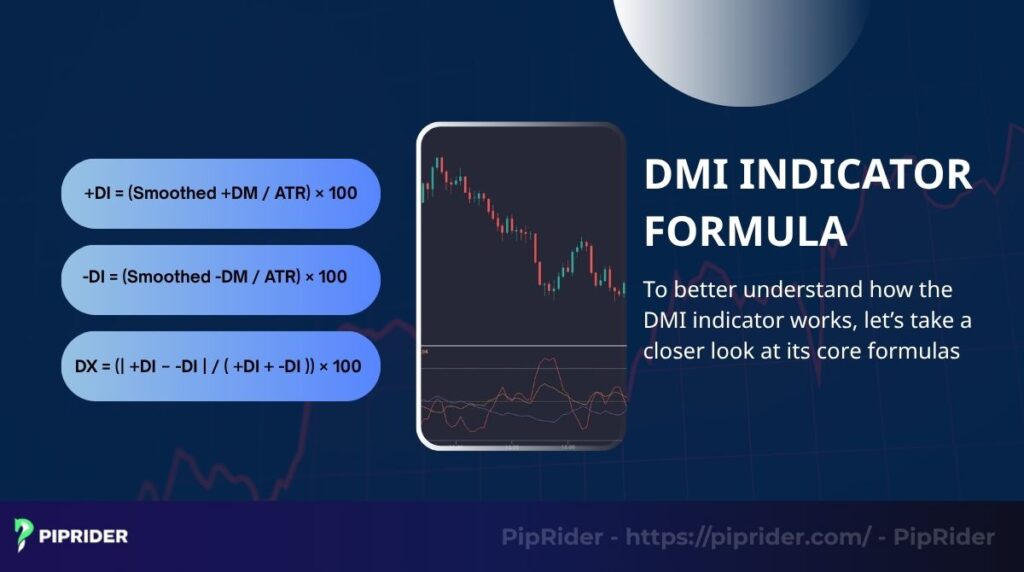
+DI = (Smoothed +DM / ATR) × 100
-DI = (Smoothed -DM / ATR) × 100
DX = (| +DI − -DI | / ( +DI + -DI )) × 100
Component breakdown:
- +DM (Positive Directional Movement) = Current High − Previous High
Measures bullish price movement. - −DM (Negative Directional Movement) = Previous Low − Current Low
Measures bearish price movement. - ATR (Average True Range): Calculates the average volatility over 14 periods.
- Smoothed +DM / -DM: A moving average of +DM or -DM over 14 periods, calculated as: Smoothed +DM = Σ(DM of first 14 periods) − (Average DM of 14 periods) + Current DM
Simple explanation:
- +DI and -DI are two lines that reflect buyer and seller strength.
- ADX (Average Directional Index), which is derived from DX, shows the strength of the trend without indicating its direction.
- When +DI > -DI, buyers are in control (bullish trend). When -DI > +DI, sellers dominate (bearish trend).
- A rising ADX signals a strong trend, whether upward or downward.
4. How to read the DMI indicator
I still remember the first time I stared at the DMI indicator; those tangled lines of +DI, -DI, and ADX felt like some kind of cryptic language. My heart raced a little, not from excitement, but from the anxiety of not knowing what they meant. But once I cracked the code, something shifted. Suddenly, I wasn’t just reacting to the market, I was understanding it. And that changed everything.
The DMI indicator isn’t just another tool, it’s like listening in on a quiet conversation between bulls and bears. It tells you not just where the market might go, but how strong that move might be. When you learn to read it, you stop second-guessing yourself. You trade with a bit more clarity, and a lot more calm.
Here’s how I and many traders read the DMI:
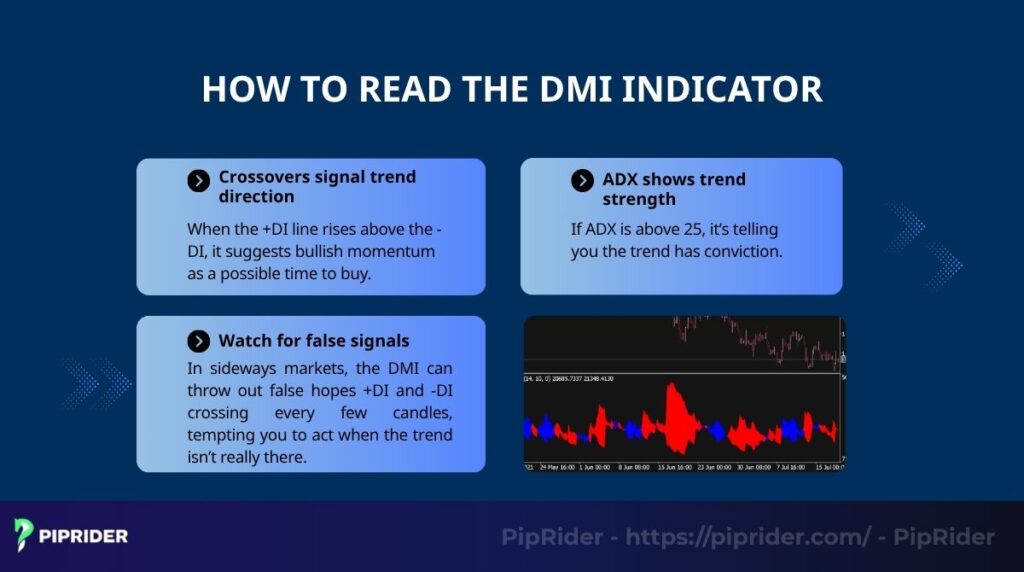
4.1. Crossovers signal trend direction
When the +DI line rises above the -DI, it suggests bullish momentum as a possible time to buy. It feels like the market is finally tilting in your favor. On the other hand, when -DI crosses above +DI, bearish pressure could be taking over.
That’s your cue to step back or consider a short. These crossovers are like little whispers from the market, guiding you if you’re paying attention.
4.2. ADX shows trend strength
If ADX is above 25, it’s telling you the trend has conviction. It’s like the market raising its voice: “I mean this move.” That’s when the +DI/-DI crossovers become more meaningful. But if ADX drops below 20, it’s often just noise movements without muscle. Trading during those times can feel like chasing shadows.
4.3. Watch for false signals
In sideways markets, the DMI can throw out false hopes +DI and -DI crossing every few candles, tempting you to act when the trend isn’t really there. I’ve fallen for these signals before, thinking I’d caught a breakout only to watch it fizzle out. That’s why I’ve learned to glance at ADX first. It’s like asking, “Is the market serious this time?” Most of the time, it saves me from jumping in too soon.
For example, on a 4-hour EUR/USD chart, if +DI crosses above -DI and the ADX is rising above 30, that’s often a green light for me. It’s not just a setup it feels like momentum is building. Tools like MT5 make it easier to visualize, but it’s your instincts, sharpened by experience, that turn signals into strategy.
Summary: Reading the DMI indicator involves tracking +DI and -DI crossovers for trend direction and using ADX to confirm strength. By understanding these signals, you can make smarter trading decisions, but always watch for false signals in range-bound markets.
5. How to use the DMI indicator in forex trading
When I first started using the DMI indicator, I felt a rush of excitement watching trends emerge clearly on my charts. It wasn’t just about catching signals, it was about finally feeling like I had a tool that could guide my decisions instead of leaving me guessing. Trading stopped being a game of chance and became a process I could trust. If you’re ready to build that same kind of confidence, here’s how the DMI can help you make smarter moves in Forex.
The DMI is like a loyal companion for traders who want to ride the waves of strong trends or steer clear of the choppy, confusing waters. When you combine its insights with a solid plan, trading pairs like USD/JPY or GBP/USD suddenly feel less intimidating and more manageable. Let me walk you through practical steps to use it effectively.
5.1. Setting up the DMI indicator
Almost every platform MT4, MT5, TradingView comes with DMI built in. I usually start with the default 14-period setting because it strikes a good balance between noise and signal. But sometimes, especially when scalping, I tweak it down to 10 for quicker signals. Just add it to your chart, and you’ll see the three lines +DI, -DI, and ADX start to tell their story.
5.2. Trading strategies with DMI
Here are two ways I like to use the DMI that have helped me avoid second-guessing and frustration:
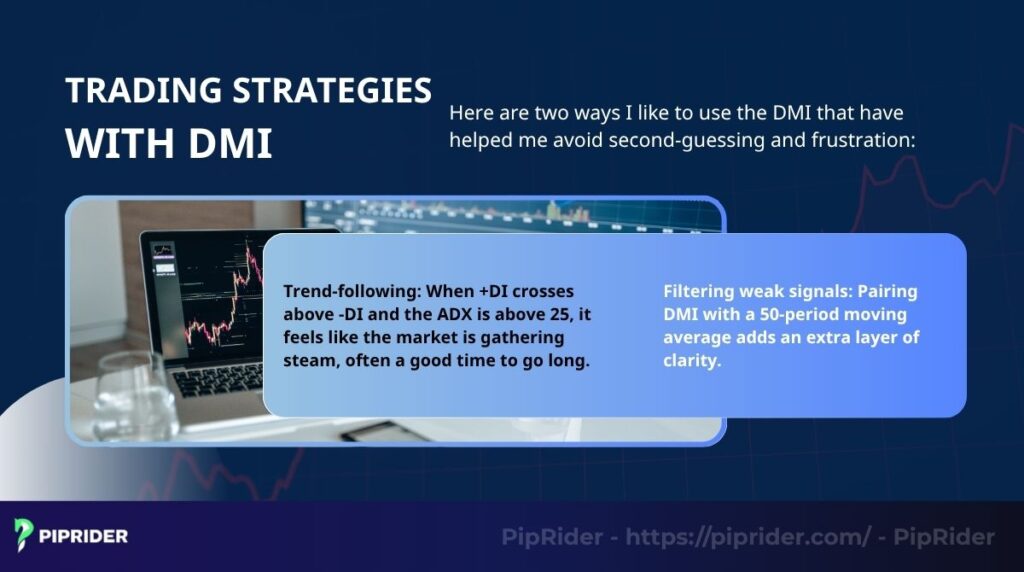
- Trend-following: When +DI crosses above -DI and the ADX is above 25, it feels like the market is gathering steam, often a good time to go long. For sells, wait for the opposite: -DI crossing above +DI with a strong ADX. It’s like catching the market’s momentum right as it starts to build.
- Filtering weak signals: Pairing DMI with a 50-period moving average adds an extra layer of clarity. If the price is above the moving average, I focus on buy signals; if below, I lean into sells. This combo saved me from jumping into false moves that only lead to stress.
5.3. Practical example
Picture trading USD/JPY on a daily chart. When +DI crosses above -DI and ADX hits 28, that’s my cue to enter a long position. I typically place my stop-loss just under the most recent swing low. It’s my safety net, protecting me when the market surprises. Using this approach, I’ve been able to catch solid, steady trends while avoiding the frustration of fake breakouts.
5.4. Risk management tips
Risk management is what keeps you in the game for the long haul. I never trade DMI signals without a stop-loss. Aiming for a 2:1 reward-to-risk ratio gives me peace of mind, knowing I don’t need to win every trade to come out ahead. Also, if the ADX is below 20, I usually sit it out. It’s like the market whispering, “Not today.”
| Platform | DMI setup steps | Best for |
| MT4 | Add DMI via Indicators menu, set period 14 | Swing trading |
| MT5 | Same as MT4, supports multi-timeframe | All styles |
| TradingView | Search DMI, customize colors for clarity | Scalping, day trading |
Summary: Using the DMI in Forex isn’t just a technical step, it’s a journey of learning to read the market’s heartbeat. By setting up the indicator correctly, following simple trend strategies, and respecting risk, you can trade with more confidence and clarity. The DMI helped me cut through noise and hesitation; it can do the same for you.
6. Comparing DMI with other indicators
In the early days of my trading journey, I was overwhelmed by the sea of indicators out there. I’d layer them on charts, hoping one would magically unlock profits, but mostly they just added confusion. It took time and trial to realize that no single indicator is perfect and finding the right tool means understanding their unique voices. Comparing the DMI to others opened my eyes to what it really does best. Let’s dive into how DMI stacks up against some of the most popular tools so you can choose what fits your style.
The DMI stands out for revealing trend direction and strength like a compass pointing you toward where the market’s energy lies. Other indicators tell different stories, giving you complementary insights. Knowing these differences can transform your strategy from guesswork to confident decision-making.
6.1. DMI vs. MACD
DMI is like a reliable tracker of trends through +DI, -DI, and ADX, telling you not just where the market is going but how strongly. MACD, on the other hand, feels more like a momentum gauge, picking up shifts in speed by comparing moving averages. I’ve learned that when markets are choppy or range-bound, MACD’s momentum clues can save you from false starts, while DMI shines brightest when a trend is really underway.
6.2. DMI vs. Aroon
Aroon measures time since recent highs and lows to sniff out early trend changes almost like a trader’s sixth sense for reversals. Meanwhile, DMI’s smoothed price data offers a steadier confirmation of trends already in motion. I’ve found myself relying on DMI when I want conviction in a trend, and turning to Aroon when I’m hunting for those critical turning points.
6.3. DMI vs. RSI
RSI gauges overbought or oversold conditions, whispering warnings of potential reversals. DMI, though, is all about trend strength, like the heartbeat of the market’s direction. Pairing them has been a game changer for me: I use DMI to confirm the trend’s power, then watch RSI to time my entries or exits with more precision. It’s like having both a roadmap and a traffic light working together.
6.4 DMI vs. Awesome Oscillator (AO)
The Awesome Oscillator focuses on market momentum by comparing the 5-period and 34-period simple moving averages, offering a fast visual of bullish or bearish momentum changes. DMI, in contrast, uses price highs and lows to detect the direction and strength of a trend. I often find AO more responsive in spotting early momentum shifts, while DMI gives me more confidence in sustained trend conditions. They can work beautifully together, AO for the jumpstart, DMI for the follow-through.
6.5 DMI vs. Bulls/Bears Power
Bulls Power and Bears Power, developed by Dr. Alexander Elder, measure the strength of buyers and sellers by calculating the difference between price highs or lows and an EMA. While DMI gives a broader view of trend direction and its strength, Bulls/Bears Power offer a snapshot of current buying or selling pressure.
I’ve used them in tandem, where DMI outlines the trend and Bulls/Bears Power helps fine-tune my entry based on dominant market force. It’s like seeing the big wave and checking the strength of the current before diving in.
Comparison table:
| Indicator | Purpose | Best use case |
| DMI | Trend direction and strength | Trending markets |
| MACD | Momentum and trend changes | Range-bound markets |
| Aroon | Early trend reversals | Trend transitions |
| RSI | Overbought/oversold levels | Timing entries/exits |
| AO | Momentum shift confirmation | Fast-changing conditions |
| Bulls/Bears | Buyer/seller pressure snapshot | Entry timing refinement |
Summary:
The DMI indicator is a steadfast companion for trend traders, providing clarity and confidence. While MACD zooms in on momentum, Aroon senses early reversals, RSI warns about extremes, AO captures fast momentum shifts, and Bulls/Bears Power reflect short-term pressure DMI keeps you grounded in the bigger picture.
7. Limitations and tips for using the DMI indicator
I’ll be honest when I first started using the DMI indicator, I felt like I’d found the holy grail of trading. Those early wins had me buzzing with excitement, dreaming of consistent profits. But then came the losses, the frustration, and the hard lessons.
The DMI is a fantastic tool, but it’s not a magic wand. Learning its limits the hard way taught me how to use it smarter, and I want to share that with you so you can avoid the same pitfalls. Let’s dive into the DMI’s weaknesses and some practical tips to make it your ally in the wild world of Forex trading.
The DMI indicator can light the way in trending markets, but it’s not flawless. By understanding where it stumbles and applying a few battle-tested strategies, you can sidestep heartbreak and trade with more confidence.
7.1. Limitations of the DMI indicator
No trading tool is flawless, and DMI is no exception. Learning to recognize these limitations hasn’t just made me a better trader, it’s helped me protect both my capital and my confidence.
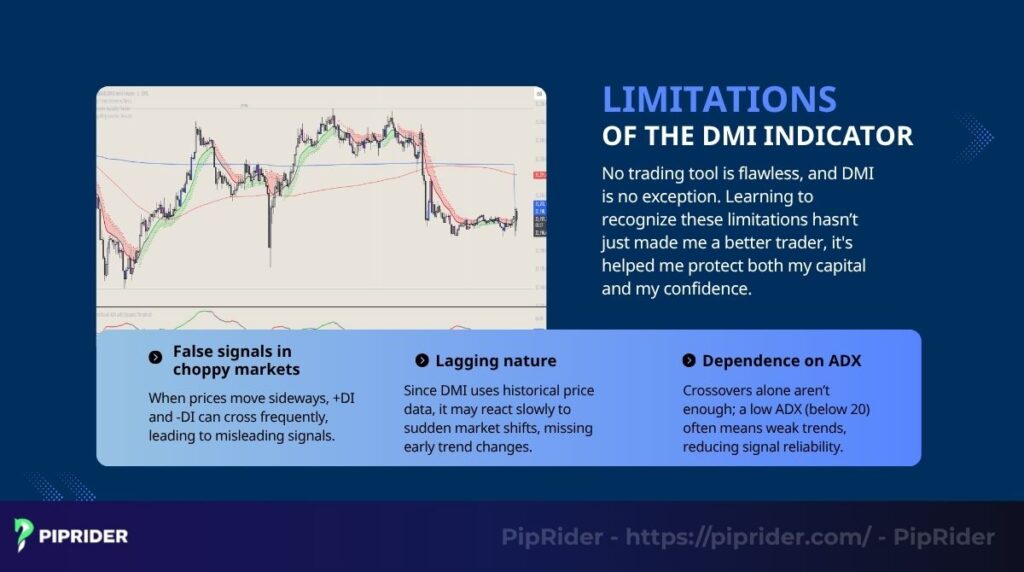
- False signals in choppy markets: When prices move sideways, +DI and -DI can cross frequently, leading to misleading signals. I’ve been caught in these traps before, chasing trades that went nowhere.
- Lagging nature: Since DMI uses historical price data, it may react slowly to sudden market shifts, missing early trend changes.
- Dependence on ADX: Crossovers alone aren’t enough; a low ADX (below 20) often means weak trends, reducing signal reliability.
7.2. Tips to improve DMI reliability
Despite its quirks, I’ve come to love the DMI because it can work wonders when you use it right. After plenty of trial and error and a few sleepless nights analyzing my losses I’ve honed some strategies that filter out the noise and make the DMI shine. These tips aren’t just technical fixes; they’re hard-earned lessons that can help you trade with more clarity and calm.
- Always check ADX: Ensure it’s above 25 before entering any trade. This simple rule has been my lifesaver, keeping me out of shaky trades and preserving my sanity. A strong ADX confirms the trend’s got legs, so you’re not chasing a mirage.
- Use longer timeframes: I used to obsess over 15-minute charts, but the noise was maddening. Switching to 4-hour or daily charts smoothed out the chaos and gave me clearer signals. It’s about zooming out for a clearer perspective, less pressure, smarter decisions.
- Combine with other tools: The DMI is great, but it’s even better with friends. Pairing it with a 50-period moving average or a volume indicator has been a game-changer for me. These tools act like a second opinion, helping you confirm the trend and avoid those gut-punch moments when a trade goes south.
Summary: The DMI indicator can trip you up in sideways markets and lag when you need speed, but don’t let that discourage you. By leaning on the ADX, sticking to longer timeframes, and teaming up with other tools, you can turn the DMI into a trusted partner. These tips aren’t just about avoiding mistakes, they’re about trading with confidence and keeping your emotions in check, so you can focus on the wins that matter.
8. Common questions traders have about the DMI indicator (FAQs)
9. Conclusion: Start mastering trends with the DMI indicator
I’ll never forget the confidence I felt when the DMI indicator first helped me catch a strong trend on USD/JPY. It’s not a magic wand, but it’s a reliable guide for navigating Forex markets. Hopefully, this guide has shown you how the DMI can do the same for you.
The DMI indicator is a powerful tool for spotting trend direction and strength, whether you’re a beginner or a seasoned trader. By understanding its signals, setting it up on platforms like MT4, and pairing it with tools like moving averages, you can make smarter trading decisions. Just remember to watch for false signals in choppy markets and always use risk management.
At Pip Rider, we’re passionate about helping traders grow through practical knowledge. Check out our “Best technical indicators” blog category for more tools like the DMI, or explore our “For Beginner” section for easy-to-follow guides.


