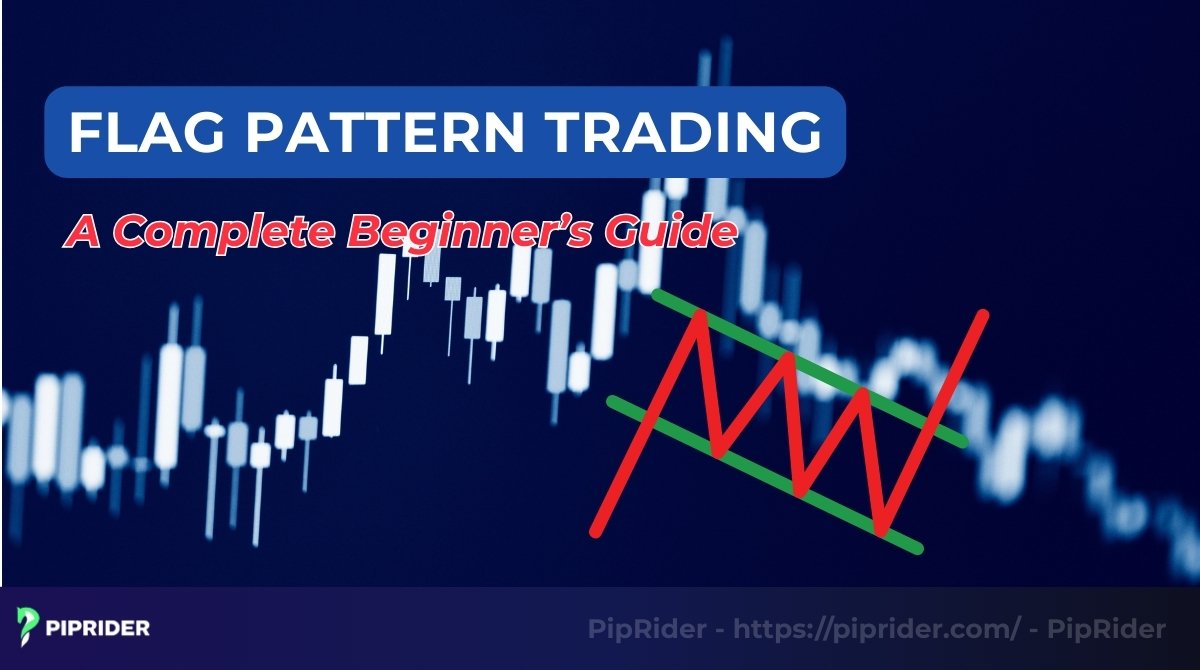
Ever see a strong market trend and feel like you’ve missed the boat, only to watch it pause for a moment before continuing its powerful move? That pause is often a flag pattern. In technical analysis, the flag is a classic continuation pattern that provides a high-probability opportunity to join a trend that’s already in motion. This guide will teach you how to identify it, understand its structure, and execute an effective flag pattern trading strategy.
Key Takeaways
- A flag pattern is a bullish or bearish continuation signal that appears after a strong directional move (up or down)
- It is composed of two parts: the “flagpole” (the initial strong move) and the “flag” (a brief, counter-trend consolidation).
- The primary trading strategy is to enter on a breakout from the “flag” in the direction of the original trend.
- Confirmation from volume is crucial: high on the flagpole and breakout, but low during the flag’s formation.
1. What Is a Flag Pattern in Trading?
A flag pattern is a technical price pattern that indicates a continuation of a previous trend. It is named for its distinct shape, which resembles a flag on a flagpole (Investopedia, 2025).
The flag belongs to the group of continuation patterns. This means it signals a brief pause or consolidation in the market, after which the original trend is expected to resume. It is not a reversal signal.
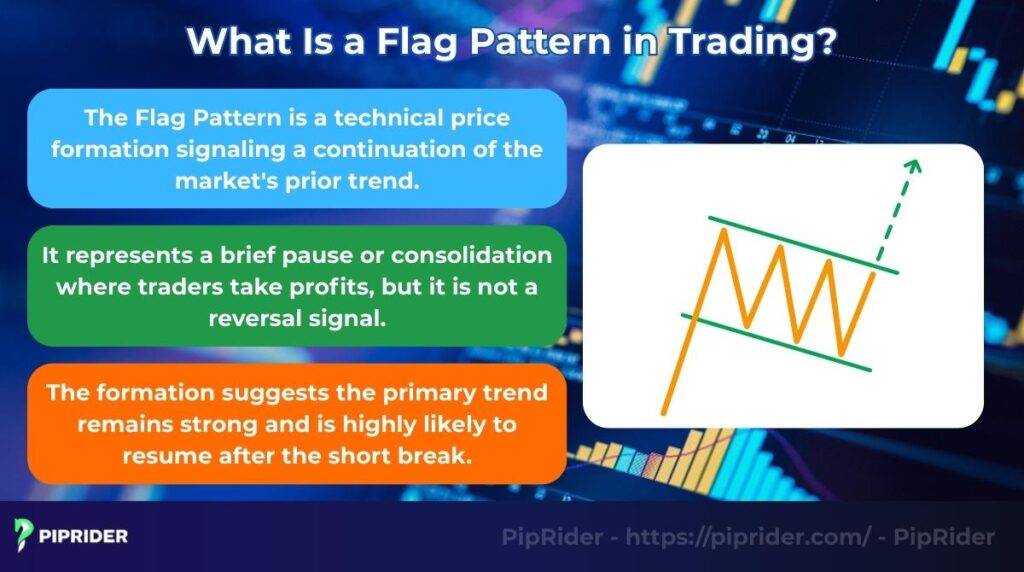
For a new trader, its basic meaning is simple: it represents a “breather” in the market. After a strong price move, the market consolidates briefly as some traders take profits. The flag formation signals that the primary trend is still strong and is likely to continue after this short pause, offering a potential breakout opportunity.
When a Flag Pattern Fails: Structural Invalidation
Recognizing when a continuation setup loses its validity protects practitioners from deploying capital into a reversing market. Several structural failures instantly invalidate the flag premise:
- Excessive Retracement: Prices pulling back more than 50% of the initial flagpole indicate a genuine shift in market sentiment rather than a temporary profit-taking pause.
- Prolonged Consolidation: Time decay destroys the momentum necessary for a continuation breakout. Developing into a lengthy horizontal trading range transforms the flag into a neutral phase of distribution or accumulation.
- Anomalous Volume Expansion: Spiking trading volume during the counter-trend consolidation warns of active institutional absorption or liquidation, contradicting the required low-volume signature of a healthy flag.
2. How Does Flag Pattern Trading Work?
The flag tells a clear story about market dynamics. Understanding the structure and psychology behind it is key to trade effectively.
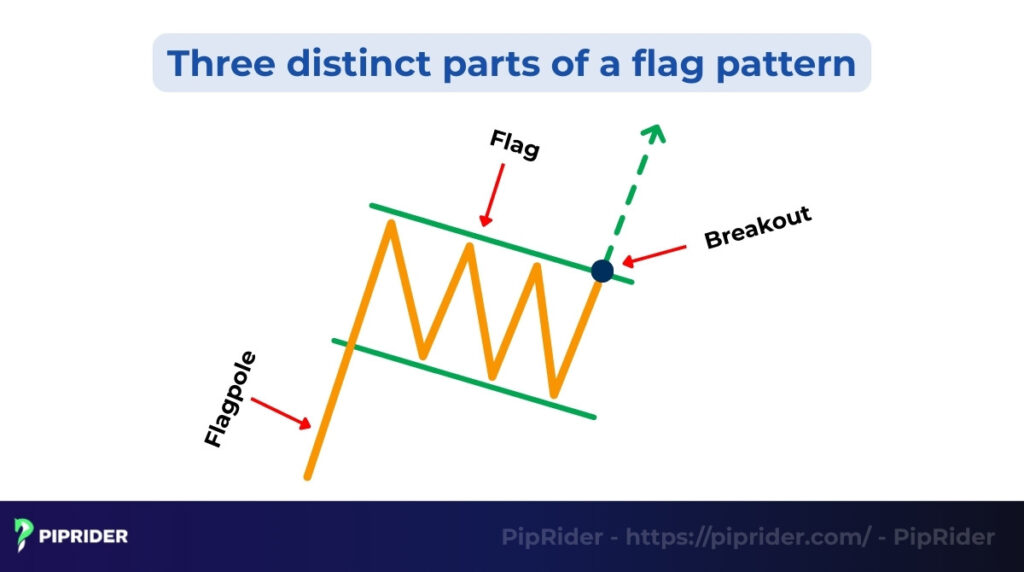
- The Flagpole: A sharp, strong, and near-vertical price move on high trading activity. This forms the initial, powerful trend.
- The Flag: A brief period of consolidation that slopes against the main trend, forming a small, rectangular ‘flag’. Volume should decrease during this phase.
- The Breakout: The price breaks out of the flag’s consolidation in the direction of the original trend, ideally on another surge in volume.
Flag patterns are a hallmark of a strong, healthy trend. They appear because the market is so one-sided that the opposing side lacks the strength to create a deep pullback or reversal. The flag is simply the market “catching its breath” before the next powerful move in the same direction.
3. Key Characteristics of Flag Patterns
To distinguish a valid flag pattern from random market noise, traders look for a specific set of characteristics. These features help confirm the pattern’s reliability.
3.1. Shape and Proportions
The flagpole should be a sharp, strong price move. The flag itself should be a tight, rectangular consolidation that slopes against the main trend (e.g., a downward slope in an uptrend).
A key rule is that the flag should not retrace more than 50% of the flagpole length (Bulkowski, 2021; Investopedia, 2025); retracement deeper than this threshold structurally invalidates the continuation setup.
3.2. The Classic Volume Behavior
Volume provides critical confirmation. A valid flag pattern typically has this signature:
- High Vol on the Flagpole: The initial strong move should occur on high, above-average volume.
- Low Vol on the Flag: Volume should decrease significantly as the flag forms.
- High Vol on the Breakout: The breakout from the flag should occur on another strong surge in volume.
Within this low-volume consolidation, look for weak candlestick formations. A thrusting pattern appearing here, where price tries but fails to penetrate deeply into the previous session’s range, confirms that the counter-trend move lacks true conviction.
The Golden Rules of Flag Patterns (Summary Box)
To quickly filter high-probability setups from market noise, professional traders adhere strictly to the following structural rules. This framework invalidates weak patterns before capital is deployed.
| Rule Category | Strict Condition | Institutional Rationale |
|---|---|---|
| Retracement Rule | Must strictly be ≤ 50% of the flagpole length. | A deeper pullback indicates genuine selling pressure rather than a simple profit-taking pause. |
| Volume Rule | High (Pole) → Low (Flag) → High (Breakout). | Validates dominant market participation during the trend and a lack of conviction during the consolidation. |
| Breakout Candle Rule | The candle must close decisively outside the flag channel. | Long wicks piercing the boundary without closing outside often signal a false breakout or liquidity grab. |
| Invalidation Conditions | Price breaks the opposite boundary of the flag or volume spikes inside the flag. | Proves the counter-trend force has overwhelmed the primary momentum, destroying the continuation setup. |
3.3. A Quick Identification Checklist for Beginners
Deploying capital requires strict adherence to a systematic validation sequence. Novice practitioners must verify the following structural elements before executing any continuation setup:
- Flagpole Validation: A nearly vertical, high-momentum directional impulse must clearly precede the consolidation phase.
- Channel Trajectory: The consolidation structure must form a tight, well-defined parallel channel sloping counter to the primary trend.
- Retracement Limit: The maximum allowable pullback must strictly remain at or below the 50% level of the initial flagpole length.
- Volume Footprint: Trading activity must demonstrate the classic institutional signature: massive expansion during the pole formation, severe contraction inside the flag, and explosive volume upon the breakout.
- Macro Alignment: The micro-pattern setup must perfectly synchronize with the dominant higher-timeframe market environment.
3.4. Visual Guide: Top 3 Beginner Mistakes
Accelerating the learning curve requires identifying and avoiding amateur pitfalls visually. Professional practitioners train their eyes to instantly recognize these three invalidation structures:
- Mistake 1: The Premature Entry (Impatience). Deploying capital while price action remains trapped inside the parallel channel exposes the trader to unpredictable consolidation chop. Anticipating the breakout before structural confirmation remains the fastest way to deplete an account.
- Mistake 2: The Deep Retracement (Invalidation). Forcing a flag pattern label onto a pullback that retraces strictly more than 50% of the initial flagpole ignores severe underlying weakness. Deep pullbacks represent genuine trend reversals, not temporary profit-taking pauses.
- Mistake 3: The Volume Ignorance (False Breakouts). Executing a breakout trade without confirming a noticeable surge in trading volume invites immediate algorithmic trapping. Low-volume breaches lack institutional backing and frequently result in sharp, painful reversals.
4. Types of Flag Pattern Trading Setups
The flag pattern appears in two primary forms: bullish and bearish, along with some common variations. Understanding these setups is key to applying the strategy correctly.
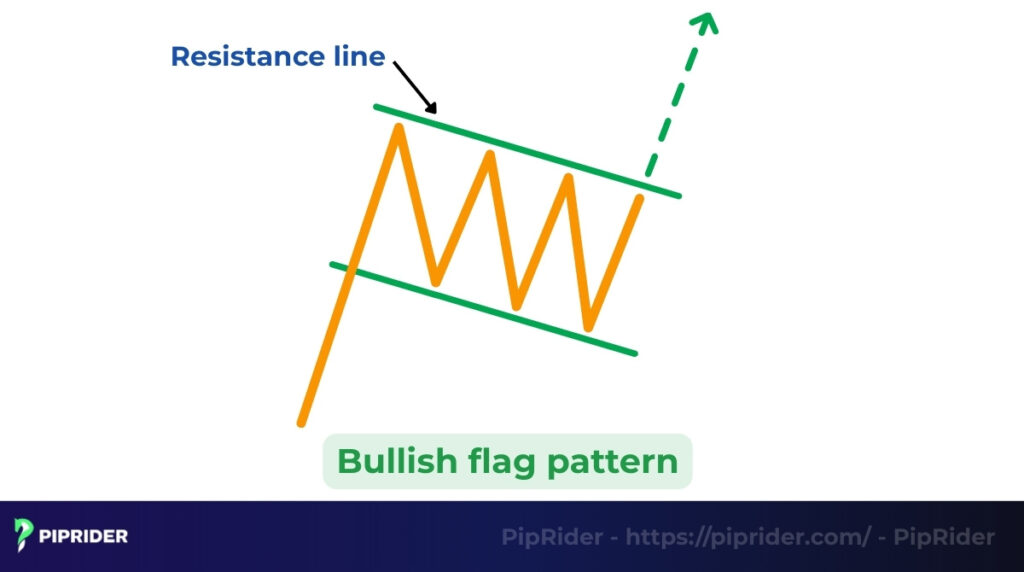
4.1. The Bull Flag
A bull flag is a bullish continuation pattern that forms during a strong uptrend. It is composed of a sharp upward move followed by a brief, downward-sloping consolidation. A breakout above the flag’s resistance is a signal to enter a long (buy) trade.
Example: Imagine a stock rallies sharply from $50 to $60 (the flagpole). It then consolidates by drifting down to $57 in a tight, rectangular channel (the flag). A trader would look for a breakout where the price closes decisively above the top of the flag’s channel to enter a long position.
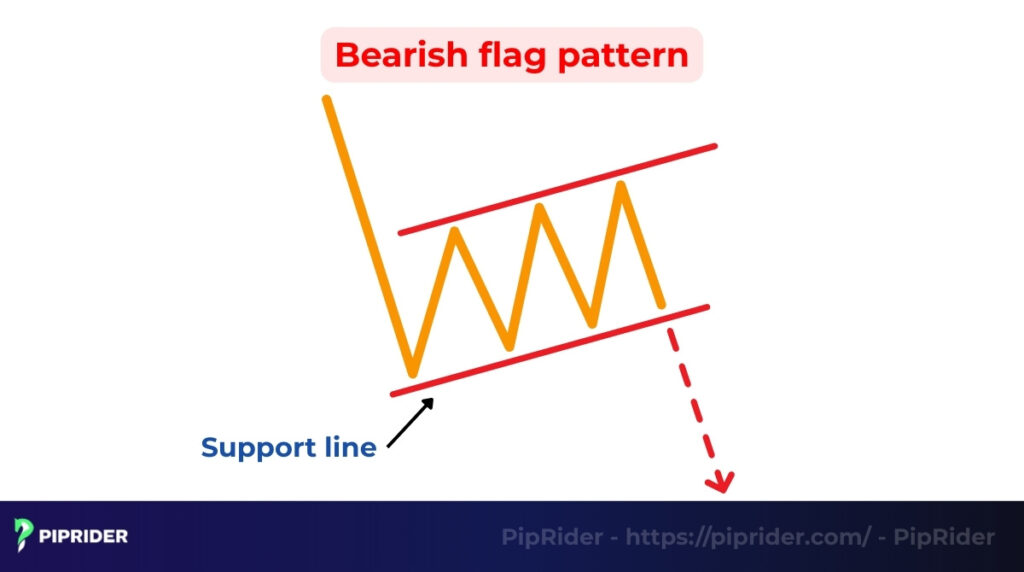
4.2. The Bear Flag
What is a bearish flag pattern and how does it work? A bear flag, a classic example of bearish flag patterns, is a bearish continuation pattern that forms during a strong downtrend. It is composed of a sharp downward move followed by a brief, upward-sloping consolidation. A breakout below the flag’s support signals an entry for a short (sell) trade.
Example: If the EUR/USD currency pair drops sharply from 1.0800 to 1.0700 (the flagpole) and then consolidates in a brief, upward-sloping channel to 1.0740 (the bear flag), a trader would look for a breakout where the price closes decisively below the bottom of the flag’s channel to enter a short position, confirming the bearish sentiment.
Quick Reference: Bull Flag vs. Bear Flag Execution
| Strategic Element | Bull Flag (Long Setup) | Bear Flag (Short Setup) |
|---|---|---|
| Market Context | Established macro uptrend. | Established macro downtrend. |
| Flagpole Direction | Aggressive vertical ascent. | Aggressive vertical decline. |
| Consolidation Slope | Shallow downward trajectory. | Shallow upward trajectory. |
| Execution Trigger (Entry) | Price closing decisively above upper resistance. | Price closing decisively below lower support. |
| Invalidation (Stop Loss) | Placed strictly below the lowest wick of the flag. | Placed strictly above the highest wick of the flag. |
| Measured Move (Target) | Projected upward from the breakout point equaling the flagpole height. | Projected downward from the breakout point equaling the flagpole height. |
4.3. Common Variations
While the classic flag is a rectangle, traders will often see variations in a flag stock chart. The consolidation might be a perfect horizontal channel (often called a “high, tight flag”) or it might be slightly deformed. The key is that the consolidation is brief and shallow relative to the flagpole. A trader should not confuse a flag with a longer, more complex trading range, which is another type of trading pattern.
5. How to Identify Flag Patterns on Charts
Identifying a flag pattern accurately involves more than just seeing the general shape. A professional trader follows a systematic process to validate the pattern, mark its boundaries, and distinguish real breakouts from false ones.
5.1. Drawing Trendlines and Parallel Channels
The “flag” portion of the pattern is defined by two parallel trendlines that create a channel. In a bull flag scenario, a trader should draw a trendline connecting the lower highs of the consolidation with a parallel line connecting its lower lows, forming a downward-sloping channel. For a bear flag, this channel will slope upwards. These lines are critical as they define the exact breakout point and the boundaries of the consolidation.
5.2. Real Breakouts vs. False Breakouts
Distinguishing a genuine structural breach from a manipulative liquidity sweep separates professional execution from retail gambling. A real breakout demonstrates aggressive institutional conviction, whereas a false breakout represents a calculated trap designed to absorb impatient capital.
The Breakout Confirmation Checklist
Validating a true breakout requires the triggering candlestick to pass a rigorous, multi-factor test before any capital is committed. Professional practitioners mandate the following criteria:
- Decisive Structural Close: The candle body must close definitively outside the flag’s parallel channel. Wicks piercing the boundary without a corresponding body close signal immediate invalidation.
- Dominant Body Proportion: The breakout candle should be a “Marubozu” or possess a significantly large real body relative to its wicks (e.g., the body constituting at least 70% of the total candle range), indicating unyielding momentum.
- Relative Range Expansion: The total range (high to low) of the breakout candle must be noticeably larger than the average range of the candles forming the flag consolidation (the Average True Range – ATR should spike).
- Volume Threshold Surge: Trading activity on the breakout candle must clearly exceed the average volume observed during the flag’s formation, ideally spiking above a 20-period volume moving average.
Failure to meet these structural requirements often forces the price action into a deceptive setup known as the hikkake candlestick pattern. Spotting this trap forming at the flag’s boundary provides a critical warning that the initial breach was merely a liquidity grab before a reversal.
Note on the Hikkake Trap: A Hikkake pattern occurs when a breakout initially triggers but fails, with the following candles moving back inside the range and breaking the opposite side. In flag trading, this frequently happens when a breakout candle lacks volume or a decisive close, signaling that institutional players are “hunting” retail stops before resuming the true move.
5.3. Step-by-Step Identification on a Chart
Here is a more detailed, 4-step process for identifying a high-probability setup:
- Identify the Flagpole: First, a trader must identify a sharp, near-vertical price move. This move should be significantly stronger and faster than the preceding price action.
- Draw the Flag’s Channel: Next, identify the brief, orderly consolidation that slopes against the main trend. Use your drawing tools to connect the highs and lows with two parallel trendlines.
- Analyze the Volume: Observe the trading activity during the flag’s formation. It should be noticeably lower than the volume during the flagpole. A decrease in trading action confirms that the consolidation is a healthy pause, not a reversal.
- Wait for the Confirmed: Finally, wait for a strong candle to break and close outside the flag’s channel on a surge of high volume. This is the confirmation that the original trend is resuming.
To objectively verify this explosive momentum, some traders overlay the GMMA indicator. A wide, uniform expansion between the short-term and long-term moving average groups visually confirms the powerful nature of the flagpole.
6. Why the Flag Pattern Is Important
The flag pattern is a crucial tool in technical analysis because it provides a high-probability signal of trend continuation. It represents a healthy, temporary pause in a strong trend, which shows that the market is simply “catching its breath” rather than reversing. For a trader, this is invaluable, as it helps them distinguish between a minor pullback (an opportunity) and a major trend change (a threat), allowing them to stay on the right side of the market’s momentum.
Validating this momentum context is crucial. Tools like the alligator indicator can help ensure you are trading in an active trend phase (when the Alligator is ‘eating’) rather than getting caught in a trendless chop.
Beyond just a directional signal, the pattern’s real importance lies in providing a complete and objective framework for a trade. Its structure gives a trader everything they need to execute a disciplined trade:
- A clear entry triggers at the breakout of the flag.
- A logical and defensible stop-loss location on the opposite side of the flag.
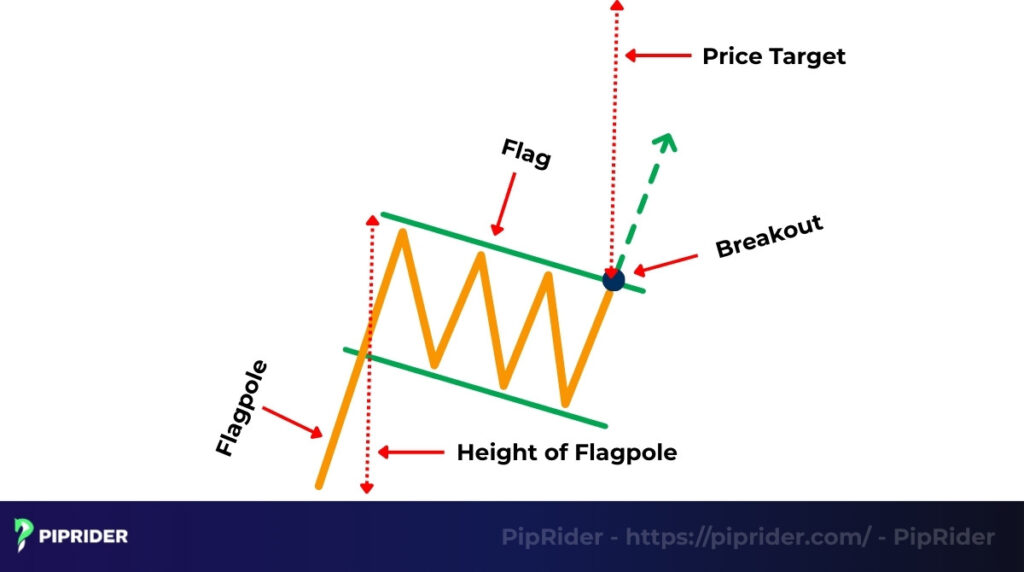
- A data-driven profit target calculated from the height of the flagpole.
This removes guesswork and emotion, turning a potential setup into a systematic and manageable trade plan.
7. Practical Strategies for Flag Pattern Trading
Executing a flag pattern trade involves more than just identifying the setup. Professional traders use specific strategies for entry, exit, and trade management to maximize their edge.
7.1. The Confirmed Breakout Entry Strategy
Executing the standard breakout strategy requires precise timing to capture the resuming momentum without falling into liquidity traps.
- The Execution Trigger: Professional practitioners avoid placing blind stop-entry orders right at the boundary line. Instead, capital deployment occurs strictly after a high-momentum candlestick closes definitively outside the flag’s structural channel.
- The Confirmation Filter: Utilizing the candle-close method, combined with a verifiable surge in trading volume, guarantees that dominant market forces have genuinely reclaimed control. Mandating this structural confirmation protects the trader from premature entries and predatory wick sweeps designed to trap impatient retail capital.
7.2. Breakout vs. Breakout + Retest: Choosing the Right Entry
Professional traders constantly debate whether to enter immediately upon the breakout or wait for a structural retest. Selecting the correct execution style depends entirely on underlying market momentum and the specific asset class being traded.
Approach 1: The Direct Breakout Entry
Executing a trade the exact moment price decisively breaches the flag’s boundary defines the direct breakout approach.
- The Pros: Guarantees participation in the trend. Capturing explosive momentum immediately prevents the trader from missing out on rapid price surges.
- The Cons: High susceptibility to false breakouts (liquidity traps). Entering immediately often requires a wider initial stop-loss to survive normal market volatility.
- Optimal Environment: Highly effective during high-momentum market phases, news-driven events, or in aggressive markets like Cryptocurrency, where powerful trends frequently accelerate without ever offering a pullback.
Approach 2: The Breakout + Retest Entry
Exercising patience to watch the price break out, reverse slightly to touch the broken trendline (now acting as new support or resistance), and confirming a bounce defines the retest strategy.
- The Pros: Drastically reduces the risk of falling victim to false breakouts. Confirming the retest offers a superior risk-to-reward ratio, allowing the placement of a much tighter stop-loss.
- The Cons: Carries a significant risk of missing the trade entirely. Exceptionally strong trends often break out and continue accelerating without ever looking back to retest the boundary.
- Optimal Environment: Ideal for higher timeframes (4-hour, Daily) and methodical markets like Forex or large-cap equities, where structural boundaries are deeply respected by institutional algorithms and pullbacks are common.
7.3. Stop Loss and Take Profit Placement
A complete trade plan requires clear exit points for both a losing and a winning scenario. The flag’s structure provides logical, non-emotional levels for both.
- Stop Loss Placement: Strict risk management requires placing the protective order on the opposite side of the pattern. For a bullish flag, placing the stop just below its lowest channel point establishes a hard exit. For a bearish flag, positioning it just above its highest point defines a clear invalidation level. Mastering these exact placements requires a solid understanding of how to calculate stop loss to protect trading capital effectively.
- Take Profit: The profit target is typically calculated by measuring the height of the flagpole and projecting that same distance from the breakout point. This is known as the “measured move” technique.
7.4. Advanced Trade Management
For larger moves, traders can use advanced management techniques:
- Trailing Stop: Instead of a fixed target, a trailing stop can be used to lock in profits as the price moves in your favor, allowing you to capture a larger portion of the trend.
- Partial Exits: A trader can sell a portion of their position at the first profit target (e.g., a 1:1 extension of the flagpole) and let the rest run, creating a risk-free trade.
Numerical Case Study: Calculating the Risk-to-Reward Matrix
Applying theoretical concepts to a real-world numerical framework ensures professional capital management. Consider a hypothetical bullish flag setup on a major Forex pair (e.g., EUR/USD) to illustrate precise mathematical execution.
- The Flagpole: Price surges aggressively from 1.0500 to 1.0600, establishing a 100-pip directional move.
- The Consolidation: Momentum pauses, forming a downward-sloping channel. Price drifts lower, with the absolute lowest wick terminating at 1.0550.
- The Execution (Entry): A high-momentum bullish candlestick closes decisively outside the upper resistance boundary at 1.0575, triggering the long position.
- The Invalidation (Stop-Loss): Placing the protective order strictly below the lowest consolidation wick establishes a hard exit at 1.0540. Total structural risk equals 35 pips (1.0575 – 1.0540).
- The Measured Move (Take-Profit): Projecting the 100-pip flagpole height upward from the breakout point (1.0575) establishes a systematic target at 1.0675. Total profit potential equals 100 pips.
- The Yield (R:R Ratio): Dividing the 100-pip reward by the 35-pip risk yields a mathematically asymmetric Risk-to-Reward ratio of 1:2.8. Securing setups with a minimum 1:2 ratio remains the cornerstone of long-term institutional profitability.
8. Indicators to Support Flag Pattern Trading
While the flag pattern is a powerful price action signal, its reliability increases significantly when confirmed by other technical indicators. This alignment of signals is known as “confluence” and creates high-probability trading opportunities.
- Volume: This is the most critical indicator for a flag. Volume should be high during the flagpole, decrease during the flag’s consolidation, and surge again when the trend resumes.
- RSI & MACD: These momentum indicators can confirm the trend’s health. During the flag’s consolidation, the RSI should ideally stay above 40 in an uptrend (or below 60 in a downtrend). A strong reading on the MACD also confirms the underlying momentum.
- Moving Averages: A moving average (like the 20 or 50 EMA) can act as a dynamic support or resistance level. A bull flag that forms and holds above a rising moving average is a very high-probability setup.
9. Risks, Common Mistakes, and the Fake Breakout Playbook
Navigating high-probability continuation setups still requires rigorous risk management. Avoiding standard retail traps preserves trading capital for genuine institutional moves.
9.1. The Fake Breakout Playbook: Surviving Liquidity Sweeps
Algorithmic trading models frequently engineer false breakouts to trigger retail stop-loss orders and absorb liquidity before reversing the trend. Neutralizing these predatory maneuvers demands a strict defensive protocol:
- The Retest Mandate: Delaying entry until the price successfully retests the broken flag boundary eliminates exposure to immediate, aggressive reversals. Price action must prove that the old structural resistance has genuinely converted into new support before any risk is assumed.
- Pullback vs. Direct Breakout Execution: Direct breakout entries maximize risk exposure to sudden liquidity grabs. Transitioning to a pullback entry model—deploying capital only after a confirmed higher-low (for bull flags) or lower-high (for bear flags) prints outside the channel—drastically reduces the false-positive rate and confirms actual trend continuation.
9.2. Morphological Misidentification
Confusing a strictly parallel rectangular flag with a converging pennant or a wedge severely distorts measured move calculations. Maintaining precise structural drawing standards ensures accurate take-profit projections and prevents premature trade exits.
9.3. Premature Capital Deployment
Executing trades while price action remains trapped inside the consolidation channel violates the core premise of momentum confirmation. Patience remains the ultimate filter; institutional algorithms ruthlessly punish retail traders who attempt to anticipate the breakout before it actually occurs.
10. Best Timeframes and Markets for Flag Pattern
The flag pattern is a versatile tool, but its reliability can vary depending on the timeframe and market you are trading. Here’s a breakdown of where it works best.
10.1. Optimizing Timeframes by Trading Style
Matching the technical setup to an appropriate timeframe dictates the pattern’s ultimate success rate. Professional operators prioritize specific charts based on their execution style to maximize risk-adjusted returns:
- Swing Trading (Priority: Daily & 4-Hour Charts): Filtering out intraday noise establishes these higher timeframes as the absolute “sweet spot.” Operating on the 4H or 1D charts yields the highest reliability rate, allowing practitioners to safely capture multi-day trend continuations.
- Day Trading (Priority: 1-Hour & 15-Minute Charts): Capturing intraday momentum on intermediate charts provides frequent operational opportunities. However, executing within these windows requires strict volume confirmation to survive false breakouts orchestrated during major session overlaps (e.g., London/New York).
- Scalping (Priority: 5-Minute & 1-Minute Charts): Navigating micro-timeframes severely reduces structural reliability due to rampant algorithmic liquidity sweeps. Deploying capital here demands mandatory top-down analysis; a 5-minute setup must perfectly align with a dominant 4-Hour trend to survive.
10.2. Applying the Flag in Different Markets
The psychology behind the flag pattern is universal, making it effective across all major markets. This is particularly true in strong bullish and bearish trends, which are most common in liquid markets.
- Forex: The candlestick flag pattern is extremely effective, especially on major pairs like EUR/USD and GBP/USD, due to the market’s strong trending nature.
- Stocks: It is a classic pattern for trading a stock flag, particularly for high-volume stocks that are in a strong, established trend.
- Crypto: The pattern works well, but traders must be extremely cautious due to the high volatility. The “flagpole” can be massive, and breakouts can be very aggressive.
11. Real-Life Examples
Let’s look at two real-world examples: one successful trade and one failed trade. Analyzing both is crucial for a complete understanding.
11.1. Case Study: A Successful Bull Flag Trade
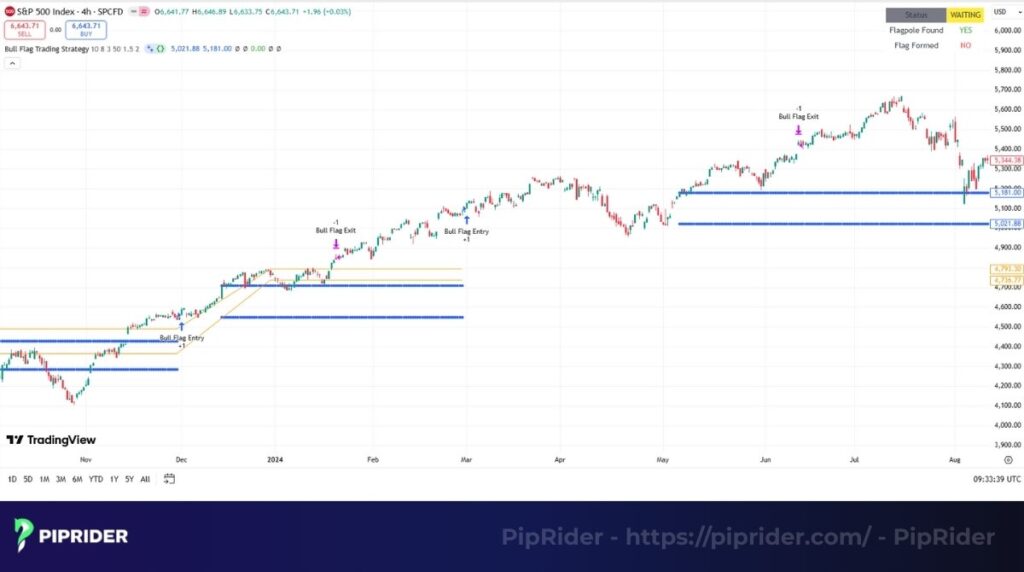
On the 4-hour chart of the S&P 500 (SPX500), the index made a strong upward move. It then formed a clear, downward-sloping bull flag on low volume.
- The Trade: An entry was placed on a breakout above the flag’s resistance, confirmed by a surge in volume. A stop-loss was then positioned below its low, and a profit target was calculated from the flagpole’s height.
- The Outcome: The price continued its strong uptrend and hit the profit target for a successful trade.
11.2. Case Study: A Successful Bear Flag Trade
Analyzing the 4-hour chart of the EUR/USD currency pair during a macro downtrend reveals a textbook bearish continuation setup. A sharp vertical decline driven by institutional selling established a clear flagpole, subsequently followed by a shallow, upward-sloping consolidation forming the flag on visibly contracting volume.
- The Trade: Capital deployment (entering a short position) occurred exactly when a high-momentum bearish candle decisively closed below the lower support channel, accompanied by a prominent spike in trading volume. Protective stop-loss orders rested strictly above the flag’s highest wick to maintain structural invalidation logic.
- The Outcome: Unrelenting supply quickly drove the exchange rate lower immediately after the confirmed breakout. Plunging price action successfully fulfilled the 1:1 measured move target projected from the initial flagpole, securing a highly profitable risk-to-reward ratio.
11.3. Case Study: A Failed Trade and the Lesson
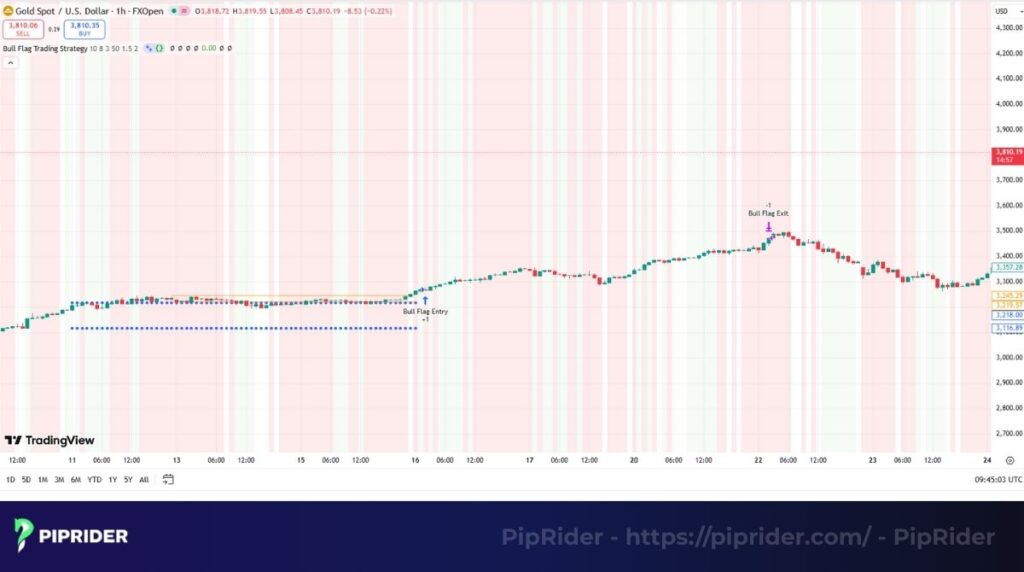
On the 1-hour chart of Gold (XAU/USD), a bear flag appeared to form during a downtrend.
- The Trade: A trader entered a short position on the initial breakout below the flag’s support. However, it occurred on very low volume.
- The Outcome: The price immediately reversed back into the flag and then broke out to the upside, hitting the stop-loss. This is a classic false move.
The Lesson: The key lesson here is the importance of volume confirmation. A breakout without a significant increase in volume is a low-probability signal and should often be avoided.
12. Frequently asked questions about the flag pattern
13. Conclusion: Your 5-Step Operational Action Plan
Mastering the flag pattern marks a significant milestone in a trader’s technical development. While the pattern provides a high-probability framework, long-term success requires transitioning from theoretical recognition to disciplined execution. Use the following professional sequence to deploy capital with precision:
- Step 1: Scan for Dominant Momentum. Identify a high-velocity “flagpole” characterized by large-bodied candles and surging volume. Avoid setups where the preceding trend lacks institutional conviction.
- Step 2: Verify Structural Integrity. Monitor the consolidation to ensure the pullback remains shallow (≤ 50% retracement) and volume noticeably contracts.
- Step 3: Wait for Decisive Confirmation. Exercise patience until a breakout candle closes definitively outside the flag boundary on a significant volume spike.
- Step 4: Calculate Risk-to-Reward Geometry. Define the exact stop-loss (opposite the flag) and project the profit target. Execute only if the reward is at least twice the risk (1:2 R:R).
- Step 5: Execute and Manage with Discipline. Deploy the trade and use trailing stops to lock in gains as the move matures. Never deviate from your pre-defined invalidation points.
Finalizing your strategy on a demo account before risking live capital remains the ultimate safeguard. Consistent profitability is built not on a single trade, but on the systematic repetition of this high-probability process.