
Have you ever felt helpless watching a major forex trend pass you by, just because the chart looked like a chaotic mess? I’ve been in that exact spot, wasting hours only to get shaken out by market noise.
Things only truly changed when I learned how to use the Alligator indicator. It became more than just a tool; it’s the compass that helps me navigate the most unpredictable markets.
Created by Bill Williams, this tool helps traders spot when the market is trending or just drifting sideways, saving you from bad trades. Whether you’re new to forex or sharpening your skills, this guide will show you how to use the Alligator Indicator to trade smarter.
Stick around for practical tips and a free cheat sheet to kickstart your journey!
Key Takeaways
- The Alligator Indicator uses three lines (Jaw, Teeth, Lips) to spot trends and flat markets.
- Learn how to set it up and read buy, sell, hold, and exit signals for forex trades.
- Learn recommended Alligator Indicator settings for day trading, swing trading, and scalping.
- Pair it with tools like RSI or Fractals to confirm signals and avoid false moves.
- Analyze an illustrative EUR/USD trade example to understand how it works in action.
- Explore its strengths, weaknesses, and answers to common questions for confident trading.
1. What is the Alligator Indicator?
Created by Bill Williams in 1995, the Alligator Indicator is much more than a collection of moving averages; it is a comprehensive trend phase model designed to identify and map market cycles. This tool uses three smoothed moving averages to create a visual “anatomy” of the market, helping traders distinguish between profitable trending periods and high-risk sideways action.
Think of the Alligator as a guide that determines the market’s current state. Rather than chasing every price fluctuation, this framework provides a clear narrative of whether the market is resting or preparing for a major move. By understanding the relationship between its three core components, you can align your trades with the most powerful market phases.
- The Anatomy of the Indicator:
- The Jaw (Blue line): A 13-period smoothed moving average, shifted 8 bars forward. This serves as the “balance line” for the long-term timeframe.
- The Teeth (Red line): An 8-period smoothed moving average, shifted 5 bars forward. This represents the intermediate-term balance line.
- The Lips (Green line): A 5-period smoothed moving average, shifted 3 bars forward. This reflects the short-term market momentum.
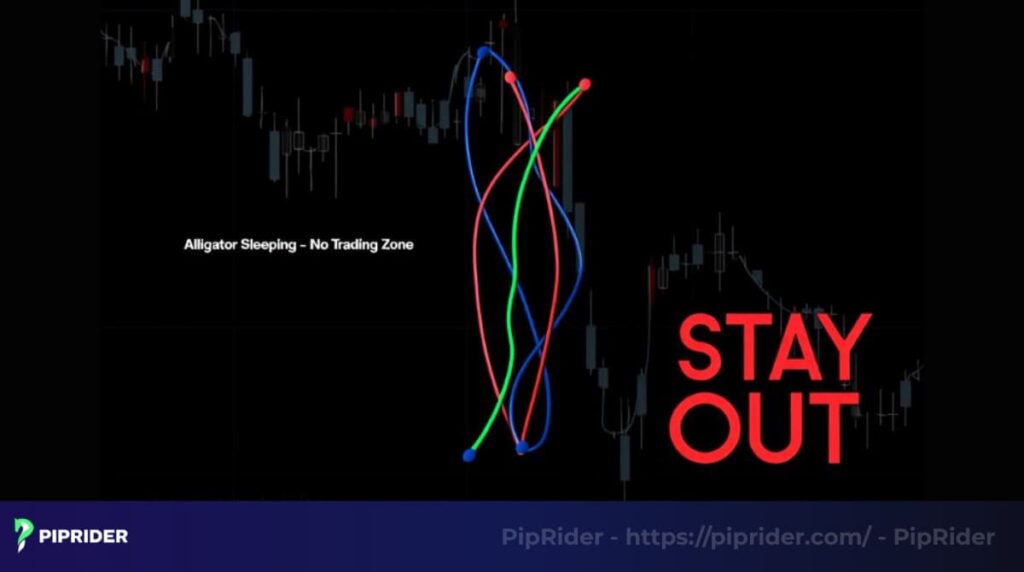
- What it does: The Alligator categorizes market behavior into distinct phases. When the lines are intertwined, the Alligator is “sleeping,” signaling a range-bound market where trading is often risky. When the lines spread apart and move in one direction, the Alligator is “awakening” or “feeding,” signaling the start of a trend phase.
- Why it matters in forex: General market analysis suggests that forex pairs only trend roughly 15% to 30% of the time. The Alligator Indicator is specifically built to help you ignore the majority of market “noise” and focus exclusively on high-probability trending environments.
2. How the Alligator Indicator Defines Market Phases
The core strength of the Alligator Indicator lies in its ability to categorize market cycles into four distinct phases. Bill Williams used the analogy of an alligator’s behavior to represent how price action moves from periods of rest to periods of high activity. Understanding these phases is critical because it tells you not just where the price is going, but when you should be active in the market.
2.1. The Four cycles of the Alligator
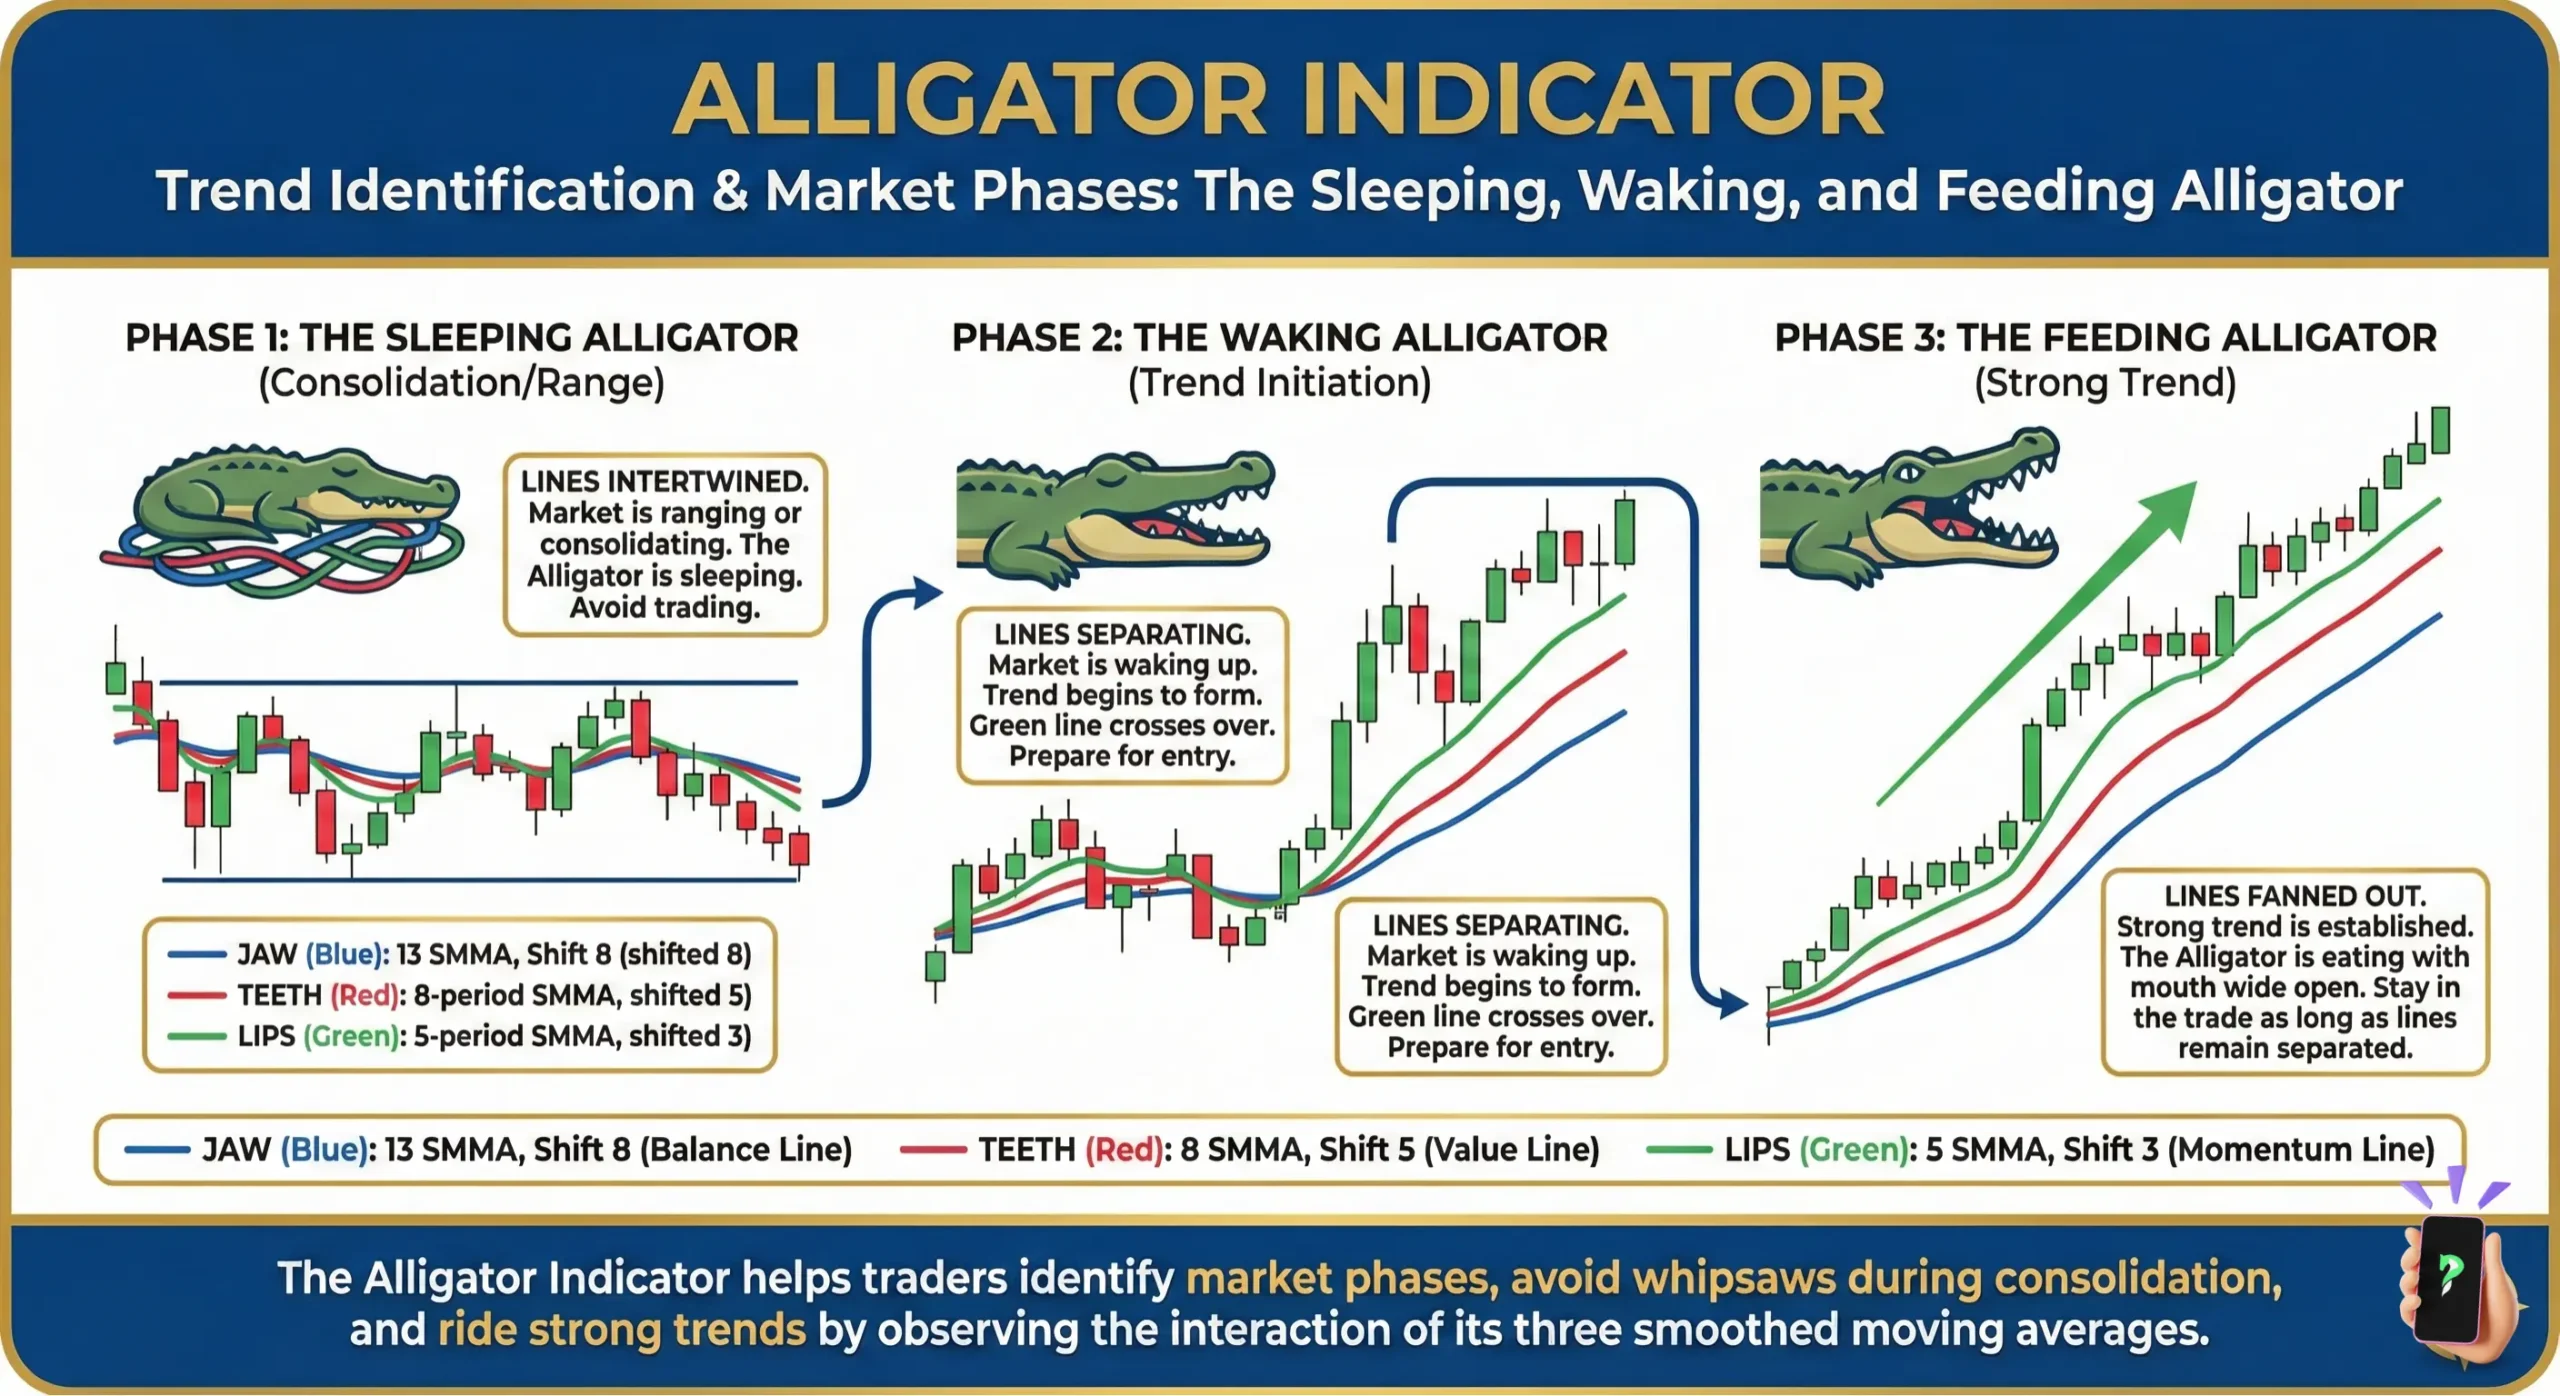
- Sleeping phase (Range/Sideways): During this phase, the Jaw, Teeth, and Lips are intertwined or moving horizontally. This indicates a “flat” market with low volatility. In trading terms, the longer the Alligator sleeps, the hungrier it gets, often leading to a more significant breakout.
- Awakening phase (Trend formation): As the lines begin to untangle and separate, the Alligator is “waking up.” Usually, the green Lips move first, followed by the red Teeth. This suggests that a new trend is being born, though it may still require confirmation before entry.
- Feeding phase (Strong trend): When the three lines are widely separated and moving parallel in one direction, the Alligator is “feeding.” This is the most profitable phase for traders. As long as the price stays above (in an uptrend) or below (in a downtrend) the green Lips, the trend is considered healthy.
- Satisfied phase (Trend weakening): Eventually, the lines begin to converge or cross back over one another. This signals that the Alligator is “sated” and the trend is losing momentum. Price often returns to the red Teeth line during this phase, indicating it may be time to protect profits.
2.2. Alligator behavior and Decision table
To help you make quick decisions at a glance, use the following table to map the indicator’s visual behavior to the appropriate market action.
| Alligator behavior | Market phase | Market condition | Recommended Action |
| Lines are tangled/intertwined | Sleeping | Range-bound / Sideways | Stay out (Avoid noise) |
| Lines starting to separate | Awakening | Early trend formation | Observe (Wait for breakout) |
| Lines are wide apart and parallel | Feeding | Established strong trend | Trade (Enter/Hold position) |
| Lines begin to converge/cross | Satisfied | Trend exhaustion | Exit (Take profits/Tighten SL) |
3. How to use Alligator Indicator in forex
Getting the hang of the Alligator Indicator in forex is like learning to read a roadmap for profitable trades. It’s not just about adding it to your chart, it’s about understanding its signals to catch trends and sidestep traps. Here’s how to make it work for you.
3.1. Setting up the indicator
Most professional trading platforms, including MetaTrader 4 (MT4), MetaTrader 5 (MT5), and TradingView, have the Alligator built-in. To set it up, go to the indicator menu, search for “Alligator,” and apply the standard settings:
- Jaw: 13 period, 8-bar shift (Blue)
- Teeth: 8 period, 5-bar shift (Red)
- Lips: 5 period, 3-bar shift (Green)
While you can customize colors, using the standard blue, red, and green helps you follow most professional analysis. No manual calculations are required, as the platform automatically shifts the averages forward to provide the “leading” visual effect Bill Williams intended.
3.2. Reading the signals
Once set up, the Alligator Indicator provides specific signals based on the interaction of the three lines:
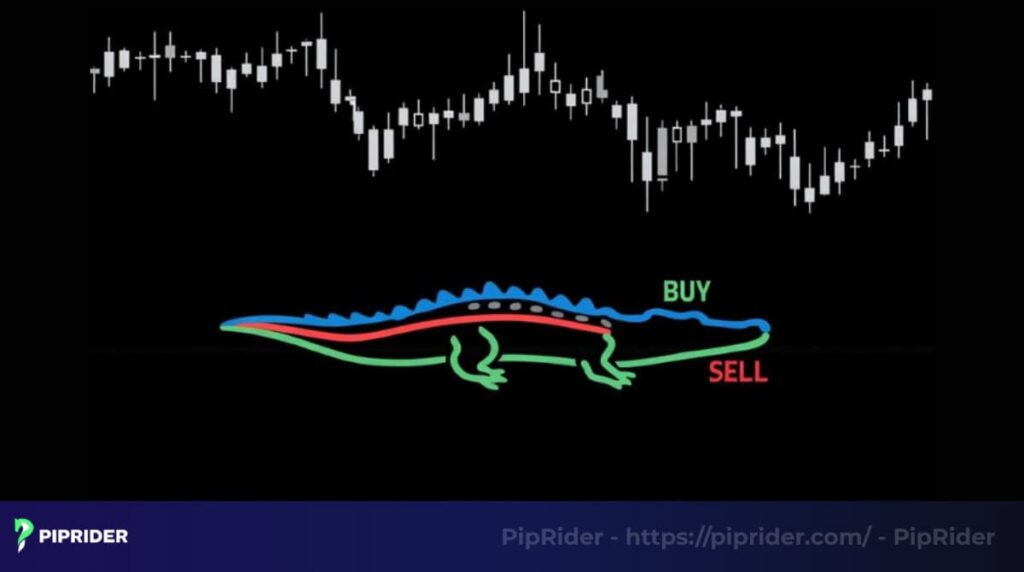
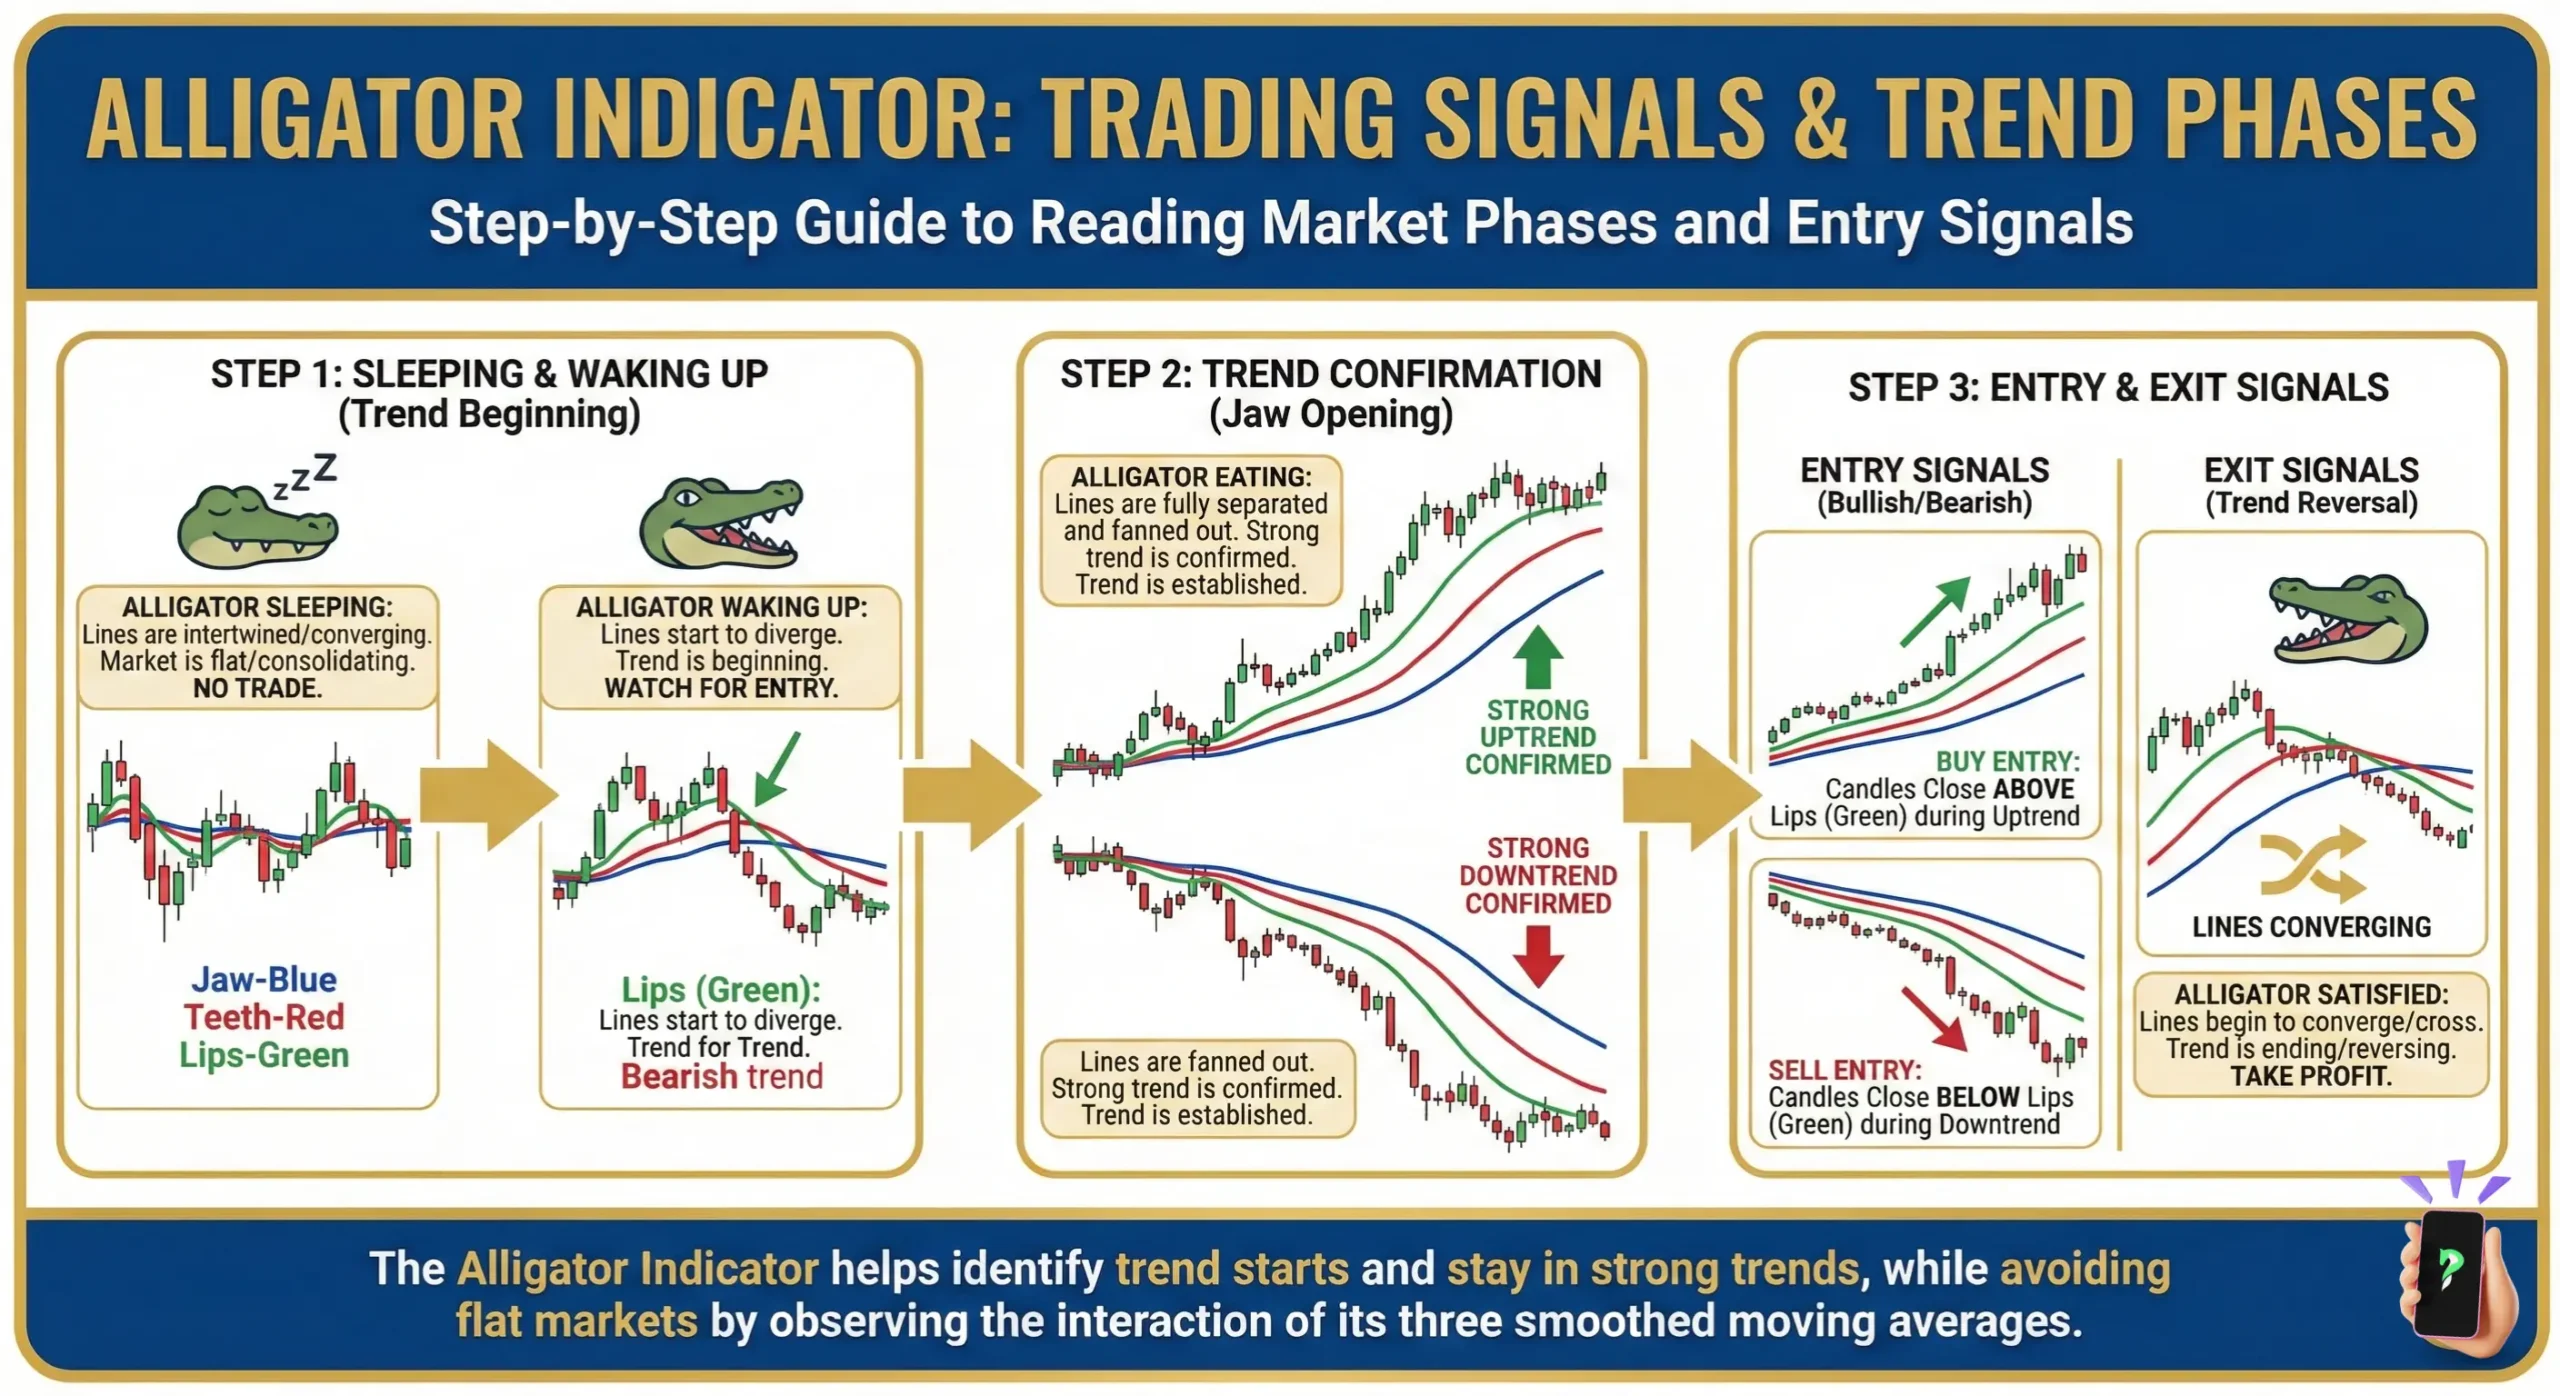
- Buy signal: When the green Lips cross above the red Teeth and blue Jaw while the lines are spreading upward. This suggests the “Alligator is waking up” to a bullish trend.
- Sell signal: When the green Lips cross below the red Teeth and blue Jaw while the lines are spreading downward. This suggests a bearish awakening.
- Hold the trend: As long as the lines remain separated and do not cross back over each other, the “Alligator is feeding”. You should stay in the trade as the trend continues or look for a trend continuation pattern to add to your position.
- Exit signal: When the lines begin to converge or “tangle,” the Alligator is sated. This indicates the trend is losing momentum, and it is time to take profits.
3.3. Avoiding false signals and choosing timeframes
The most common mistake traders make is trying to trade every crossover. To increase your success rate, you must consider the “noise” of the market.
- The power of higher timeframes: For the most reliable signals, focus on H4 (4-hour) or Daily charts. On these timeframes, the Alligator’s “sleep” and “feeding” phases are much more distinct because they represent larger shifts in institutional capital.
- The M5 trap: Lower timeframes like the M5 (5-minute) are prone to market noise. Because price moves rapidly in small increments, the Alligator lines may cross frequently without an actual trend forming, leading to “whipsaws” (false signals).
- The tightness rule: If the lines are crisscrossing tightly and frequently, the market is range-bound. Stay on the sidelines until you see a clear, wide separation between the Jaw, Teeth, and Lips.
4. When Should You Trade with the Alligator?
Understanding the difference between a “signal” and a “tradable opportunity” is what separates successful traders from beginners. The Alligator indicator is a trend-following tool; therefore, it should only be used when a clear trend is present. Use this strict decision layer to filter your trades:
TRADE ONLY When the Alligator is “Feeding”:
- Visual check: The Jaw, Teeth, and Lips must be clearly separated and fanned out like an open mouth.
- Price position: In a buy trade, the price should stay consistently above the green Lips. In a sell trade, it should stay below them.
- Momentum: The lines should be sloping steeply up or down, showing strong market conviction.
AVOID Trading When the Alligator is “Sleeping”:
- Visual check: The lines are tangled, crossing each other frequently, or moving horizontally.
- Market context: This indicates a ranging or “choppy” market where price has no clear direction. Trading here leads to “death by a thousand cuts” due to frequent false breakouts.
- Action: Stay on the sidelines. The most profitable action during the sleeping phase is to do nothing and wait for the “awakening”.
5. Simple Alligator Trading Strategy
To move from theory to execution, follow this step-by-step trend-following strategy. This framework is designed to help you enter during the strongest part of a move while protecting your capital.
Step 1: Wait for the Awakening
Do not try to guess when a trend will start. Wait for the green Lips to cross the other two lines and for all three lines to begin pointing in the same direction.
Step 2: Confirm the Direction
Before entering, ensure the price candle closes entirely above (for a buy) or below (for a sell) the Alligator’s mouth. This confirms that the market has enough momentum to break out of its previous range.
Step 3: The Entry (Pullback Method)
Instead of chasing a vertical move, look for a minor “dip” or pullback toward the red Teeth line. If the price touches or nears the red line but fails to cross it, and then resumes the trend direction, this offers a high-probability entry point.
Step 4: Set Stop-Loss and Take-Profit
- Stop-Loss: Place your initial stop-loss behind the blue Jaw line. Since the Jaw represents the long-term balance, a price break beyond it usually means the trend has failed.
- Take-Profit: Monitor the green Lips. When the price crosses back over the green line or the green line begins to “hook” back toward the red line, it signals the Alligator is “satisfied.” This is your cue to exit the trade or trail your stop-loss tighter to lock in gains.
6. Best Alligator Indicator settings for forex trading
There is no single “best” setting for every situation, but adjusting the Alligator Indicator can make a marked difference in your trading results. Different trading styles and market conditions require specific tweaks to the lookback periods and offsets.
6.1. Default settings for most traders
The default settings are the gold standard for most forex pairs. They are balanced to provide a mix of speed and reliability, particularly on H1 or H4 charts.
- Jaw (13, 8), Teeth (8, 5), and Lips (5, 3) are the recommended parameters for major pairs like EUR/USD or USD/JPY.
- These settings shine in steady markets, catching the meat of a trend without reacting too aggressively to minor intraday price spikes.
6.2. Adjusting for trading styles
Your trading style whether you are in and out in minutes or holding for days—should dictate your settings.
- Day trading: To capture intraday movements on M15 or M30 charts, you might try slightly faster settings like Jaw (8, 5), Teeth (5, 3), Lips (3, 2). Be aware that faster settings naturally increase the frequency of false signals.
- Swing trading: Stick with the defaults or even extend the Jaw offset (e.g., 15, 10) on H4 or Daily charts. This filters out market “noise” and focuses on the underlying long-term trend.
- Scalping: Use very short settings, such as Jaw (5, 3) on M1 or M5 charts. However, scalping with the Alligator is highly advanced and should always be paired with a volatility filter to avoid getting caught in the “sleeping” phase.
6.3. Tweaking for market conditions
Currency pairs have different “personalities.” Some move smoothly, while others are erratic.
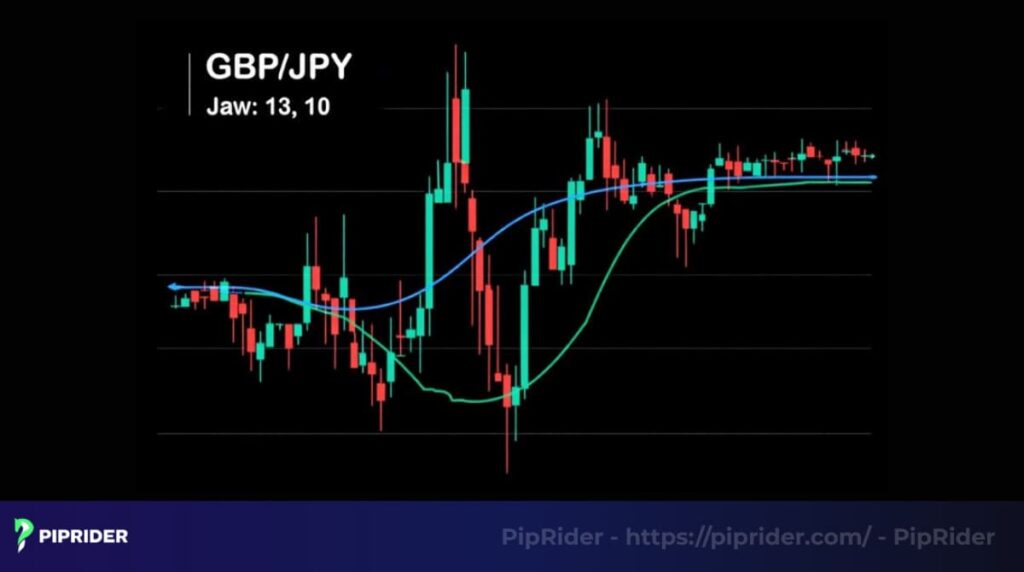
- Volatile pairs (e.g., GBP/JPY): Increase the offsets (the number of bars shifted forward) to smooth out the lines. This prevents the “teeth” from being triggered by temporary price spikes.
- Stable pairs (e.g., EUR/USD): The default settings are usually sufficient here, as price action tends to respect the smoothed moving averages more consistently.
7. Integrating the Alligator Indicator with additional tools
The Alligator Indicator is powerful, but it reaches its full potential when used as part of a confluence-based strategy. Using it alongside other indicators helps filter out weak trends and avoids “over-trading” in the wrong zones.
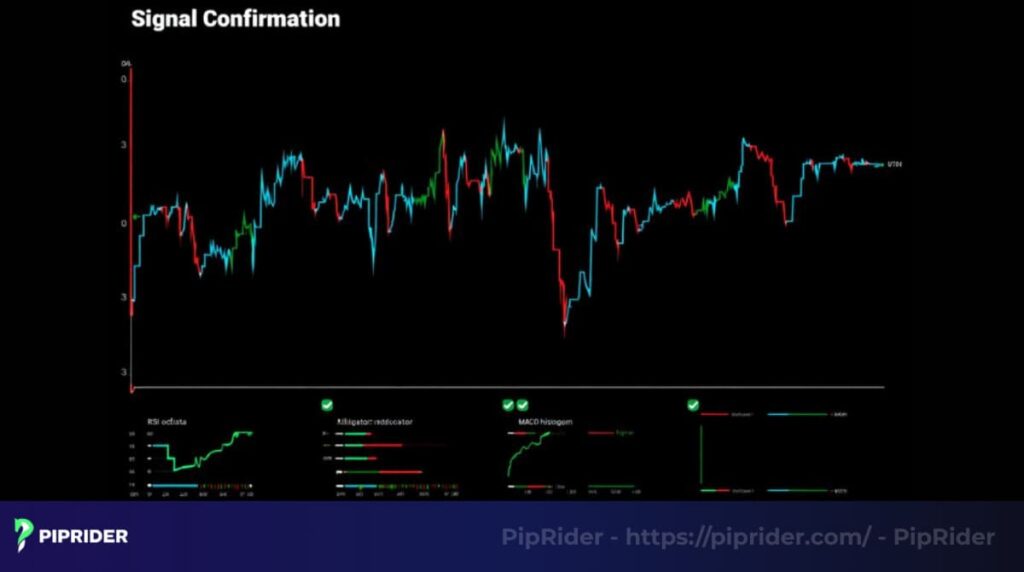
- RSI (Relative Strength Index): Use RSI to ensure you aren’t buying at a market peak. For a high-probability buy signal, confirm that the Alligator is opening upward while RSI is below 70. If RSI is above 70, the market may be overbought, and you should wait for a pullback.
- MACD (Moving Average Convergence Divergence): This tool confirms trend momentum. Look for a MACD crossover in the same direction as the Alligator’s “awakening.” If the Alligator signals a buy but the MACD histogram is shrinking or showing divergence, the trend may lack the strength to continue.
- Fractals: Bill Williams’ own preferred companion. A bullish fractal above the Alligator’s “teeth” is often the most reliable entry trigger for a long position, while a bearish fractal below the mouth signals a sell.
- Support and Resistance Levels: Always check for major price levels on your chart. If the Alligator signals a “feeding” phase just as the price breaks through a key resistance level, it provides a much stronger signal than a crossover happening in the middle of a range.
8. Alligator + Fractals: The Bill Williams Combo
To use the Alligator Indicator as it was originally intended, you should pair it with Fractals. In the Bill Williams trading system, the Alligator acts as a filter (showing the trend phase), while Fractals provide the specific price level for entry. This combination is widely considered the most robust way to trade this indicator.
The Fractal Breakout Method
A Fractal is a five-bar pattern that identifies a local high or low on the chart. When used with the Alligator, the rule is simple: Only trade breakouts of Fractals that occur outside the Alligator’s mouth.
- Bullish setup: Wait for the Alligator to be in the “Awakening” or “Feeding” phase (lines opening upward). Look for a bullish fractal to form above the red Teeth line. A buy order is triggered only when the price breaks above the high of that fractal.
- Bearish setup: Wait for the Alligator lines to open downward. Look for a bearish fractal to form below the red Teeth line. A sell order is triggered when the price breaks below the low of that fractal.
By using Fractals as your “trigger,” you avoid entering too early and ensure the market has enough momentum to sustain the trend.
9. Alligator vs. Standard Moving Averages
A common question among forex traders is: “Why should I use the Alligator instead of two or three standard Moving Averages (MAs)?” While they look similar, their construction and purpose are fundamentally different.
The primary difference is that the Alligator uses shifted (displaced) averages. By pushing the lines forward into the future, the indicator filters out immediate price fluctuations, creating a “smoother” look that better represents the underlying market balance.
Comparison Table: Alligator vs. Moving Averages
| Feature | Alligator Indicator | Standard Moving Averages |
| Structure | 3 smoothed MAs, shifted forward | 1–3 simple or exponential MAs |
| Primary purpose | Identifying market phases (Cycles) | Identifying trend direction |
| Signal type | Phase-based (Sleeping vs. Feeding) | Crossover-based (Golden/Death cross) |
| Reaction speed | Slower (aims for trend stability) | Faster (prone to more false signals) |
| Key strength | Provides context; tells you when not to trade | Simplicity; easy to identify basic direction |
While standard MAs are excellent for identifying the general path of price, the Alligator provides the context of the market’s “appetite,” helping you avoid the sideways traps where standard MA crossovers often fail.
10. Benefits and drawbacks of the Alligator Indicator
No tool is perfect, and the Alligator Indicator is no exception. Understanding its strengths and weaknesses helps you apply it strategically rather than following it blindly.
10.1. Advantages of the Alligator
The Alligator Indicator is a favorite among trend-following traders for several reasons:
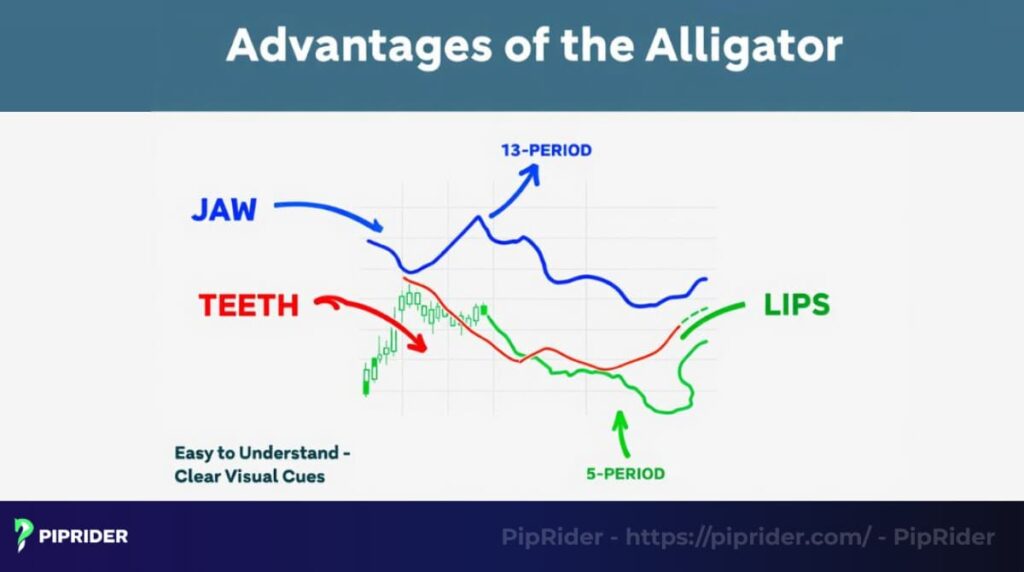
- Visual clarity: The interaction between the Jaw, Teeth, and Lips provides an immediate “roadmap” of the market’s state. You can see at a glance whether the market is resting or active.
- Trend filtering: It is exceptionally good at helping traders stay out of sideways markets. By identifying the “sleeping” phase, it prevents over-trading during low-probability periods.
- Versatility: It is effective across various assets, including forex, stocks, and commodities, and functions reliably on multiple timeframes from M15 up to Monthly charts.
10.2. Limitations to watch out for
- Lagging nature: Because it is based on smoothed moving averages shifted into the future, the signals are inherently lagging. You will rarely enter at the absolute bottom or exit at the absolute top of a trend.
- Whipsaws in choppy markets: While it helps filter sideways action, it is not foolproof. In very tight ranging markets, the lines may cross frequently, leading to multiple small losses if a trader tries to force a breakout.
- Dependency on trends: It only provides high-value signals 15% to 30% of the time. For the remaining 70% to 85% of the time, the indicator provides little actionable data.
11. When the Alligator Indicator Fails
To trade like a professional, you must know when your tools are likely to fail. Even a perfect “feeding” signal can turn into a loss under certain market conditions. Watch out for these high-risk scenarios:
- High-impact news events: During major economic releases (like NFP or central bank interest rate decisions), price volatility can spike violently. These spikes often cause the Alligator lines to cross or spread artificially, leading to false signals that are quickly reversed once the news is absorbed.
- Extremely low volatility: In “flatline” markets—such as during the late New York session or bank holidays—the lines may stay tangled for extended periods. Attempting to trade a “breakout” here often fails because there isn’t enough volume to sustain a move.
- The “satisfied” trap: When the Alligator has been feeding for a long time, the lines will eventually start to converge. Many traders mistake a minor pullback for a new trend “awakening” in the opposite direction. Entering a counter-trend trade here is dangerous, as the Alligator may simply be taking a brief “nap” before resuming the original trend.
- False breakouts (Whipsaws): Occasionally, price will break out of the “mouth” and then immediately dive back in. This is why using a confirmation tool, like Fractals or RSI, is essential to filter out these traps.
12. Indicators that can be combined with the Alligator indicator
To streamline your strategy, use this summary table to select the best companion tools for the Alligator Indicator based on your specific trading goals.
| Indicator | How to use with Alligator | Why it works | Pro tip |
| Fractals | Buy above bullish fractal; Sell below bearish fractal | Pinpoints precise entry/exit price levels | Use the same timeframe as the Alligator |
| RSI | Filter buys when RSI < 70; Filter sells when RSI > 30 | Prevents entering overextended “exhausted” trends | Use a 14-period setting for balance |
| MACD | Align Alligator crossover with MACD histogram momentum | Confirms the strength behind a new trend awakening | Wait for the MACD zero-line cross |
| Bollinger Bands | Watch for expansion alongside Alligator “feeding” | Adds volatility context to the breakout | Use 20-period, 2 standard deviations |
| Support/Resistance | Trade crossovers occurring near key price levels | Aligns indicator signals with historical price psychology | Confirm levels on the Daily (D1) chart |
13. Illustrative Example: Analyzing a EUR/USD trade
To see how these concepts work in a live environment, let’s analyze a typical trend cycle on the EUR/USD pair using the H4 timeframe.
13.1. The Preceding “Sleeping” Phase
Before the opportunity arose, the EUR/USD spent several days in a narrow range. On the chart, the Jaw, Teeth, and Lips were tightly intertwined, crossing each other every few candles. Under our framework, this was the “Sleeping” phase. By following the Alligator’s logic, we stayed on the sidelines, avoiding the dozens of false crossover signals that occurred during this choppy period.
13.2. Executing the Trade: The Awakening
The “Awakening” began when the green Lips crossed above the red Teeth and blue Jaw.
- Entry: We waited for a bullish Fractal to form above the Alligator’s mouth. Once the price broke the high of that Fractal, we entered a long position. At this point, the three lines were starting to fan out, signaling the transition to the “Feeding” phase.
- Confirmation: RSI was at 55, confirming the market had plenty of “room to run” before reaching overbought territory.
- Stop-Loss: We placed a protective stop-loss just below the blue Jaw line to account for minor pullbacks.
13.3. Trade Outcome and Lessons
As the “Feeding” phase continued, the price stayed consistently above the green Lips. We held the position for 48 hours as the lines remained wide apart and parallel.
- Exit: We exited the trade when the green Lips began to slope downward and “hook” back toward the red Teeth, signaling the “Satisfied” phase.
- Key lesson: The most valuable part of this trade wasn’t just the entry, it was the patience during the initial sleeping phase. By ignoring the noise and waiting for the “open mouth” alignment, we captured the core of the move with minimal stress.
14. Frequently asked questions about the Alligator Indicator
Traders frequently ask about the functionality of the Alligator Indicator in forex. I’ve compiled responses to the most common questions to provide clarity. Here’s what you need to know to use this tool confidently.
15. Conclusion and Next steps
The Alligator Indicator is a professional-grade framework for understanding market cycles. Instead of treating it as a simple “buy/sell” arrow, use it to read the story of the market, determining when it is resting, when it is waking up, and when it is time to walk away.
Beginner Shortcut: The Golden Rules
If you are new to the Alligator, follow these two rules to protect your capital:
- Ignore all signals when the lines are tangled or crossing frequently.
- Only trade when the “mouth” is clearly open and the lines are wide apart.
Ready to sharpen your skills? Explore our Technical Indicators section for more deep dives, or visit our For Beginners section to build your trading foundation from the ground up.
Infographic Section
-
Alligator-Indicator -

Alligator Indicator: Trading Combinations -
Step-by-step to Reading Market Phases


