

How can one objectively pinpoint significant swing highs and lows on the fast-paced charts of currency pairs like EUR/USD or GBP/JPY? The central idea of fractal trading, a concept introduced by the legendary trader Bill Williams, uses the fractal indicator to solve this very challenge. These fractal patterns provide clean, unambiguous levels for potential support and resistance, making it particularly effective in the 24/5 Forex market.
This guide will serve as your complete manual for applying fractal patterns and principles to the Forex market. We will move beyond simple definitions to explore the core system, advanced applications, and the psychological discipline needed to trade these fractals profitably.
Key Takeaways
- Fractals are a five-candle pattern that objectively identifies minor swing highs and lows on any currency chart.
- The primary fractal strategy is entering on a breakout of a recent fractal.
- Fractals are most powerful when combined with the Alligator indicators to filter for the dominant trend.
- A fractal is a lagging indicator; it only confirms a turning point after it has occurred.
- For best results in the Forex market, use the fractal indicator on the H1 timeframe or higher to avoid noise.
1. What is fractal trading?
Fractal trading is a technical analysis strategy that utilizes the Fractal indicator to identify recurring patterns and key turning points in price action. Unlike subjective drawing tools, fractals provide a mechanical method to pinpoint potential support and resistance levels.
Origin and Theory
The concept was introduced by the legendary trader and author Bill Williams in his seminal 1995 book, Trading Chaos. Williams, who held a Ph.D. in psychology, developed the Fractal indicator as part of a broader system (along with the Alligator and Awesome Oscillator) to navigate the chaotic nature of financial markets.
The Technical Definition
According to Investopedia, a fractal is defined as a recurring geometric pattern that occurs on all timeframes. In trading terms, it acts as a lagging indicator because the pattern requires five completed candles to be confirmed (Mitchell, 2024).
- The Pattern: It specifically marks a localized high or low point based on a five-bar formation.
- The Signal: It confirms that a trend reversal has already occurred, providing a solid reference point for future breakout entries.
Application in Modern Trading
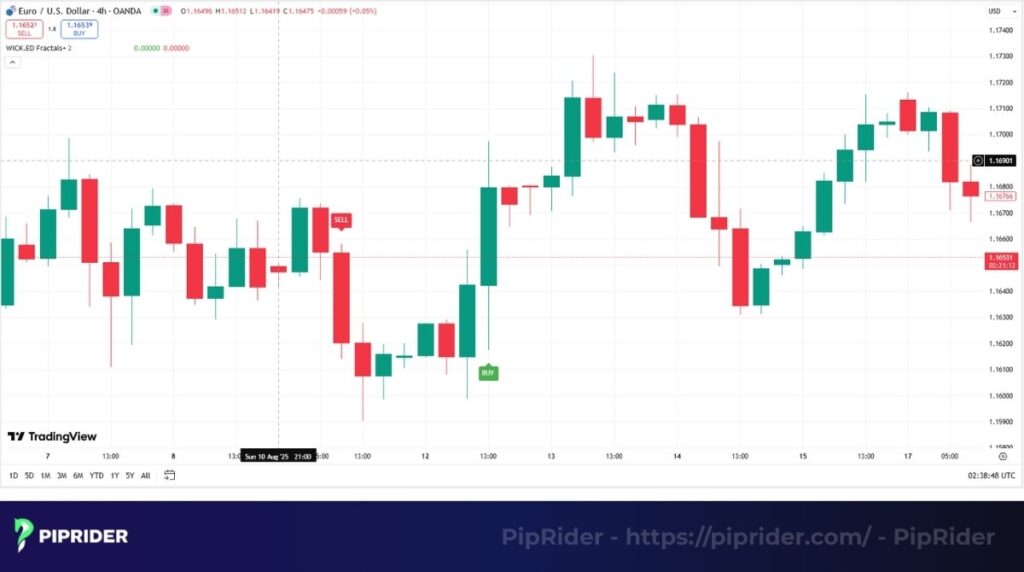
Today, the Fractal indicator is a standard tool on major charting platforms. As noted by TradingView, traders primarily use these fractals to define “breakout levels”, placing pending orders above up fractals or below down fractals to capture impulsive trend moves (TradingView, n.d.).
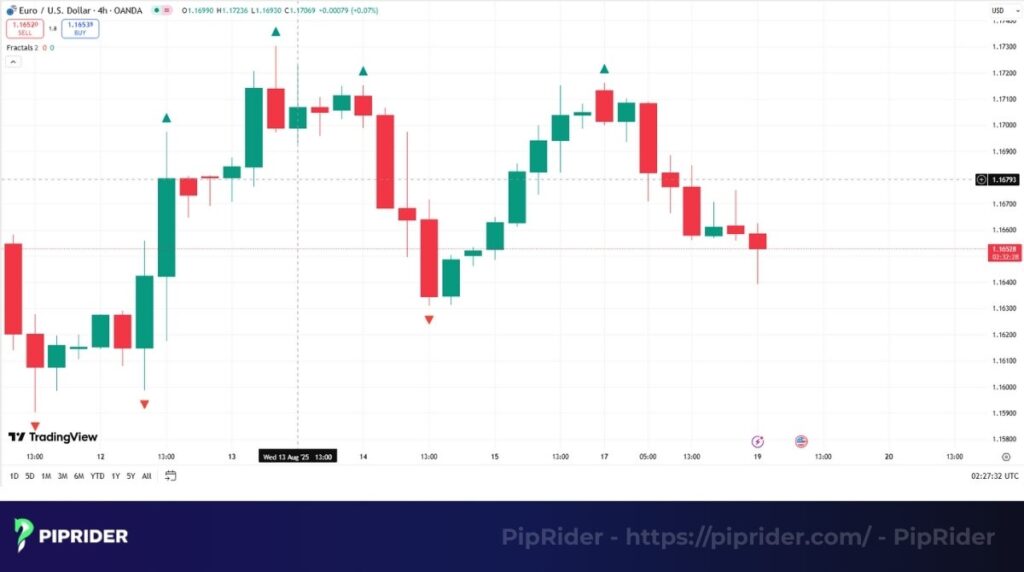
2. How to identify fractals on the chart
While the indicator automatically plots arrows on your price charts, truly internalizing the five-candle structure is key to understanding its timing and importance. There are only two types of fractals, each representing a small, temporary victory for either the bulls or the bears.
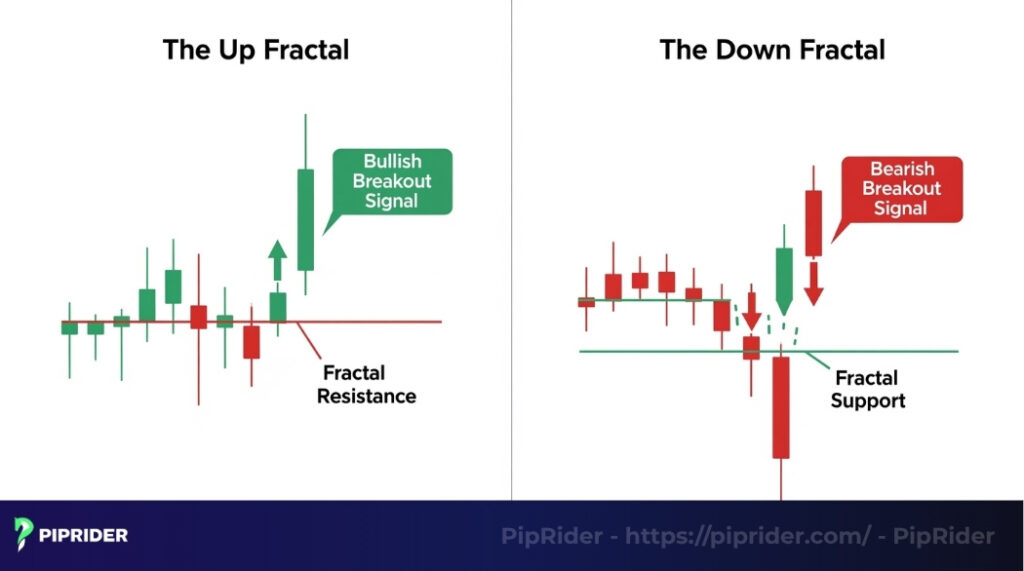
2.1. The up fractal (a bearish turning point)
As you can see in the chart above, an up fractal is a five-candle pattern where the middle candle achieves the highest high, and is flanked on each side by two candles with lower highs. This is also known as a bearish fractal. On a EUR/USD chart, an up fractal (a bearish fractal) signifies a temporary resistance level where sellers managed to halt an advance.
A subsequent break above this bearish fractal level is meaningful because it demonstrates that buyers now possess the strength to overwhelm that prior selling pressure. These fractal patterns are crucial for breakout traders.
2.2. The down fractal (a bullish turning point)
The down fractal is the inverse: a five-candle pattern where the middle candle registers the lowest low, flanked on each side by two candles with higher lows. This is often called a bullish fractal. For instance, on a GBP/JPY chart, a down fractal highlights a short-term price floor where buying activity previously halted a decline.
A break below this bullish fractal level suggests that sellers have absorbed that earlier buying interest and are poised to drive prices lower. Recognizing these fractals patterns is a key skill.
2.3. A critical note on timing
It is crucial to understand that the fractal indicator is a reactive tool that confirms past events; it does not predict future ones. One of the most common sources of confusion for new traders is the precise timing of when these patterns are confirmed.
The arrow for a fractal materializes on your chart only after the pattern is fully formed, which is after the close of the fifth candle. It confirms a swing point that has already passed; it does not forecast one in the future. These patterns are historical markers.
3. The fractal indicator’s “formula” explained
A major appeal of the fractal indicator is its simplicity. Fractals are not derived from a complex mathematical equation like an RSI or MACD. Instead, the indicator operates on a clear set of logical, “if-then” conditions that compare the highs and lows of five consecutive bars to identify specific patterns.
3.1. The logic for an up fractal (arrow above)
For an up pattern to be confirmed at Candle ‘N’ (the central candle), all of the following conditions comparing high prices must be satisfied:
- High Price (N) > High Price (N – 2) and
- High Price (N) > High Price (N -1) and
- High Price (N) > High Price (N + 1) and
- High Price (N) > High Price (N + 2)
This bearish fractal pattern is easy to spot visually.
3.2. The logic for a down fractal (arrow below)
For a down fractal to be validated at Candle ‘N’, the opposite must be true for the lows:
- Low Price (N) < Low Price (N – 2) and
- Low Price (N) < Low Price (N – 1) and
- Low Price (N) < Low Price (N + 1) and
- Low Price (N) < Low Price (N + 2)
This bullish fractal pattern is also very clear.
Where:
- N: the high and low of the current price bar
- N – 2: The high and low of the price bar two periods before N
- N – 1: The high and low of the price bar one period before N
- N + 1: The high and low of the price bar one period after N
- N + 2: The high and low of the price bar two periods after N
4. The core fractal strategy for Forex Traders
Profitable fractal strategies demand more than just identifying arrows. The true power of these patterns is only unlocked when the signals are used as intended: as an entry mechanism within Bill Williams’ complete trend-following framework, where the Alligator indicator serves as the primary filter for the market.
4.1. Step 1: Gauge the trend with the Alligator
The first and most critical step is to assess if a currency pair is even in a tradable state, and if so, in which direction. The Alligator indicator, comprising three smoothed moving averages set at specific Fibonacci-based intervals, is the ideal tool for this task.
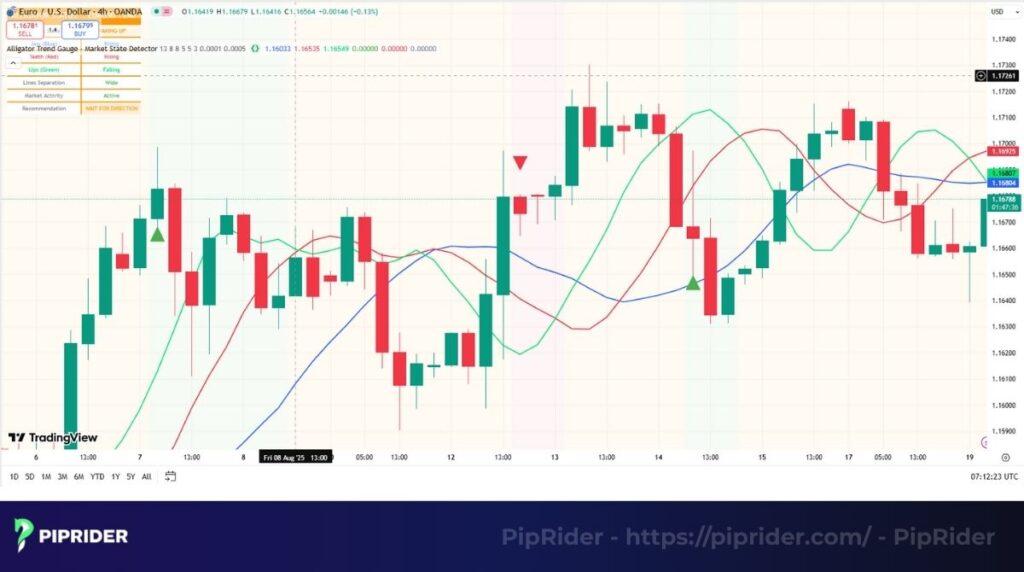
The Alligator’s role:
- The Alligator functions as your market “state” detector. When its Jaw, Teeth, and Lips are tangled and flat, the market is “sleeping” (ranging), and you should avoid trading fractals.
- Conversely, as the lines fan out and begin a clear directional move, the Alligator is considered “awake and hungry.” This signals a strong, impulsive trend that is driven by the expansion of these moving averages.
The forex rule:
- To avoid getting trapped in false breakouts, strictly only seek trading setups when the Alligator’s lines are clearly “open” and angled up or down on the H1, H4, or Daily charts.
- For instance, if you observe a “sleeping” Alligator on the H4 chart of EUR/AUD, you should simply close that chart and look elsewhere. This discipline alone will protect you from countless losing trades.
4.2. Step 2: Pinpoint the entry signal with fractals
Once the Alligator has confirmed a strong, directional trend, you then use the most recent, relevant fractal to identify your precise entry point. This ensures you are entering upon a confirmation of momentum and favorable price action.
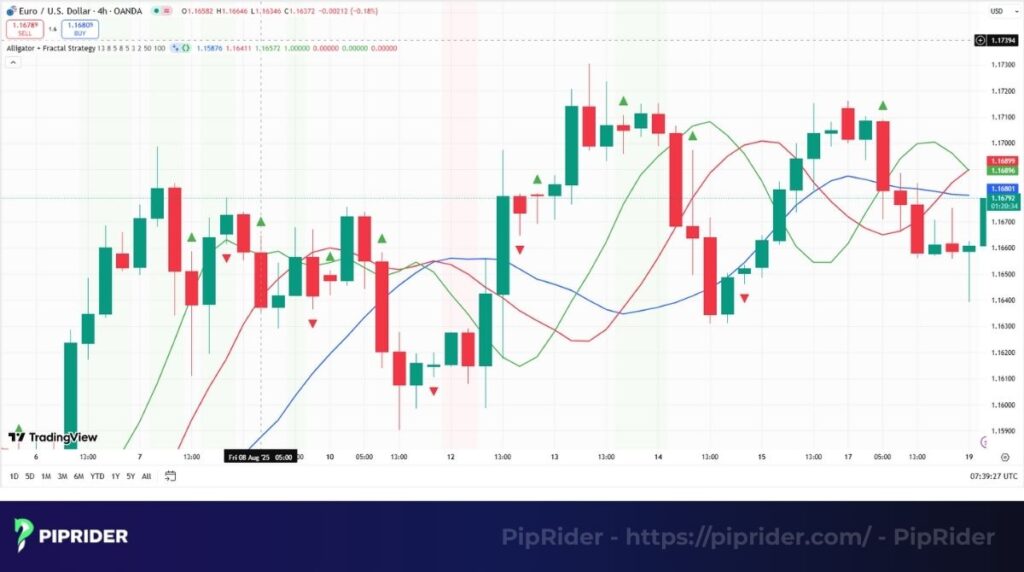
The buy signal: In a confirmed uptrend on EUR/USD (above an “awake,” rising Alligator), you pinpoint the most recent Up Fractal (a bearish fractal). A breakout above the high of these patterns serves as your buy trigger, as it signals a resumption of the uptrend.
The sell signal: In a confirmed downtrend on USD/JPY (below a “hungry,” falling Alligator), you identify the most recent Down Fractal (a bullish fractal). A breakout below this fractal’s low is your signal to sell, confirming the continuation of bearish momentum.
5. Setting your entry and stop loss with Fractals
This section covers the precise mechanics of fractals, explaining how to execute and manage the trade. Flawless execution is as vital as the signal itself.
5.1. The entry point (using pending orders)
The entry point is perfectly designed for pending orders, as you want to enter the trade only when the breakout is validated by price itself. This prevents premature entries.
- The Buy Signal: Position a Buy Stop order slightly above the high of the validated Up Fractal.
- The Sell Signal: Position a Sell Stop order slightly below the low of the validated Down Fractal.
Rule of Thumb for the Buffer: Instead of a fixed number, adjust your buffer based on the specific pair and market conditions to account for the Spread:
- Standard Buffer: For major pairs like EUR/USD, a buffer of Spread + 2 pips above the high is usually sufficient to avoid false triggers.
- Volatility Adjustment: For volatile pairs (like GBP/JPY) or during news hours, increase the buffer slightly to ensure the breakout is genuine before your order is filled.
5.2. The stop loss (two professional methods)
Choosing a stop loss is a function of your risk tolerance. Both methods are valid within this system.
Method 1: The conservative option (Fractal Support/Resistance)
This method uses the most recent fractal structure as a “hard” invalidation point. It gives the trade more room to breathe but carries higher initial risk.
- For Long positions: Place your stop loss just below the low of the most recent Down Fractal (bullish fractal). This level acts as major structural support.
- For Short positions: Place your stop loss just above the high of the most recent Up Fractal (bearish fractal). This level acts as major structural resistance
Method 2: The system’s default (Alligator’s Teeth)
Bill Williams advocated for placing the stop loss at the level of the Alligator’s Teeth (Red Line). This creates a tight, dynamic trailing stop that follows the price closely.
- When to Apply: This method is only effective when the Alligator’s lines are clearly “fanned out” (open wide), indicating a strong, impulsive trend.
- Crucial Adjustment: If the Alligator lines begin to twist or become “tangled” (signaling consolidation), the Red Line becomes unreliable. In this scenario, immediately switch to Method 1 (placing the stop behind the recent Fractal swing) to give the trade more breathing room and avoid being whipsawed out by noise.
5.3. When to take profit?
Knowing when to exit a trade is just as crucial as knowing when to enter. Here are two effective methods for taking profit when using this system.
Method 1: Trailing stop with the Alligator
Bill Williams’ classic approach aims to keep you in a trade for the trend’s full duration, helping you capture the largest possible price moves. A trader uses the Teeth line (the red line) of the Alligator’s moving averages as a dynamic trailing stop.
A trader following this method holds the position until the price closes below this line, which serves as the exit signal. Adhering to this process helps in maximizing gains on strong, extended trends. These are effective exit points.
Method 2: Targeting a fixed risk/reward ratio
Alternatively, you can exit the trade when it reaches a predetermined risk-to-reward (R:R) ratio, such as 1:2 or 1:3. This method provides greater consistency and predictability in your results.
The trade-off for potentially missing a larger trend is the advantage of locking in consistent profits and preventing sudden reversals from erasing gains.
🚀 The Fractal Breakout Cheat Sheet
Trending Only (Alligator is “Awake/Eating”). Avoid Sleeping Alligator.
H1, H4, D1 (Filter out lower timeframe noise).
Long: Buy Stop above Up Fractal.
Short: Sell Stop below Down Fractal.
(Buffer: Spread + 2 pips)
Aggressive: Alligator’s Red Line.
Conservative: Recent Fractal Swing.
Trail the stop loss along the Alligator’s Red Line. Close the trade when a candle closes beyond this line.
6. The rules and limitations
To make this system work, you must approach it with discipline. A professional trader understands the system’s rules, its capabilities, and its inherent weaknesses. Here are the most critical takeaways for these fractal patterns.
6.1. Pros and cons of the system
Let’s first look at the key advantages you can gain by incorporating fractals into your strategy.
- Objective support and resistance: The indicator’s greatest strength is the ability to provide clear, unambiguous support and resistance points. It replaces emotional, discretionary line-drawing with a rules-based framework for these patterns.
- Effectiveness in trending markets: The Forex market is known for its strong, sustained trends. Fractal indicators+ Alligator system is engineered specifically to identify and exploit these exact conditions, making it a natural fit for this market.
- No system is perfect, and fractals have their own set of limitations that you need to be aware of to trade these patterns effectively in different market conditions.
- Excessive noise on lower timeframes: This is the biggest drawback Forex traders must respect. On price charts like the M15 or M5, fractals will appear constantly, creating a significant amount of unusable “noise” and volatility. This is why filtering with the Alligator on the H1 timeframe or higher is an absolute prerequisite for success.
- A lagging nature by design: Fractal indicators only confirm that a swing high or low has formed after the fact. It does not predict future reversal points. It is a tool for confirmation and breakout entries, not for forecasting.
6.2. Critical trading rules
To maximize your chances of success and minimize common pitfalls, adhere strictly to these fundamental rules when trading with fractals.
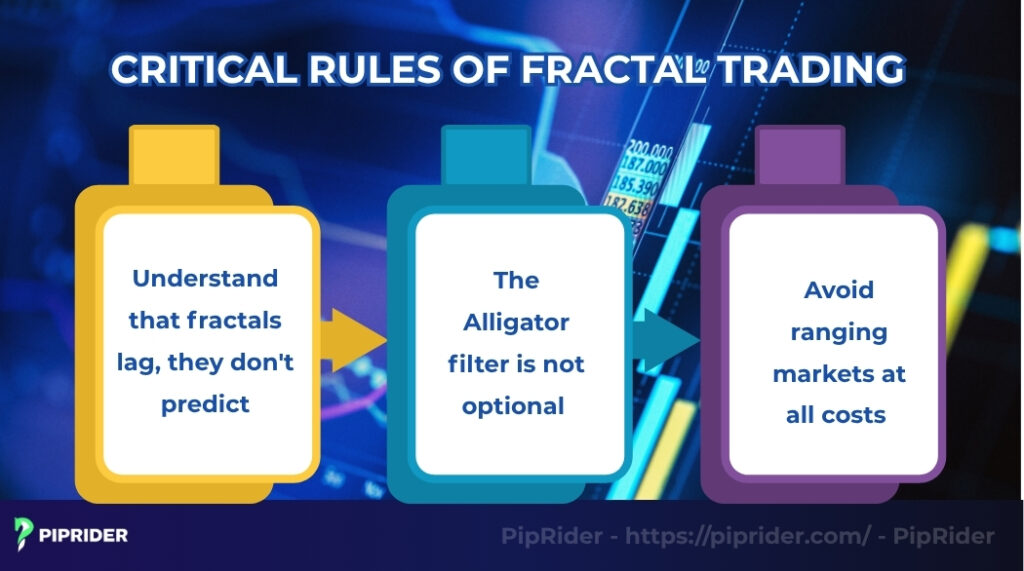
- Understanding that fractals lag, not predict:
You must internalize this. The arrow appears on your chart two candles after the peak/trough is formed, making it a historical marker. Never interpret an up fractal as a standalone signal to sell. Instead, view it as a key level that, if broken, validates the continuation of the uptrend. - The non-optional alligator filter:
This is the most crucial rule of the entire framework. Acting on every single fractal that appears, without regard to the trend, is a common path to eroding an account. The Alligator is the indispensable filter that distinguishes high-probability signals from market noise. - Strict avoidance of ranging markets:
When the Alligator’s lines are flat and tangled, the market lacks clear direction. In this state, the price will whipsaw, constantly breaking recent fractals with no follow-through. If the Alligator is sleeping, your job is to remain patient and do nothing.
7. Fractal advanced trading techniques
Once you have mastered the core system, you can integrate advanced technical analysis techniques to find higher-probability setups and align your trades with broader market forces.
7.1. Combining Fractals with Fibonacci for high-probability setups
This technique employs the Fibonacci retracements tool to identify key, mathematically significant retracement zones within an established trend. You then use fractals signal as the final confirmation trigger to enter at that high-value area. These patterns are very effective.
The strategy in action:
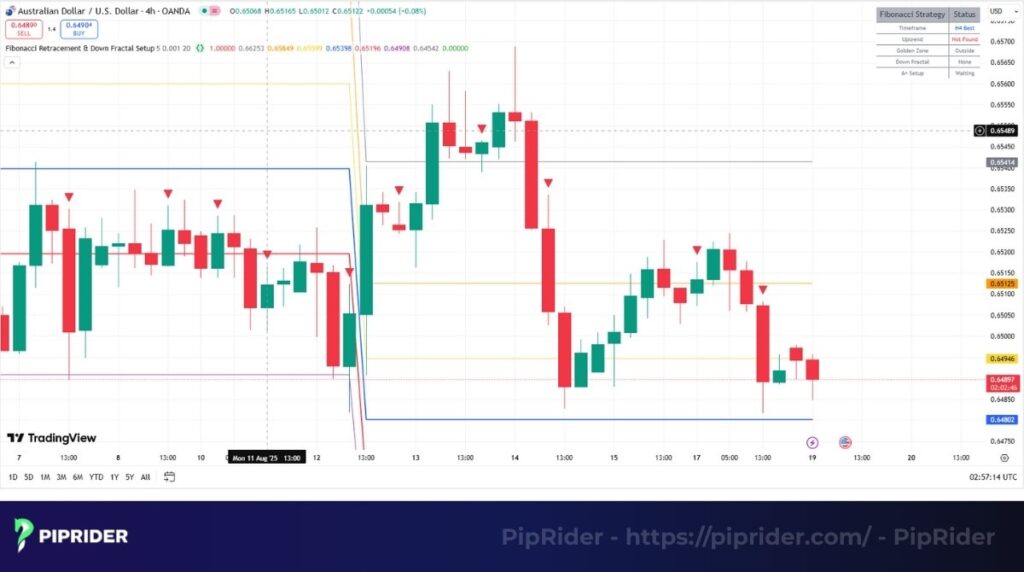
Based on the H4 chart of AUD/USD above, you identify a major upward impulse wave. You draw a Fibonacci Retracement tool from the bottom of that wave to the top. You then patiently wait for the price to correct into the “golden zone” between the 50% and 61.8% Fibo levels from the Fibonacci retracements. These are key psychological points.
The appearance of a Down Fractal pattern (a bullish fractal) at or very near the 61.8% level provides the final confirmation for an A+ buy setup. It indicates that a key support level has held, and one of the most reliable patterns has formed directly upon it.
7.2. Using multi-timeframe analysis for strategic entries
Professional traders approach this system using a complete top-down analysis. Such a process ensures they trade in sync with the “big money” flow and avoid getting trapped in minor, counter-trend price movements.
The example walkthrough:
Step 1: The daily chart – the “strategic” view.
The analysis begins on the D1 chart of USD/JPY. The chart shows the price positioned cleanly above the Alligator, with its lines of moving averages spread wide apart and angled firmly upwards.
Step 2: The H4 chart – the “tactical” view
With the strategic bias set, the focus shifts to the H4 chart for execution. All sell signals based on bearish fractal patterns on this timeframe are disregarded. The task is to patiently wait for the system to present a valid buy setup: placing a Buy Stop order above the most recent Up Fractal, with a stop loss at the Alligator’s red line on the H4 chart.
8. FAQs
9. Conclusion
Fractal trading is more than just identifying arrows; it is a method for locating objective breakout levels within a structured system. While simple on the surface, the indicator’s true power emerges only when combined with the Alligator to filter noise and ride dominant trends.
This rules-based approach eliminates emotional guesswork. However, before risking real capital, we strongly recommend you learn how to backtest trading strategy to validate these patterns on historical data first.
Ready to master the markets with Bill Williams’ system? Follow Piprider for more advanced technical insights.


