
The Hikkake Pattern is a false-breakout candlestick setup built around an inside bar. It traps traders on the wrong side of the move and can signal either a short-term reversal or continuation, depending on market context. Derived from the Japanese word for “to trick” or “to trap,” this price pattern is highly valued by technical traders for its ability to identify liquidity-driven moves (Chen, 2024).
It is particularly effective for signaling sharp, high-probability moves following a failed short-term breakout. Mastering the Hikkake allows experienced traders to identify and exploit the momentum generated by trapped participants, often leading to optimal entry points in various market conditions.
This guide goes beyond simple definitions, providing you with the exact strategies for entry, stop-loss placement, and trade confirmation needed to accurately trade the Hikkake.
Key Takeaways
- The Hikkake Pattern (Japanese for “trap” or “snare”) is a multi-candlestick setup developed by Daniel L. Chesler, CMT (Chesler, 2004).
- Its primary function is to identify a false breakout that immediately reverses, trapping unsuspecting traders.
- The setup signals an imminent, high-momentum move that can be either a reversal or a continuation.
- The pattern requires strict adherence to candle sequence rules and confirmation to be traded effectively.
- It is a powerful tool for short-term traders looking to fade failed continuation moves or capture trend reversals.
1. What Is a Hikkake Pattern?
The Hikkake Pattern is a specialized multi-candlestick formation used by technical analysts to identify a high-probability short-term move in price action. It is one of the more subtle patterns, specifically designed to capitalize on misleading market moves and market indecision.
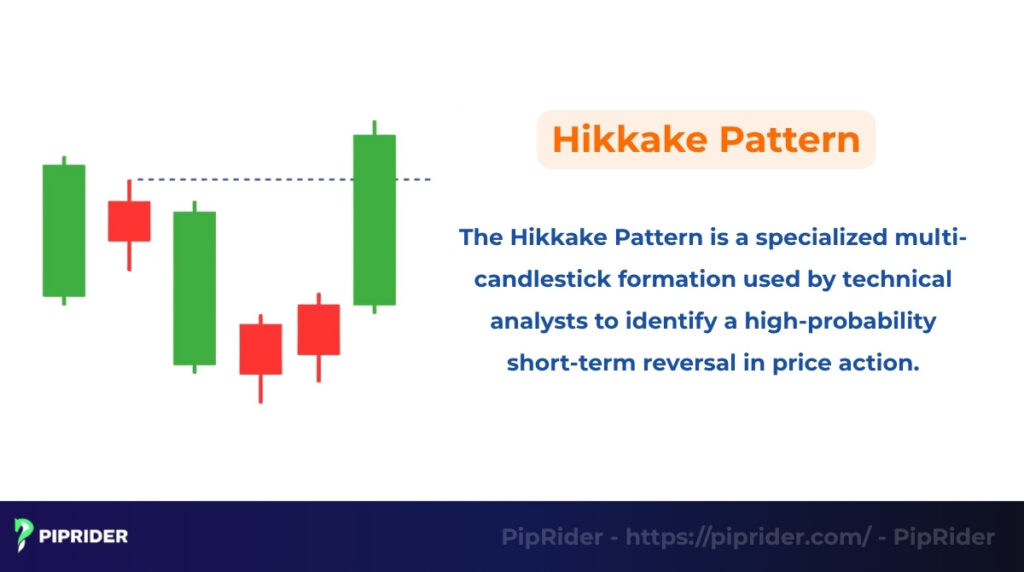
The Hikkake Pattern is a specialized multi-candlestick formation used by technical analysts to identify a high-probability short-term move in price action. It is one of the more subtle patterns, specifically designed to capitalize on misleading market moves and market indecision.
It can act as either a reversal or continuation signal depending on the broader market context. For instance, a Hikkake forming at a major support or resistance level often suggests a reversal, while one forming during a brief pullback in a strong trend may signal a continuation. While primarily known for reversals, advanced traders also use it as one of the most effective continuation candlestick patterns.
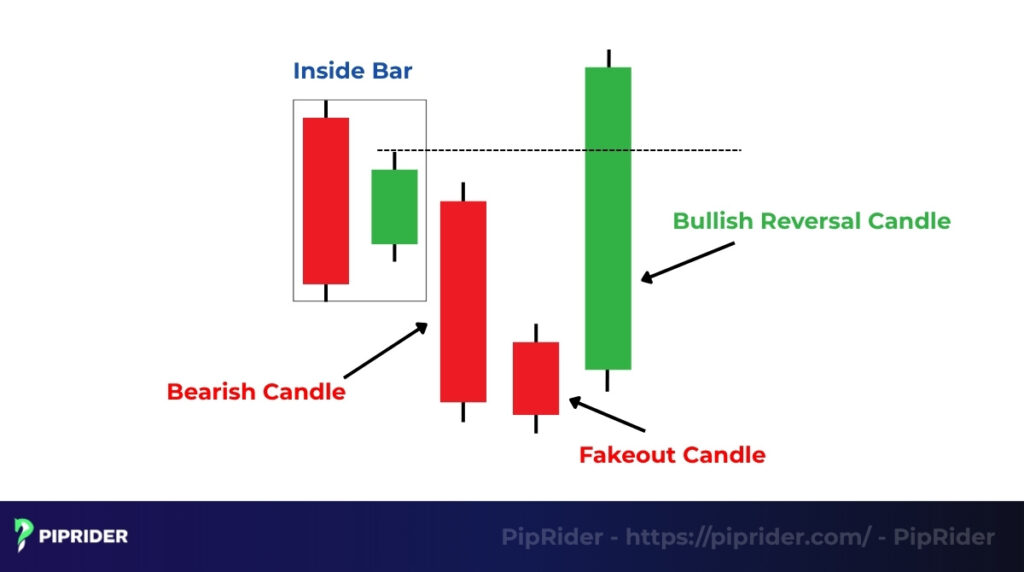
The Hikkake starts with a period of low volatility, where a candle forms inside the range of the preceding candle (known as an inside bar or Harami pattern). It occurs when the price attempts to break out of this narrow consolidation range but fails immediately, reversing quickly back into the opposite direction.
This candlestick pattern essentially signals that the dominant market move is about to resume (or a new one is about to begin), trapping those traders who mistakenly entered on the initial, failed breakout. The pattern was developed by technical analyst Daniel L. Chesler, CMT (Chesler, 2004).
The name “Hikkake” is the Japanese word for “to trap” or “to snare,” accurately reflecting its market mechanism (Chen, 2024). The initial, fleeting move acts as a false breakout, luring aggressive traders into the wrong direction. When the price reverses, the resulting mass liquidation of their stop-loss orders injects powerful, directional momentum, accelerating the price movement and confirming the trap.
2. Is Hikkake a Reversal or Continuation Pattern?
One of the most common misconceptions is that the Hikkake is strictly a reversal signal. In reality, it can act as either a reversal or continuation signal depending on where it appears on the chart:
- As a Reversal Pattern: When a Hikkake forms at key technical levels—such as major support, resistance, or a session high/low—it often signals the end of a price move and the start of a sharp reversal as trapped breakout traders are forced to exit.
- As a Continuation Pattern: During a strong trending market, price often enters a brief consolidation phase (the inside bar). If a Hikkake forms as a “trap” against the prevailing trend and then snaps back into the trend direction, it acts as a powerful continuation setup, purging weak-handed counter-trend traders.
3. Hikkake Pattern Formation
The Hikkake formation is a sequence of candles that identifies a failed attempt to exit a consolidation range. It can act as either a reversal or continuation signal depending on the broader market context.
Quick Hikkake Rules (10-Second Checklist)
- Candle 1 (Mother Bar): A standard price bar.
- Candle 2 (Inside Bar): Must be fully contained within the high and low range of Candle 1.
- Candle 3 (The Trap): Must break the range of Candle 2 (either high or low) but fail to hold.
- Candle 4 (Confirmation): Must reverse and close back through the opposite boundary of Candle 2.
The Three Stages of Formation
- Inside Bar Setup (Consolidation): The pattern begins with an inside bar (Candle 2) fully contained within the high and low of the previous candle (Candle 1). This establishes a zone of low market volatility and market indecision.
- False Breakout: Candle 3 attempts a temporary breakout by moving outside the range of Candle 2, successfully luring short-term traders into “wrong-way” positions.
- Confirmation: Candle 4 (the confirmation candle) quickly snaps back and closes definitively in the opposite direction of the false breakout. This action confirms the trap, generating the strong momentum needed for a new move.
Read more:
Top 21 Trading Patterns Every Trader Should Master in 2025
Pin Bar in Trading: How to Identify, Interpret and Trade It
Alligator Indicator: Best forex trading guide
4. Types of Hikkake Pattern
The Hikkake Pattern is a versatile signal, identifying false breakouts in either direction (Finance Strategists, n.d.). It appears in two distinct forms: the Bullish Hikkake and the Bearish Hikkake. Recognizing the precise candle requirements for each is vital for accurate trade execution.
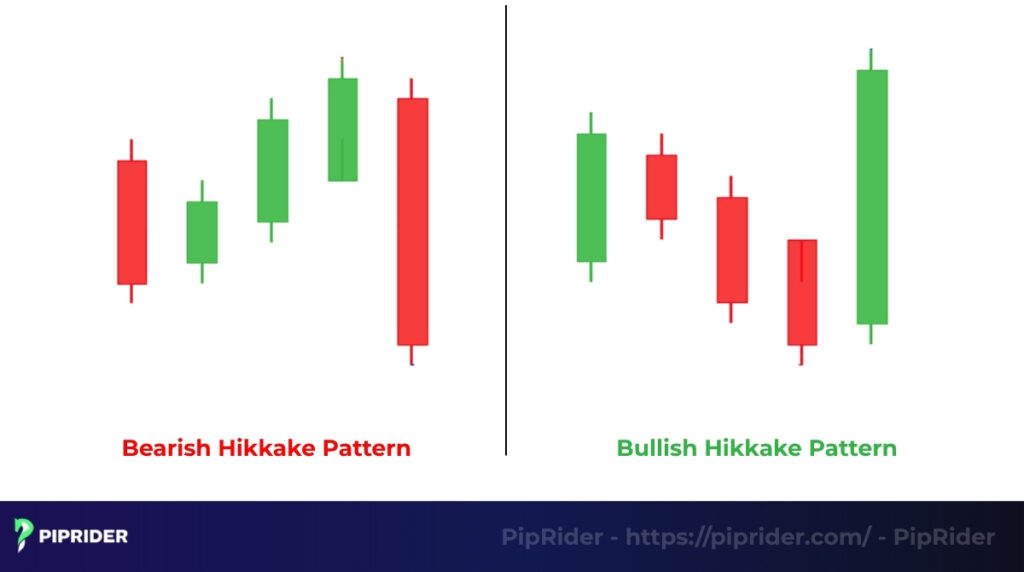
4.1. Bullish Hikkake Pattern
The Bullish Hikkake signals a probable price increase after the market executes a false downward breakout. This sequence confirms that selling pressure has failed, trapping “short” sellers and setting up a buying opportunity (Definedge Securities, n.d.).
Key Features (Candle-by-Candle Description):
- Candles 1 & 2 (Inside Bar Setup): Establish consolidation and low volatility. Candle 2’s high and low are fully contained within Candle 1’s range.
- Candle 3 (The Trap): The price breaks below the low of Candle 2, creating the illusion of a downward breakout. This lures aggressive sellers into short positions.
- Candle 4 (Confirmation): The price reverses sharply, snapping back above the high of Candle 2 and closing strongly. This confirms the trap and signals upward momentum.
4.2. Bearish Hikkake Pattern
The Bearish Hikkake signals a probable price decline following a false upward breakout. This sequence confirms that buying pressure has failed, trapping “long” buyers and setting up a selling opportunity (Definedge Securities, n.d.).
Key Features (Candle-by-Candle Description):
- Candles 1 & 2 (Inside Bar Setup): Establish consolidation and market indecision. Candle 2’s high and low are fully contained within Candle 1’s range.
- Candle 3 (The Trap): The price breaks above the high of Candle 2, creating the illusion of a bullish rally. This lures breakout buyers into long positions.
- Candle 4 (Confirmation): The price reverses sharply, snapping back below the low of Candle 2 and closing strongly. This confirms the trap and signals downward momentum.
4.3. Key Differences
The primary distinction between the two types lies in the direction of the false breakout and the subsequent confirmation move:
| Feature | Bullish Hikkake | Bearish Hikkake |
| Market Sentiment | Bullish (Buy Signal) | Bearish (Sell Signal) |
| False Breakout (C3) | Downward (Breaks C2 Low) | Upward (Breaks C2 High) |
| Trap Mechanism | Traps Short Sellers | Traps Long Buyers |
| Confirmation (C4) | Closes Above C2 High | Closes Below C2 Low |
| Momentum Direction | Upward Reversal/Continuation | Downward Reversal/Continuation |
Read more:
Thrusting Candlestick Pattern: Definition, Types & Strategies
5. How to Identify a Hikkake Pattern
Accurate identification of the Hikkake Pattern relies on rigid adherence to a four-candle sequence and an understanding of the psychological trap being set.
5.1. Candle Sequence Rules
To confirm a valid Hikkake setup, observe the following rules precisely:
- The Base (Candles 1 & 2): Traders must first identify a clear setup, where Candle 2’s entire price action (high and low) is contained within the range of Candle 1. This is the non-negotiable prerequisite for consolidation.
- The Trap (Candle 3): Candle 3 must successfully break out of the inside bar’s range and close outside that range. This is the false signal that lures breakout traders.
- The Signal (Candle 4): This is the confirmation. Candle 4 must close decisively in the direction opposite to Candle 3’s breakout, effectively negating the previous move.
- Bullish Hikkake: Candle 4 closes above the high of Candle 2.
- Bearish Hikkake: Candle 4 closes below the low of Candle 2.
5.2. Position of Breakouts and Reversals
The spatial relationship between the candles is crucial for defining risk and entry:
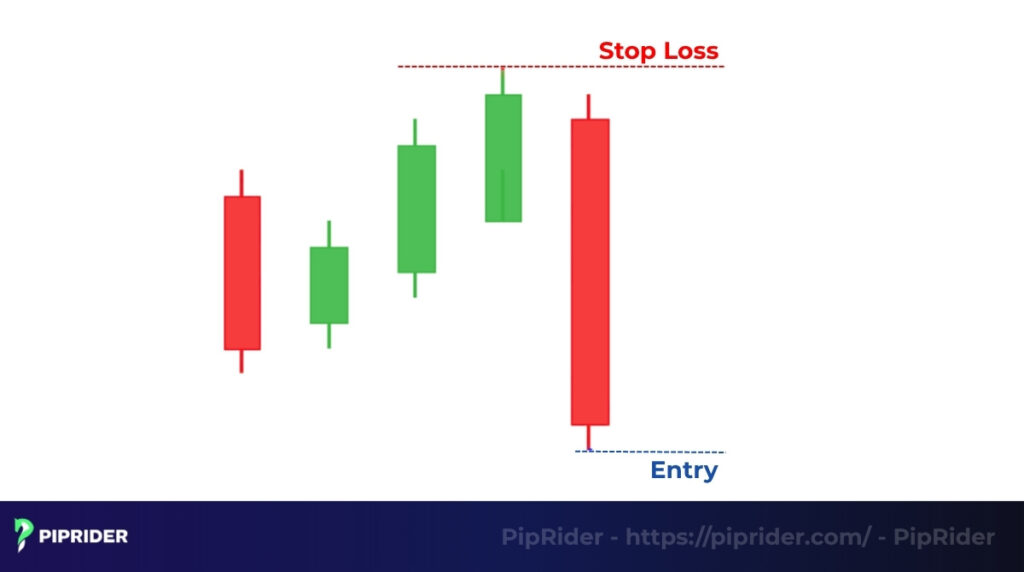
- False Extreme: The highest high or lowest low reached by Candle 3 (the false breakout) is the pivotal point. This extreme confirms the momentary failure of the initial move and serves as the required level for the subsequent stop-loss placement.
- Negation Point: The confirmation (Candle 4) must break the opposite side of the Inside Bar setup (Candle 2). This decisive reversal confirms the strength needed to reverse the market direction.
5.3. Market Psychology Behind the Pattern
The Hikkake price pattern is inherently powerful because its momentum is self-fulfilling, driven by the failure of others:
- Luring the Crowd: Candle 3 attracts aggressive, short-term traders expecting a simple continuation of the breakout direction. These traders immediately place their protective stop-loss orders just beyond the extreme of Candle 3.
- Fueling the Reversal: When Candle 4 rapidly reverses, it triggers the stop-loss orders of this newly trapped crowd. This mass liquidation (forced buying/selling) creates an immediate, sharp surge of volume and momentum, accelerating the price action in the confirmed direction. The pattern, therefore, capitalizes on liquidation momentum.
This specific psychology makes it highly effective when spotting ‘traps’ within larger formations. For instance, a Hikkake appearing at the rim of a cup and handle chart pattern often marks the final shakeout of weak hands before the major breakout occurs.
5.4. What Makes a Hikkake Setup Invalid?
Not every failed breakout is a valid Hikkake. To filter out low-probability noise, avoid setups with these “Invalid” characteristics:
- The “Fake” Inside Bar: If Candle 2’s high or low extends even slightly beyond Candle 1’s range, the base is not valid.
- The “Weak” Trap: If Candle 3 fails to actually break the high or low of Candle 2, no trap has been set.
- The “Lazy” Reversal: If Candle 4 fails to close beyond the opposite boundary of the inside bar (Candle 2), there is no confirmation of momentum.
- Choppy Market Conditions: Avoid trading the Hikkake in a “dead range” or sideways market where there is no expansion potential. Without a clear trend or key level, the pattern is prone to whipsaws.
Read more:
How To Trade Bearish Shooting Star Candlestick Pattern?
Gartley Patterns: A Trader’s Guide to Harmonic Chart Signals
6. Real-World Case Studies
To understand how to execute this pattern, let’s analyze two distinct scenarios using a standard step-by-step workflow.
6.1. Bullish Hikkake Example (XAU/USD)
Consider a scenario on the Gold (XAU/USD) pair where price has been in a prolonged downtrend and is approaching a major daily support zone.
- Market Context: Price hits long-term support. Bearish momentum is exhausted.
- The Setup (C1 & C2): An Inside Bar forms (C2 high/low within C1), signaling indecision at the support level.
- The Trap (C3): Candle 3 breaks below the C2 low. Aggressive sellers enter, expecting a support breakout.
- The Confirmation (C4): Candle 4 reverses immediately, closing strongly above the high of Candle 2. Breakout sellers are now trapped.
- Entry: A buy-stop order is placed just above the high of Candle 4.
- Risk/Reward: Stop Loss is placed below the low of Candle 3. The target is the nearest resistance level (minimum 1:2 R:R).
6.2. Bearish Hikkake Example (EUR/USD)
In this scenario, the EUR/USD pair has rallied into a key psychological resistance level during a short-term corrective move.
- Market Context: Price reaches a major resistance zone after a corrective rally.
- The Setup (C1 & C2): Inside bar consolidation forms as buyers and sellers battle at the resistance level.
- The Trap (C3): Candle 3 breaks above the C2 high. Breakout buyers enter, luring the “crowd” into a false rally.
- The Confirmation (C4): Candle 4 snaps back, closing definitively below the low of Candle 2. The upward move is confirmed as a trap.
- Entry: A sell-stop order is executed when the price breaks below the low of Candle 4.
- Risk/Reward: Stop Loss is placed slightly above the high of Candle 3. The target is the previous swing low.
7. How to Trade the Hikkake Pattern Step-by-Step
Successful trading of the Hikkake Pattern demands disciplined execution, strict adherence to confirmation rules, and precise risk management.
Context is equally critical. Integrating this setup into flag pattern trading strategies can be powerful. If a Hikkake forms at the boundary of a flag channel, it often provides the precise trigger needed to catch the continuation move.
7.1. The 6-Step Trading Workflow
To maintain high precision, follow this standardized execution sequence:
- Context Alignment: Identify if the market is at a key level (Reversal) or in a strong trend pullback (Continuation).
- Inside Bar Identification: Confirm that Candle 2 is fully contained within Candle 1.
- The Trap Observation: Wait for Candle 3 to break the range of Candle 2. Do not enter here.
- Confirmation Signal: Ensure Candle 4 closes beyond the opposite boundary of Candle 2 to validate the trap.
- Entry Execution: Place an order according to your chosen entry model (see below).
- Trade Management: Define your Stop-Loss and apply the professional profit-taking framework.
7.2. Three Professional Entry Models
Depending on your risk tolerance and the market context, you can choose from these three models:
| Entry Model | Execution Trigger | Best For | Pros/Cons |
|---|---|---|---|
| Aggressive | Enter immediately on the close of Candle 4 | High-momentum moves at key levels | – Better price – Higher risk of fakeouts |
| Conservative | Enter on a breakout of the Candle 4 high/low | Most traders; standard setups | – High confirmation – Worse R:R ratio |
| Retest | Enter on a pullback to the Candle 2 boundary after C4 confirms | Volatile markets with deep retracements | – Optimal R:R – Trade may leave without you |
7.3. Stop-Loss Placement
The Hikkake pattern’s structure inherently allows for very tight stop-loss placement using the false breakout extreme:
- Bullish Setup: Place the stop-loss marginally below the low of Candle 3.
- Bearish Setup: Place the stop-loss marginally above the high of Candle 3.
- Rationale: If the price reverses back to the level of the failed breakout, the pattern’s logic is invalidated, allowing for the fastest possible exit with minimal loss.
7.4. Professional Profit-Taking Framework
Avoid setting generic targets. Use this tiered framework to maximize returns while protecting capital:
- Target 1 (TP1) = 1:1 R:R: Close 50% of the position when the profit equals the initial risk (1R). Move the stop-loss to Breakeven to ensure a “risk-free” trade.
- Target 2 (TP2) = Nearest Structure: Close the remaining position at the nearest significant support or resistance level (minimum 1:2 R:R).
- Trend Extension (Optional): If the pattern aligns with a higher-timeframe trend, trail your stop-loss behind the most recent swing points to capture a large directional move.
Read more:
GMMA Trading Indicator: How to identify strong trends for Hikkake setups
8. Pros and Cons of the Hikkake Pattern
While the Hikkake is a high-conviction pattern, successful application requires awareness of both its structural strengths and practical limitations in various market conditions.
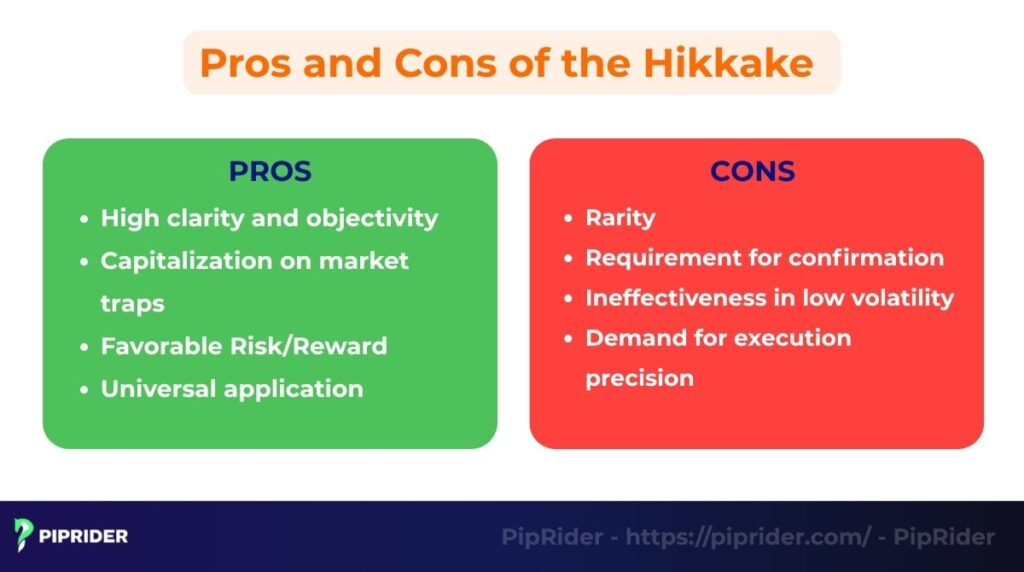
8.1. Strengths (Pros)
The Hikkake Pattern offers several advantages that appeal to experienced technical investors:
- High clarity and objectivity: The rules for identification and execution are clear and objective (C1, C2, C3, C4 sequence), minimizing subjective interpretation.
- Capitalizes on traps: Its primary strength is reliably signaling failed market moves, allowing traders to capitalize on false breakouts that generate strong reversal momentum.
- Favorable Risk/Reward: Since the stop-loss is placed tightly just beyond the extreme of the false breakout (C3), the pattern inherently offers low relative risk and favorable Risk-to-Reward (R:R) ratios.
- Universal application: It is effective across all markets (forex, stocks, crypto) and various timeframes.
8.2. Weaknesses (Cons)
Investors must be aware of the pattern’s inherent limitations to mitigate risks:
- Rarity and Strictness: The pattern is not common due to the strict four-candle sequence required. This rarity can be frustrating for active, high-frequency traders as the rules may be too restrictive for those seeking constant setups.
- Requires confirmation: The Hikkake can generate noise; therefore, it must be confirmed by additional tools (e.g., volume, RSI, or MACD) to filter out false signals.
- Ineffective in low volatility: The pattern loses effectiveness when the market is caught in an extremely tight, choppy, flat range, where signals may lack the necessary momentum.
- Demands precision: Successful execution relies entirely on precise stop-loss placement and disciplined entry only after Candle 4’s close or break.
9. Modified Hikkake Pattern
The Modified Hikkake Pattern is an enhanced version of the classic setup, designed to significantly increase signal accuracy and help traders filter out false signals in noisy markets.
While the standard Hikkake only requires Candle 3 to break the range of Candle 2, the Modified Hikkake adds a specific, stricter structural requirement to the false breakout candle (Candle 3):
- Modified Bullish Rule: The false breakout candle (Candle 3) must have a higher low than the preceding candle (Candle 1) before the reversal occurs.
- Modified Bearish Rule: The false breakout candle (Candle 3) must have a lower high than the preceding candle (Candle 1) before the reversal occurs.
This additional constraint ensures that the market is showing a structural exhaustion of momentum before the trap is confirmed. While this version leads to fewer trading opportunities, the accuracy of the signals is notably higher.
Standard vs. Modified Hikkake Comparison
| Feature | Standard Hikkake | Modified Hikkake |
|---|---|---|
| Structure | Inside bar + any false breakout + confirmation | Stricter high/low rules for the trap candle (C3) |
| Frequency | Higher | Lower (Rarer) |
| Reliability | Moderate-to-High | Very High |
| Best For | Active traders | Conservative, high-conviction traders |
| Drawback | More prone to “noise” and fakeouts | Missing valid setups due to strictness |
10. Hikkake Pattern vs. Similar Patterns
The Hikkake Pattern is a highly specific, multi-candle trap setup built on an Inside Bar base and a subsequent failure of a false breakout. Recognizing its unique mechanism prevents it from being confused with other similar reversal signals.
| Pattern | Core Definition/Mechanism | Primary Function | Distinguishing Conditions |
| Bullish Hikkake | Multi-candle setup exploiting a false low breakout move from an Inside Bar. | Reversal UP (Buy Signal) | False breakout occurs down below the C2 low; Confirmation (C4) must close above the C2 high. |
| Bearish Hikkake | Multi-candle setup exploiting a false high breakout from an Inside Bar. | Reversal DOWN (Sell Signal) | False breakout occurs up above the C2 high; Confirmation (C4) must close below the C2 low. |
| Fakey Pattern | A price action setup involving an inside bar followed by a false breakout (often a Pin Bar). | Reversal | Reversal Very similar to Hikkake; however, Hikkake requires a strict 4-candle close-based confirmation (C4), while Fakey often focuses on the wick (Pin Bar) of the false breakout candle itself. |
| Inside Bar Breakout | A trade taken immediately when price breaks the Inside Bar range (C3). | Trend Continuation | The strategy trades the breakout (C3) hoping for continuation, not waiting for the failure and reversal. |
| Engulfing Pattern | A two-candle price pattern where the second candle’s body fully covers the first candle’s body. | Direct Reversal | Lacks the multi-candle C3 False Breakout, the critical trap mechanism that fuels the reversal momentum. |
| Generic False Breakout | Price briefly passes a key structural level (S/R) and fails. | Reversal (Broad/Subjective) | Lacks the rigid Inside Bar base (C1 & C2) to objectively define the consolidation base and risk placement. |
11. Best Market Conditions for the Hikkake Pattern
Identifying the four-candle sequence is only half the battle. To trade the Hikkake with high conviction, you must understand the market environment in which it operates. The “where” on the chart is often more important than the “what”.
11.1. High-Probability Locations
The Hikkake is a liquidity-driven pattern. It works best in areas where “trap” potential is highest:
- Major Support and Resistance: A Hikkake forming at a well-tested level suggests that a breakout attempt has failed, making a sharp reversal highly likely.
- Trend Pullbacks: In a strong trend, look for an inside bar during a minor retracement. A Hikkake that traps counter-trend traders and snaps back into the main trend is one of the most reliable continuation signals.
- Session Highs and Lows: False breakouts of the previous day’s high or low often form Hikkake patterns as institutional “stop-hunting” occurs.
11.2. Optimal Timeframes
While the Hikkake is universal, its reliability increases significantly on higher timeframes where market “noise” is naturally filtered out:
- H4 (4-Hour) and D1 (Daily): These are the “Goldilocks” timeframes for the Hikkake. Patterns here represent significant shifts in sentiment and usually lead to sustained moves.
- H1 (1-Hour): Effective for day traders, provided the setup aligns with a higher-timeframe trend.
- Lower Timeframes (M5, M15): Avoid trading the Hikkake on very low timeframes, as they are prone to “micro-traps” and lack the liquidation volume needed to fuel a sustained move.
11.3. When to Avoid the Hikkake (Low-Probability Conditions)
The Hikkake often fails in the following scenarios:
- Dead Ranges: In a sideways market with extremely low volatility and no clear expansion potential, a Hikkake is often just a series of random fluctuations rather than a true trap.
- High-Impact News Events: Avoid trading the pattern immediately before or after major economic data releases (like NFP or CPI). The resulting volatility can create “whipsaws” that invalidate the pattern’s structural logic.
- Thin Liquidity: In markets with low trading volume, price can easily slip past your stop-loss, and the “liquidation momentum” needed for the pattern to work simply isn’t there.
Pro Tip: Always check the “expansion potential”. If the Hikkake is boxed in by nearby structural obstacles, the Risk-to-Reward ratio will rarely justify the trade, even if the setup is technically valid.
12. Common Mistakes to Avoid
Even experienced traders make errors when applying the Hikkake. Avoiding these common mistakes is essential for maintaining accuracy and risk control.
- Entering before confirmation: The single biggest mistake is entering on the False Breakout (C3) or before Candle 4 has fully reversed and broken the C2 boundary. Patience is critical; an early entry invalidates the low-risk thesis of the pattern.
- Confusing Inside Bars with Hikkake: Mistaking every Inside Bar setup for a Hikkake is dangerous. The Hikkake requires the specific C3 False Breakout and the C4 reversal; a standard Inside Bar is usually a continuation signal.
- Ignoring overall trend context: Trading Hikkake reversals against a massive, established higher-timeframe trend drastically reduces the probability of success. Use the Hikkake to confirm a reversal at a key structural level, not to blindly predict major market pivots.
- Trading in “Dead Ranges” without expansion potential: Entering a Hikkake trade when the market is in a tight, low-volatility sideways range is a high-risk error. Without “expansion potential”, enough room for the price to move toward a logical target before hitting major obstacles, the pattern is prone to “whipsaws” where it triggers an entry and immediately stalls.
13. Frequently Asked Questions (FAQs)
14. Conclusion
The Hikkake Pattern is a powerful tool because it profits directly from the failure of other traders’ breakout attempts. Success hinges on discipline: always wait for the confirmation (C4) and manage your risk strictly using the C3 extreme.
To master this and other high-probability setups, consistent education is vital. Continue developing your price action expertise by following the Analysis section at Piprider for the latest articles and strategy guides.


