
The Evening Star is a three-candle bearish reversal pattern that can signal a market top when it forms at resistance and receives proper confirmation. Appearing at the peak of an ascending trend, it visually captures the moment when bullish momentum stalls and control begins to shift toward the bears. Named after the celestial event marking the transition from day to night, this formation provides a structural warning that a reversal or deep correction may be developing.
This guide will detail the psychological structure, market context, and technical validation required to trade the Evening Star candlestick pattern with objective discipline.
Key Takeaways
- This is a three-candle reversal candlestick pattern that must form after a clear price trend.
- The middle, small-bodied candle signals market indecision and buyer exhaustion, marking the pivot point where the power shifts.
- For high reliability, the third bearish candle must close below the midpoint (50%) of the first bullish candle’s body.
- The signal’s conviction is amplified significantly when it forms precisely at a major resistance zone or supply zone.
- Confirm the setup with follow-through below the third candle’s low, supported by at least one extra confirmation (RSI/MACD alignment, volatility expansion, or volume/tick-volume where available).
1. What Is the Evening Star Pattern?
The Evening Star is a widely recognized three-candlestick bearish reversal pattern that suggests a potential downtrend following a strong bullish move (Investopedia, 2024). It is the visual narrative of an uptrend reaching exhaustion. This pattern serves as a valuable structural cue for technical analysts.
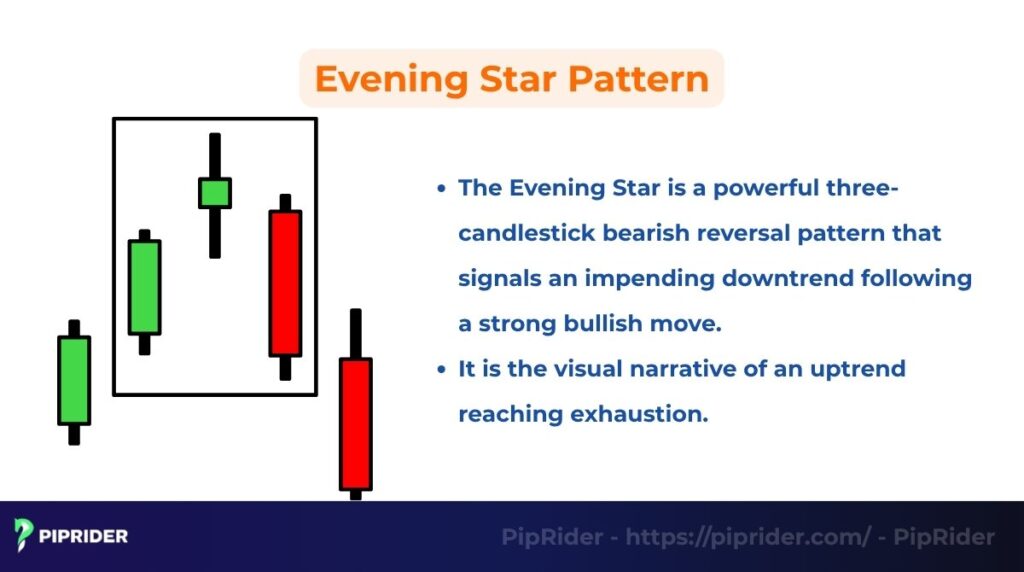
This pattern marks the failure of buyers and the definitive takeover by sellers. It is crucial to note that the Evening Star is a multi-candle signal, distinguishing it from single candlestick patterns like the Pin Bar. The market transitions from strong bullish confidence to a state of indecision and exhaustion (represented by the “Star” candle) before sellers capitalize by pushing the price down aggressively (via the third bearish candle).
The strong close of the bearish candle suggests that bullish conviction has fractured, trapping late buyers and forcing them to sell, which accelerates the subsequent decline. This aggressive price movement confirms the reversal.
The Evening Star candlestick pattern has its highest predictive value when it forms precisely at a major resistance zone, a supply zone, or a key Fibonacci retracement level, creating a strong confluence of bearish pressure.
2. How the Evening Star Pattern Works
The Evening Star pattern is a three-stage drama that narrates the market’s transition from bullish exuberance to bearish control. Its structure clearly details the exhaustion of the bullish trend and the subsequent, decisive reversal.
The Evening Star candlestick formation unfolds across three consecutive candles, each telling a distinct part of the market story:
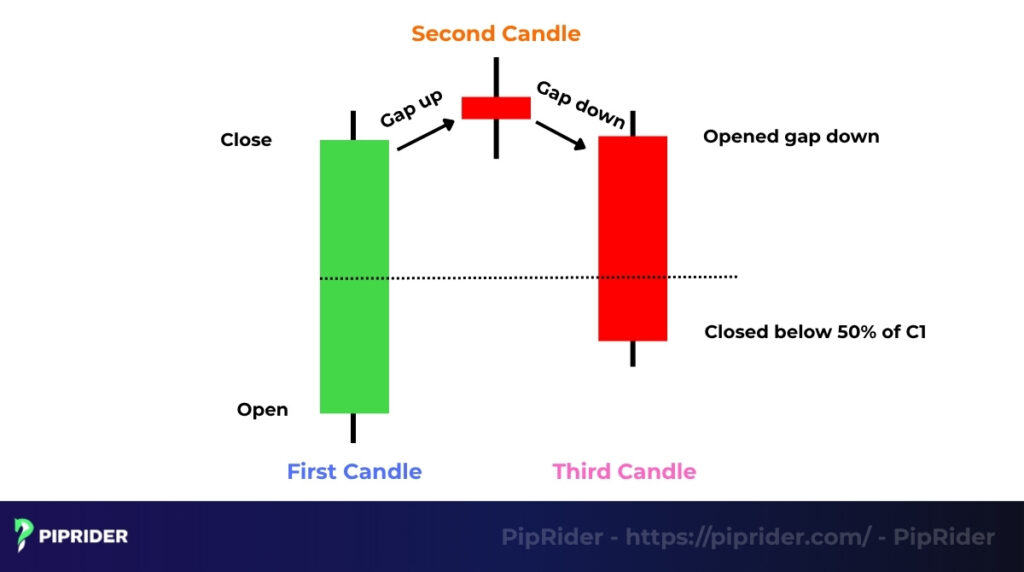
Candle 1: The Apex of Optimism
This is a large, bullish (green) candle that continues the prevailing uptrend. It reflects strong buyer conviction and closes near its high, signaling the height of bullish driving force.
Candle 2: The Star of Indecision
This candle is small-bodied, often a Doji or a Spinning Top, reflecting the exhaustion of the bullish move. In traditional stock markets, it typically gaps up from the close of the first candle. (Pro Note: In continuous 24/5 markets like spot Forex or Crypto, intraday gaps are rare. Expect this “star” to open exactly at or very near the prior close). Regardless of the market, this candle signifies indecision; buyers attempted to push higher but failed to maintain control, meeting early resistance.
Candle 3: The Bearish Corroboration
This is a large, bearish (red) candle. While textbook stock examples look for a “gap down” open, a flat open is the standard in Forex (BabyPips, n.d.). What matters most is the follow-through: it must trade decisively downward and close well into the body of the first candle, ideally below its 50% midpoint. This aggressive move confirms that sellers have taken command, overwhelming the remaining buyers and validating the bearish reversal.
3. Key Factors to Identify a Valid Evening Star Pattern
Identifying a structurally sound Evening Star pattern requires checking for strict technical conditions that confirm seller commitment and buyer exhaustion. This validation includes closely monitoring key trendlines and structural levels.
- Location: The pattern must appear at the peak of a strong uptrend. If it forms in a sideways or ranging market, it’s not a valid reversal signal.
- Star Quality: The middle candle’s body should be small, clearly indicating market indecision and the failure of buyers to sustain buying power. It is important to note that this small star is a sign of indecision, not strong rejection, contrasting with a definitive bearish shooting star.
- Midpoint Breach: The third, large bearish red candle must close below the 50% midpoint of the first bullish candle’s body. This breach is the core structural validation.
- Volatility & Volume Confirmation: Relying solely on the candlestick shape is risky. You should look for at least one extra confirmation bucket on the third bearish candle:
- Volume/Tick Volume: In centralized markets (Stocks/Crypto), look for a noticeable volume spike. In decentralized markets like Spot Forex, observe a surge in tick volume (proxy) indicating heightened trading activity (OANDA, n.d.).
- Volatility Expansion: The range (high to low) of the third candle should ideally be larger than the recent average, or show an expansion in the Average True Range (ATR), confirming strong downward momentum.
- Indicator Confluence: Look for confirmation from momentum price oscillators:
- Relative Strength Index (RSI): The setup is stronger if the price has established a bearish divergence on the RSI (price makes higher highs, but RSI makes lower highs).
- MACD: A bearish crossover (crossing below the signal line) at the time of the pattern’s close adds weight to the reversal. Having multiple momentum indicators align bearishly provides an additional layer of confluence.
4. What Does the Evening Star Pattern Tell Traders?
The Evening Star provides a clear narrative of the market’s psychological shift, signaling a potential end to bullish control. It is a visual testament to buyer exhaustion and the subsequent failure to maintain momentum. This pattern effectively warns that the risk of holding long positions is now elevated.
The core message is the threat of a potential reversal or a rapid, deep correction. The aggressive close of the third candle suggests that the bullish trend is stalling and new downward momentum is developing. Traders should treat this as a structural cue to reassess long trades, tighten stop-losses, or prepare for short-selling setups if confirmation criteria are met.
Crucially, the pattern’s structural significance is amplified when it forms precisely at a resistance zone or a critical psychological price level. This confluence suggests that strong selling interest appears at a predetermined supply area, indicating a higher potential for a sustained price decline.
5. How to Trade Using the Evening Star Pattern
Trading the Evening Star pattern effectively demands strict adherence to confirmation and defined risk parameters, prioritizing a high-quality short entry.
5.1. Entry Point and Invalidation
Never enter immediately upon the close of the third candle. Wait for price action to confirm the bearish continuation.
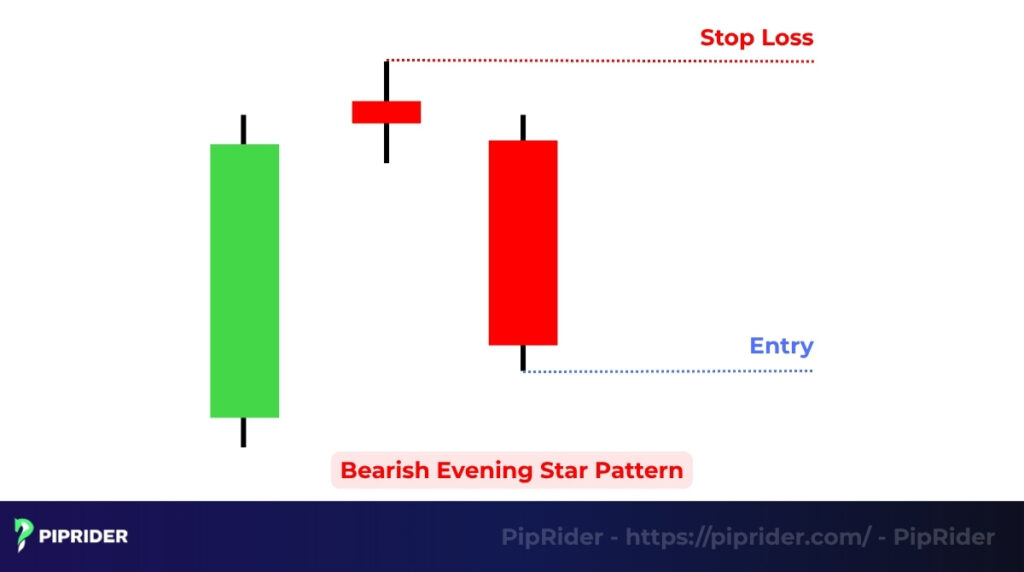
- Short Entry: Place a sell stop order or enter a market short once the price breaks and trades below the absolute low of the third (bearish) candle. This delayed entry confirms seller momentum is fully engaged.
- The Invalidation Rule (False Break): If the price breaks the low of Candle 3 to trigger your entry, but immediately reverses and closes back above that low (or into the middle of the pattern) within the next 1-2 candles, treat it as a failed breakdown. Professional traders will often reduce their position size or exit entirely at this point to protect capital, as the bearish momentum has failed to materialize.
5.2. Stop Loss (SL) Placement
The stop loss must be set at the point where the reversal scenario is technically invalidated, but it must account for market noise.
- SL Position with Buffer: Place the Stop Loss (SL) above the absolute highest point of the entire three-candle pattern (typically the high of the small “Star” candle). Never place it exactly at the high. To survive random volatility spikes and spread widening, always add a structural buffer.
- The Buffer Formula: Calculate your stop loss as Star High + Buffer. A reliable rule of thumb is to use a buffer equal to the greater of two times your broker’s spread, or a small fraction of the timeframe’s Average True Range (ATR).
5.3. Take Profit (TP) and Risk Management
Define profit targets based on technical market structure while striving to maintain a favorable risk-to-reward profile. Since the Evening Star aims to catch a major trend reversal, consider a multi-tiered exit strategy to maximize the move.
- Primary Target (TP1): Aim for the nearest major support zone, previous swing lows, or key Fibonacci retracement levels (e.g., 38.2% or 50%) applied to the preceding bullish trend.
- Scaling Out & Trailing Stops: Instead of exiting the entire position at TP1, professional traders often secure partial profits (e.g., closing 50% of the trade). For the remaining position, trail the stop loss behind newly formed lower highs to capture the extended downward momentum.
- R:R Ratio: As a strict risk management rule, aim to only accept setups where the distance to your Primary Target (TP1) offers a minimum Risk-to-Reward (R:R) ratio of 1:2 or better.
5.4. Corroboration Confluence
To filter out lower-quality signals and build a stronger technical case, the trade setup should be combined with other technical tools. Require at least one extra confirmation bucket from the following:
- Structural Breakdown: The price action breaking below an ascending trendline or a dynamic support level (like the 20-period EMA), signaling that the broader bullish structure is fracturing.
- Volume/Volatility: A noticeable surge in volume (or tick volume for Spot FX) on the third candle, or an expansion in volatility (such as an increase in the Average True Range – ATR).
- Momentum Indicators: A momentum confirmation, such as a bearish RSI divergence or an MACD bearish crossover aligning with the pattern’s completion.
6. Example of an Evening Star Pattern in Forex
We use the EUR/USD Daily Chart at a major resistance zone (e.g., 1.1050) to distinguish between a tradable setup and a risky signal.
Strong Setup: High Conviction Short
A strong setup aligns multiple factors. The Evening Star pattern forms precisely at the 1.1050 Resistance Zone after a sustained bullish trend, and the third candle closes aggressively below the 50% midpoint. Crucially, the tick volume (proxy on your broker feed) on Candle 3 shows a noticeable surge above the recent average, accompanied by a clear range expansion (the candle body is significantly larger than recent price action). Furthermore, the prior ascending trendline is clearly broken.
- Execution: Short Entry at 1.1000 (after breaking Candle 3’s low). SL is placed at 1.1065 (the Star high of 1.1060 + a 5-pip ATR/Spread buffer).
- R:R Profile: Targeting major support at 1.0820 yields a potential reward of 180 pips for a true risk of 65 pips, establishing a highly optimal Risk-to-Reward ratio approaching 1:3.
Weak Setup: Low Conviction Warning
A weak signal occurs when the Evening Star pattern forms within a sideways consolidation range (not an uptrend peak) and lacks confirmation from volume, tick activity, or volatility expansion on the third candle. This is likely market noise or minor profit-taking. Traders must ignore this setup, as the high risk of a quick reversal (whipsaw) makes the trade unreliable and often results in a poor R:R ratio.
7. Evening Star vs. Morning Star: What’s the Difference?
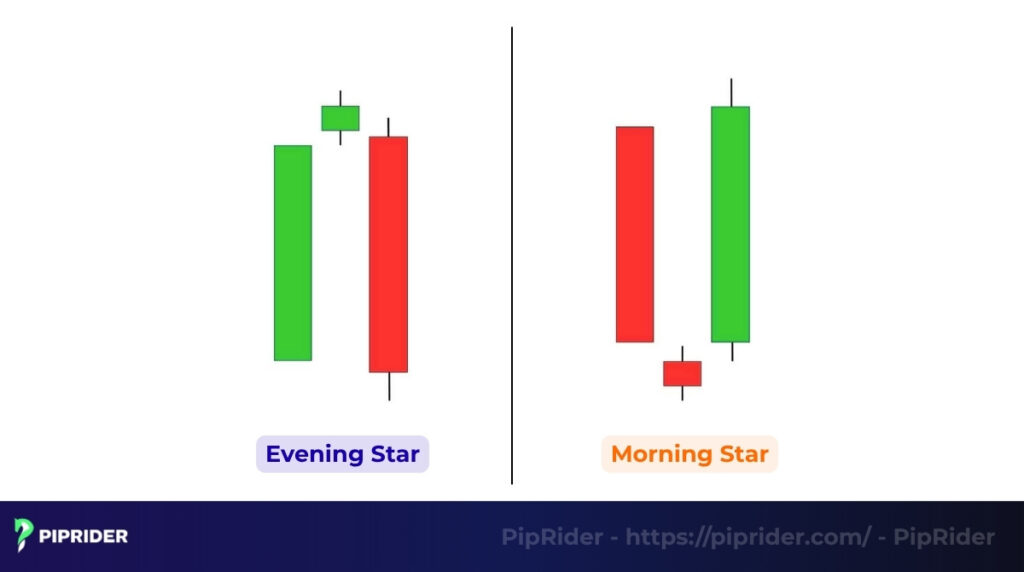
The Evening Star and the Morning Star candlestick reversal patterns are mirror images of one another, forming the most reliable pair of three-candle reversal signals. Understanding their contrast is essential for identifying turns at both market tops and bottoms.
| Feature | Evening Star Pattern | Morning Star Pattern |
|---|---|---|
| Signal | Bearish Reversal (Sell Signal) | Bullish Reversal (Buy Signal) |
| Trend Context | Appears at the peak of a bullish trend | Appears at the bottom of a downtrend |
| Candle 1 | Large Bullish (green candle) | Large Bearish (red candle) |
| Candle 2 | Small body, indicating indecision (can gap up) | Small body, indicating indecision (can gap down) |
| Candle 3 | Large Bearish (red candle), closing below 50% of Candle 1 | Large Bullish (green candle), closing above 50% of Candle 1 |
When to Use Each Pattern
- Use the Evening Star pattern: When the market has reached a point of major resistance or is showing signs of overbought conditions (Relative Strength Index > 70). It is used to exit existing long positions or to initiate new short (sell) trades.
- Use the Morning Star: When the market has reached a point of major support or is showing signs of oversold conditions (Relative Strength Index < 30). It is used to exit existing short positions or to initiate new long (buy) trades.
8. Frequently asked questions about Evening Star Pattern
9. Conclusion
The Evening Star pattern provides a clear structural framework for identifying potential market tops. By capturing the shift from bullish momentum to bearish follow-through, it offers traders a defined area to assess risk and plan short-side setups.
However, its effectiveness relies entirely on technical alignment. The pattern must be validated by market context, such as a rejection at major resistance, and confirmed by volume, tick activity, or momentum indicators. By strictly adhering to these confirmation rules, traders can filter out market noise and execute setups with disciplined risk management. To advance your mastery of market structure, continue exploring the Trading Patterns section at Piprider.


