The Percentage Price Oscillator (PPO) is a valuable instrument in technical analysis, enabling traders to evaluate the intensity and path of a market trend. The indicator normalizes performance evaluation by converting the gap between two moving averages into a percentage.
This guide will cover everything from its formula to practical trading strategies, providing you with the knowledge to effectively incorporate the PPO into your analysis.
Key Takeaways
- The Percentage Price Oscillator shows the relationship between two moving averages as a percentage, making momentum easy to track.
- Allows for direct trend strength comparison between different assets, a key advantage over the MACD.
- Generates trading signals through zero line crosses, signal line crossovers, and price divergences.
- Acts as an effective filter for confirming trade entries and overall prevailing trend.
- Because it’s based on past price data, it should be combined with other indicators for best results.
1. What Is the Percentage Price Oscillator (PPO)?
The Percentage Price Oscillator (PPO) is a momentum indicator used in technical analysis, closely related to the MACD (popularized by Gerald Appel), that measures the percentage difference between a short-term and a long-term exponential moving average (EMA) (StockCharts, n.d.).
PPO’s primary purpose is to identify trend direction and strength. The key advantage of using a percentage is that it normalizes momentum, allowing traders to accurately compare different assets, like a high-priced and low-priced currency pair, on an equal footing.
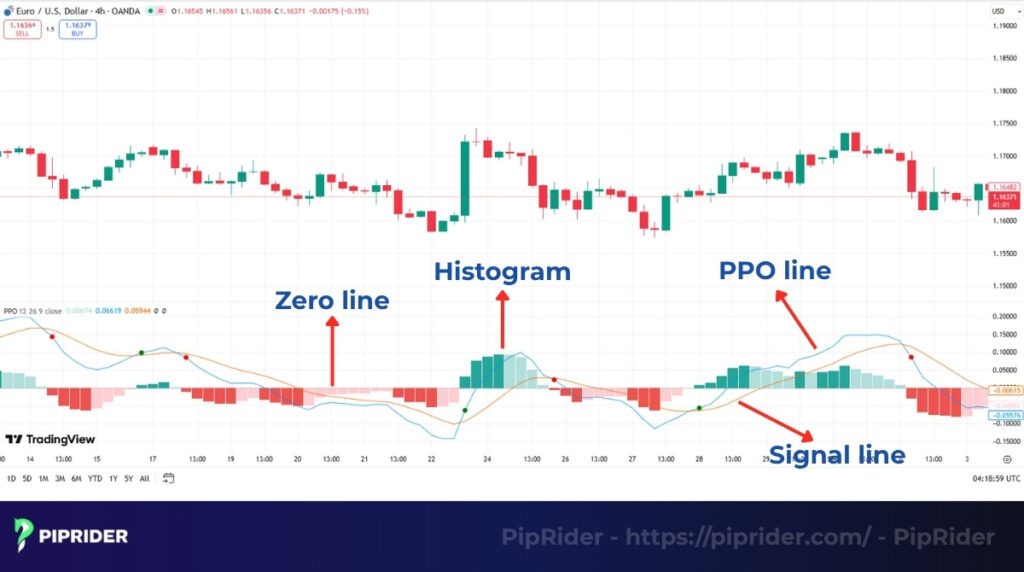
To provide trading signals, the PPO indicator is constructed from three core components:
- The PPO Line: The main line that represents the percentage difference between the two exponential moving averages, offering a smoother read than the volatile commodity channel index (typically the 12-period and 26-period EMAs)
- The Signal Line: A 9-period EMA of the PPO line. It is plotted alongside the PPO line to generate crossover trading signals.
- The Histogram: Shows the gap between the PPO line and the signal line. Its height visualizes the strength of current momentum.
The value of the PPO directly reflects the market’s underlying trend. When momentum increases, the PPO line will rise. Conversely, when momentum weakens or reverses, it will fall.
2. How to Calculate the Percentage Price Oscillator
The calculation for the Percentage Price Oscillator is straightforward and involves three key formulas. The standard settings are 12, 26, and 9 periods, which are used for the short-term exponential moving average, long-term exponential moving average, and signal line, respectively.
2.1. The Percentage Price Oscillator Formula
“Similar to the logic found in a chaikin oscillator, the primary PPO line is calculated by finding the difference between a short-term average (the 12-period EMA) and a long-term average (the 26-period EMA) and then dividing that result by the long-term average. The result is multiplied by 100 to express it as a percentage.
The formula is as follows:
PPO = [ (12-period EMA – 26-period EMA) / 26-period EMA ] * 100
2.2. Signal Line and Histogram
Once the PPO line is calculated, the other two components are derived from it. These elements help visualize the pace of the trend and generate clearer trading signals.
This is simply a 9-period exponential moving average of the PPO line calculated above.
Signal Line = 9-period EMA of the PPO Line
Histogram = PPO Line – Signal Line
2.3. Example
To understand the practical difference between PPO and MACD (Moving Average Convergence Divergence), let’s consider an example. Assume the price of EUR/USD has the following moving averages:
- 12-period exponential moving average: 1.0850
- 26-period exponential moving average: 1.0800
Using these values, the PPO would be: [(1.0850 – 1.0800) / 1.0800] * 100 = +0.46%
For the same data, the MACD value would simply be the absolute difference: 1.0850 – 1.0800 = 0.0050
The MACD’s value of 0.0050 is specific to this price level and difficult to compare with another asset. However, the PPO’s reading of +0.46% provides a clear, standardized insight: the short-term trend is 0.46% stronger than the long-term trend. This percentage value allows you to compare its momentum directly against any other currency pair or asset.
3. How to Set PPO on TradingView and MT4
Adding the Percentage Price Oscillator to your chart is a straightforward process, whether you prefer web-based platforms or desktop terminals. Here is how to set it up on the two most popular trading platforms.
On TradingView:
- Open your desired asset chart
- Click on the “Indicators, Metrics & Strategies” tab at the top of the screen
- Type “Percentage Price Oscillator” or “PPO” into the search bar
- Click on the standard indicator (usually under “Technicals”) to apply it to your chart
On MetaTrader 4 (MT4): Because the PPO is not always included as a default indicator on MT4, you may need to add it as a custom tool:
- Download a custom PPO indicator file (typically .mq4 or .ex4) from a trusted source and move it to your MT4’s folder
- Restart the MT4 platform and open the “Navigator” panel (Ctrl+N)
- Expand the “Indicators” -> “Custom” list
- Locate the PPO indicator and drag it directly onto your active chart
Adjusting the Settings: By default, the indicator will load with the standard parameters: 12 (short EMA), 26 (long EMA), and 9 (signal line). These defaults provide a balanced view of momentum suitable for most swing trading and trend-following strategies.
However, you can easily adjust these inputs within the indicator’s settings menu to match your trading style:
- To increase sensitivity (for short-term/day trading): Lower the inputs (for example, to 5, 13, 5). This makes the PPO react faster to recent price changes, though it may produce more false signals
- To decrease sensitivity (for long-term investing): Increase the inputs to filter out short-term market noise and focus on broader macroeconomic trends
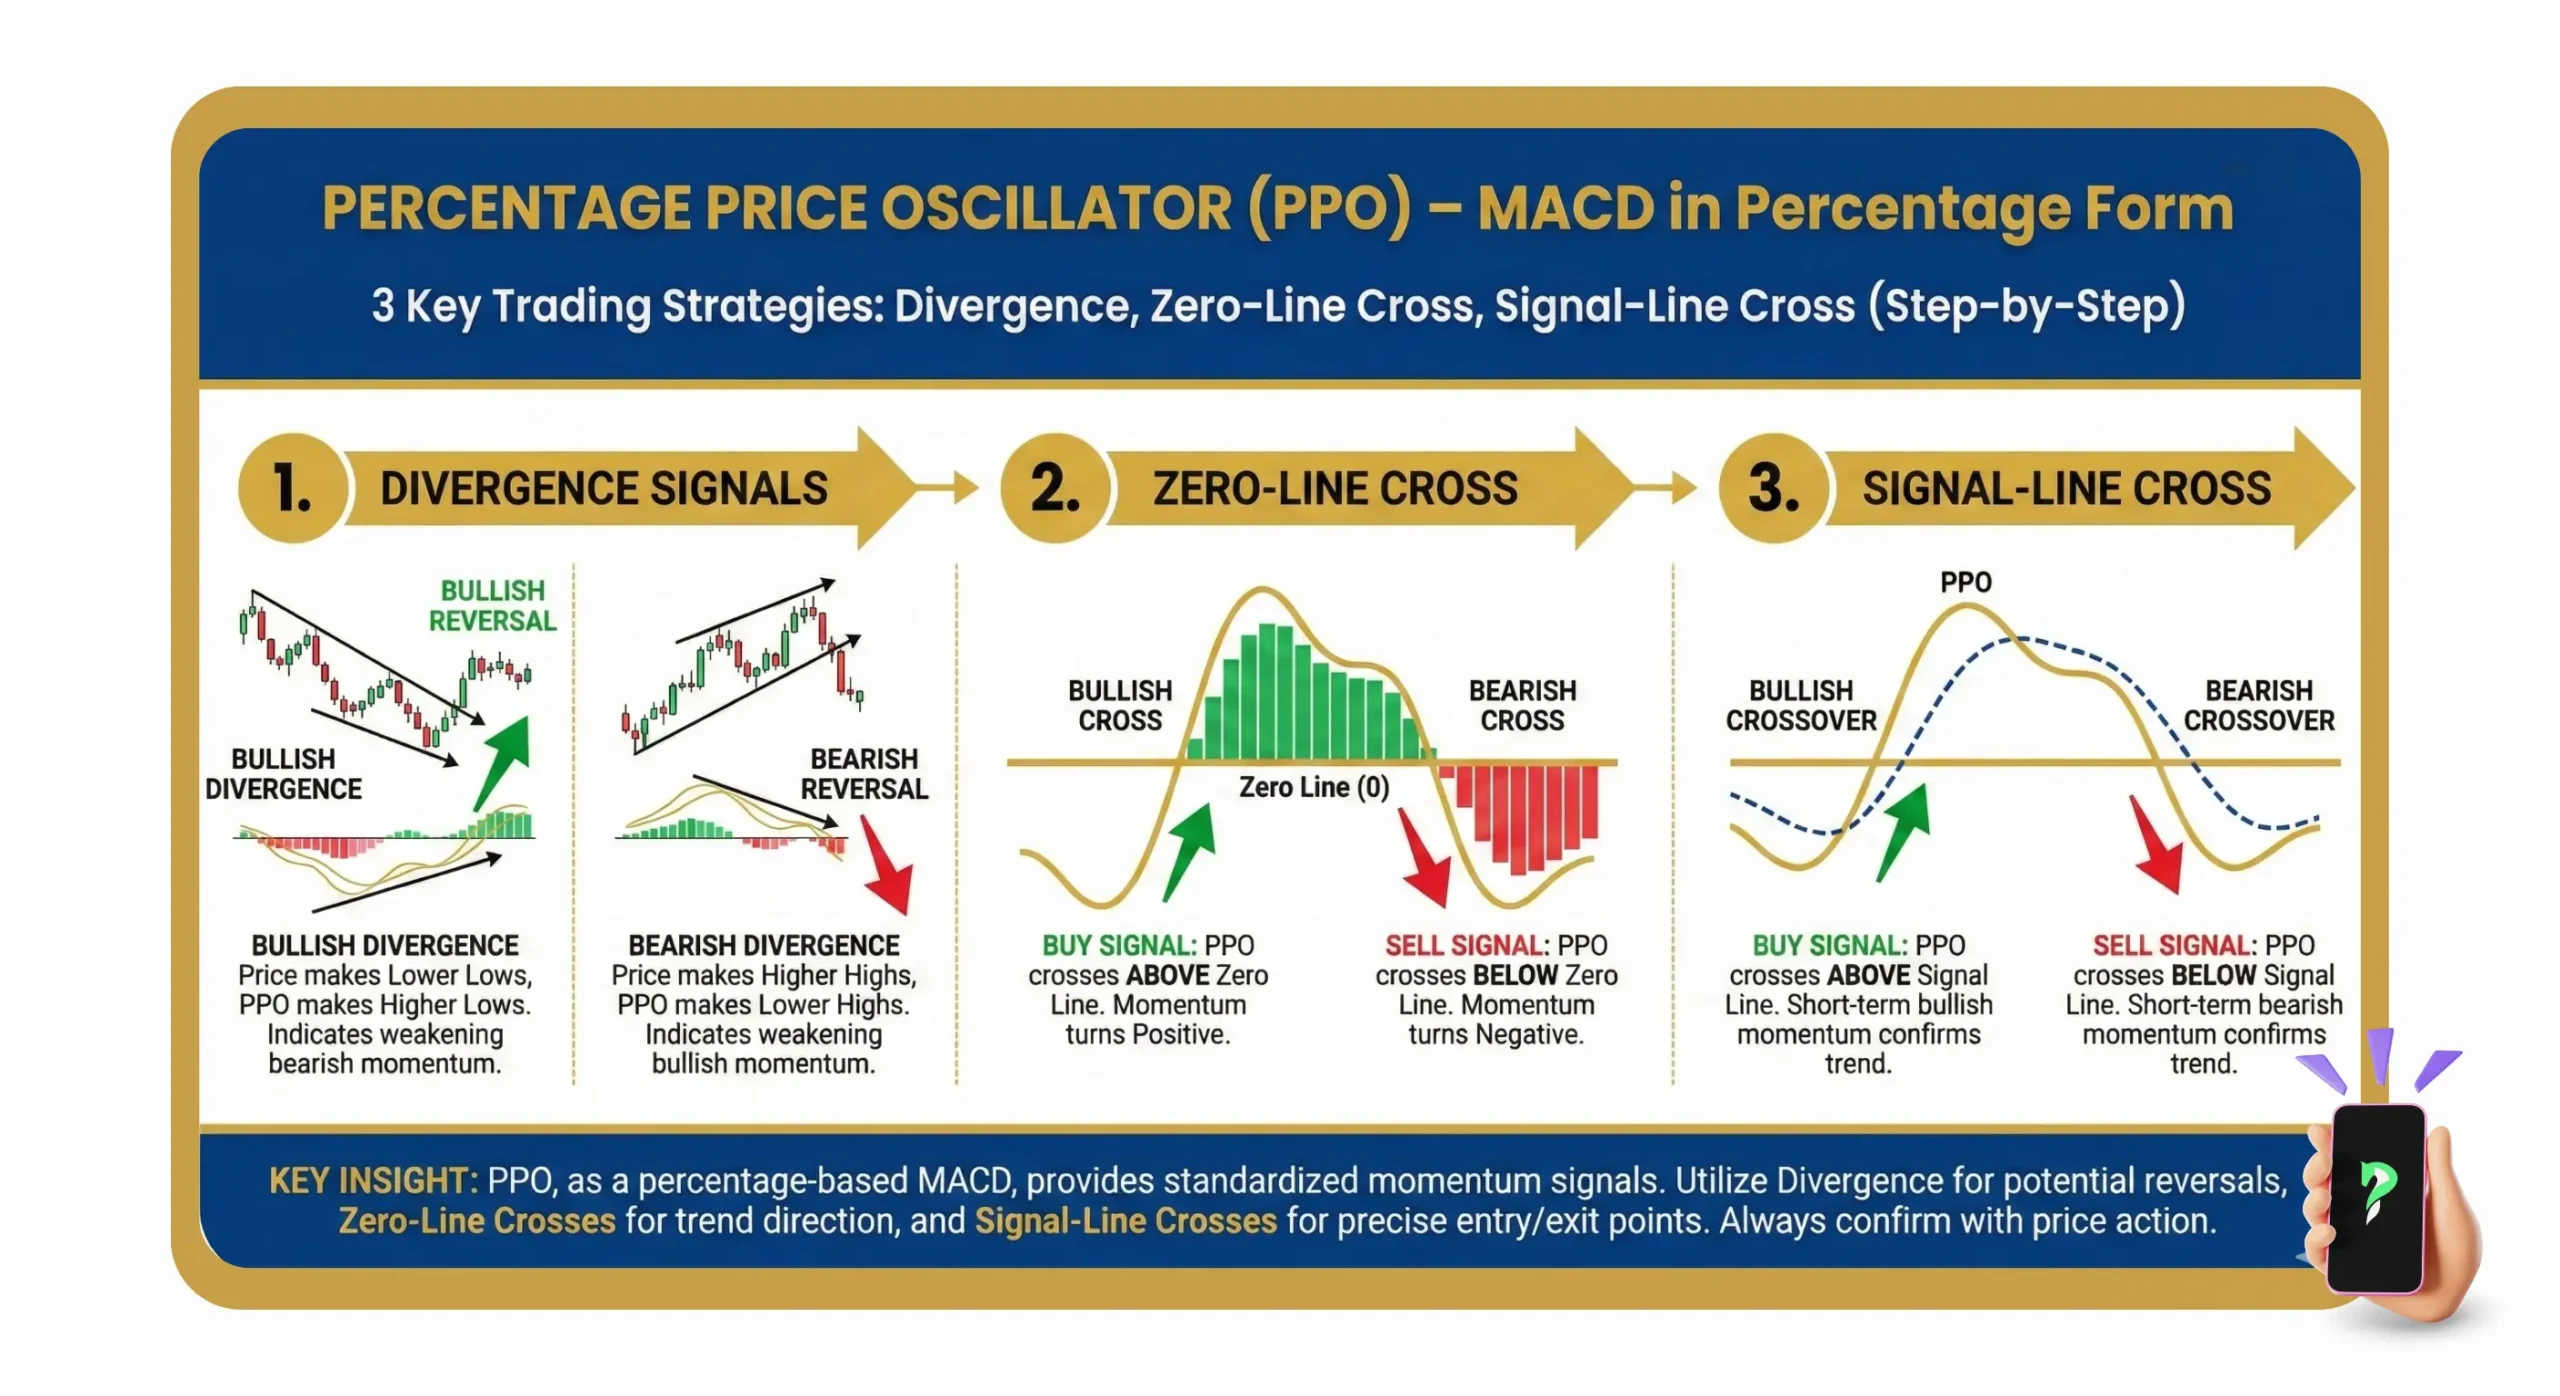
4. How to Interpret the PPO
Once the PPO is plotted on a chart, traders can interpret its movements to analyze price trends. There are four primary methods for reading the indicator: analyzing its position relative to the zero line, identifying signal line crossovers, spotting divergences, and monitoring the histogram.
4.1. Zero Line Interpretation
The zero line is the foundation of PPO analysis and acts as a general trend filter. It represents the point where the short-term and long-term exponential moving averages are equal. These crosses of the zero line, also known as centerline crossovers, often signify a major shift in the long-term trend.
- A positive reading (PPO > 0) indicates the short-term EMA is higher than the long-term EMA. This is generally a sign of an uptrend.
- A negative reading (PPO < 0) signifies the short-term EMA is lower than the long-term EMA, suggesting a downtrend.
4.2. Signal Line Crossovers
Signal line crossovers are the most common way traders use the PPO to generate potential entry points and exit points.
- Bullish Crossover (Buy Signal): This occurs when the PPO line crosses above the signal line. It suggests that momentum is shifting to the upside and can be interpreted as a potential signal to buy.
- Bearish Crossover (Sell Signal): This happens when the PPO line crosses below the signal line. It indicates that momentum is shifting to the downside and may be used as a signal to sell.
4.3. Divergences
Divergence analysis with the PPO is a powerful technique for spotting potential trend reversals. A divergence occurs when the direction of the PPO disagrees with the price. To validate these setups and avoid false signals, traders should look for confirmation via a market structure break or RSI divergence.
- Bullish Divergence: Price makes a new low, but the PPO makes a higher low. This suggests that selling pressure is weakening and a reversal to the upside could be imminent.
- Bearish Divergence: Price makes a new high, but the PPO makes a lower high. This indicates that buying pressure is fading and the price may be about to reverse downwards.
4.4. Histogram Analysis
The histogram provides an at-a-glance view of the momentum’s strength and direction. It measures the distance between the signal line & the PPO line.
- Expanding: When the bars on the histogram get taller, the gap between the PPO and signal lines is widening. This signifies that the current momentum is accelerating.
- Contracting: When the bars get shorter, the two lines are moving closer together. This shows that momentum is decelerating and can act as an early warning of a potential crossover.
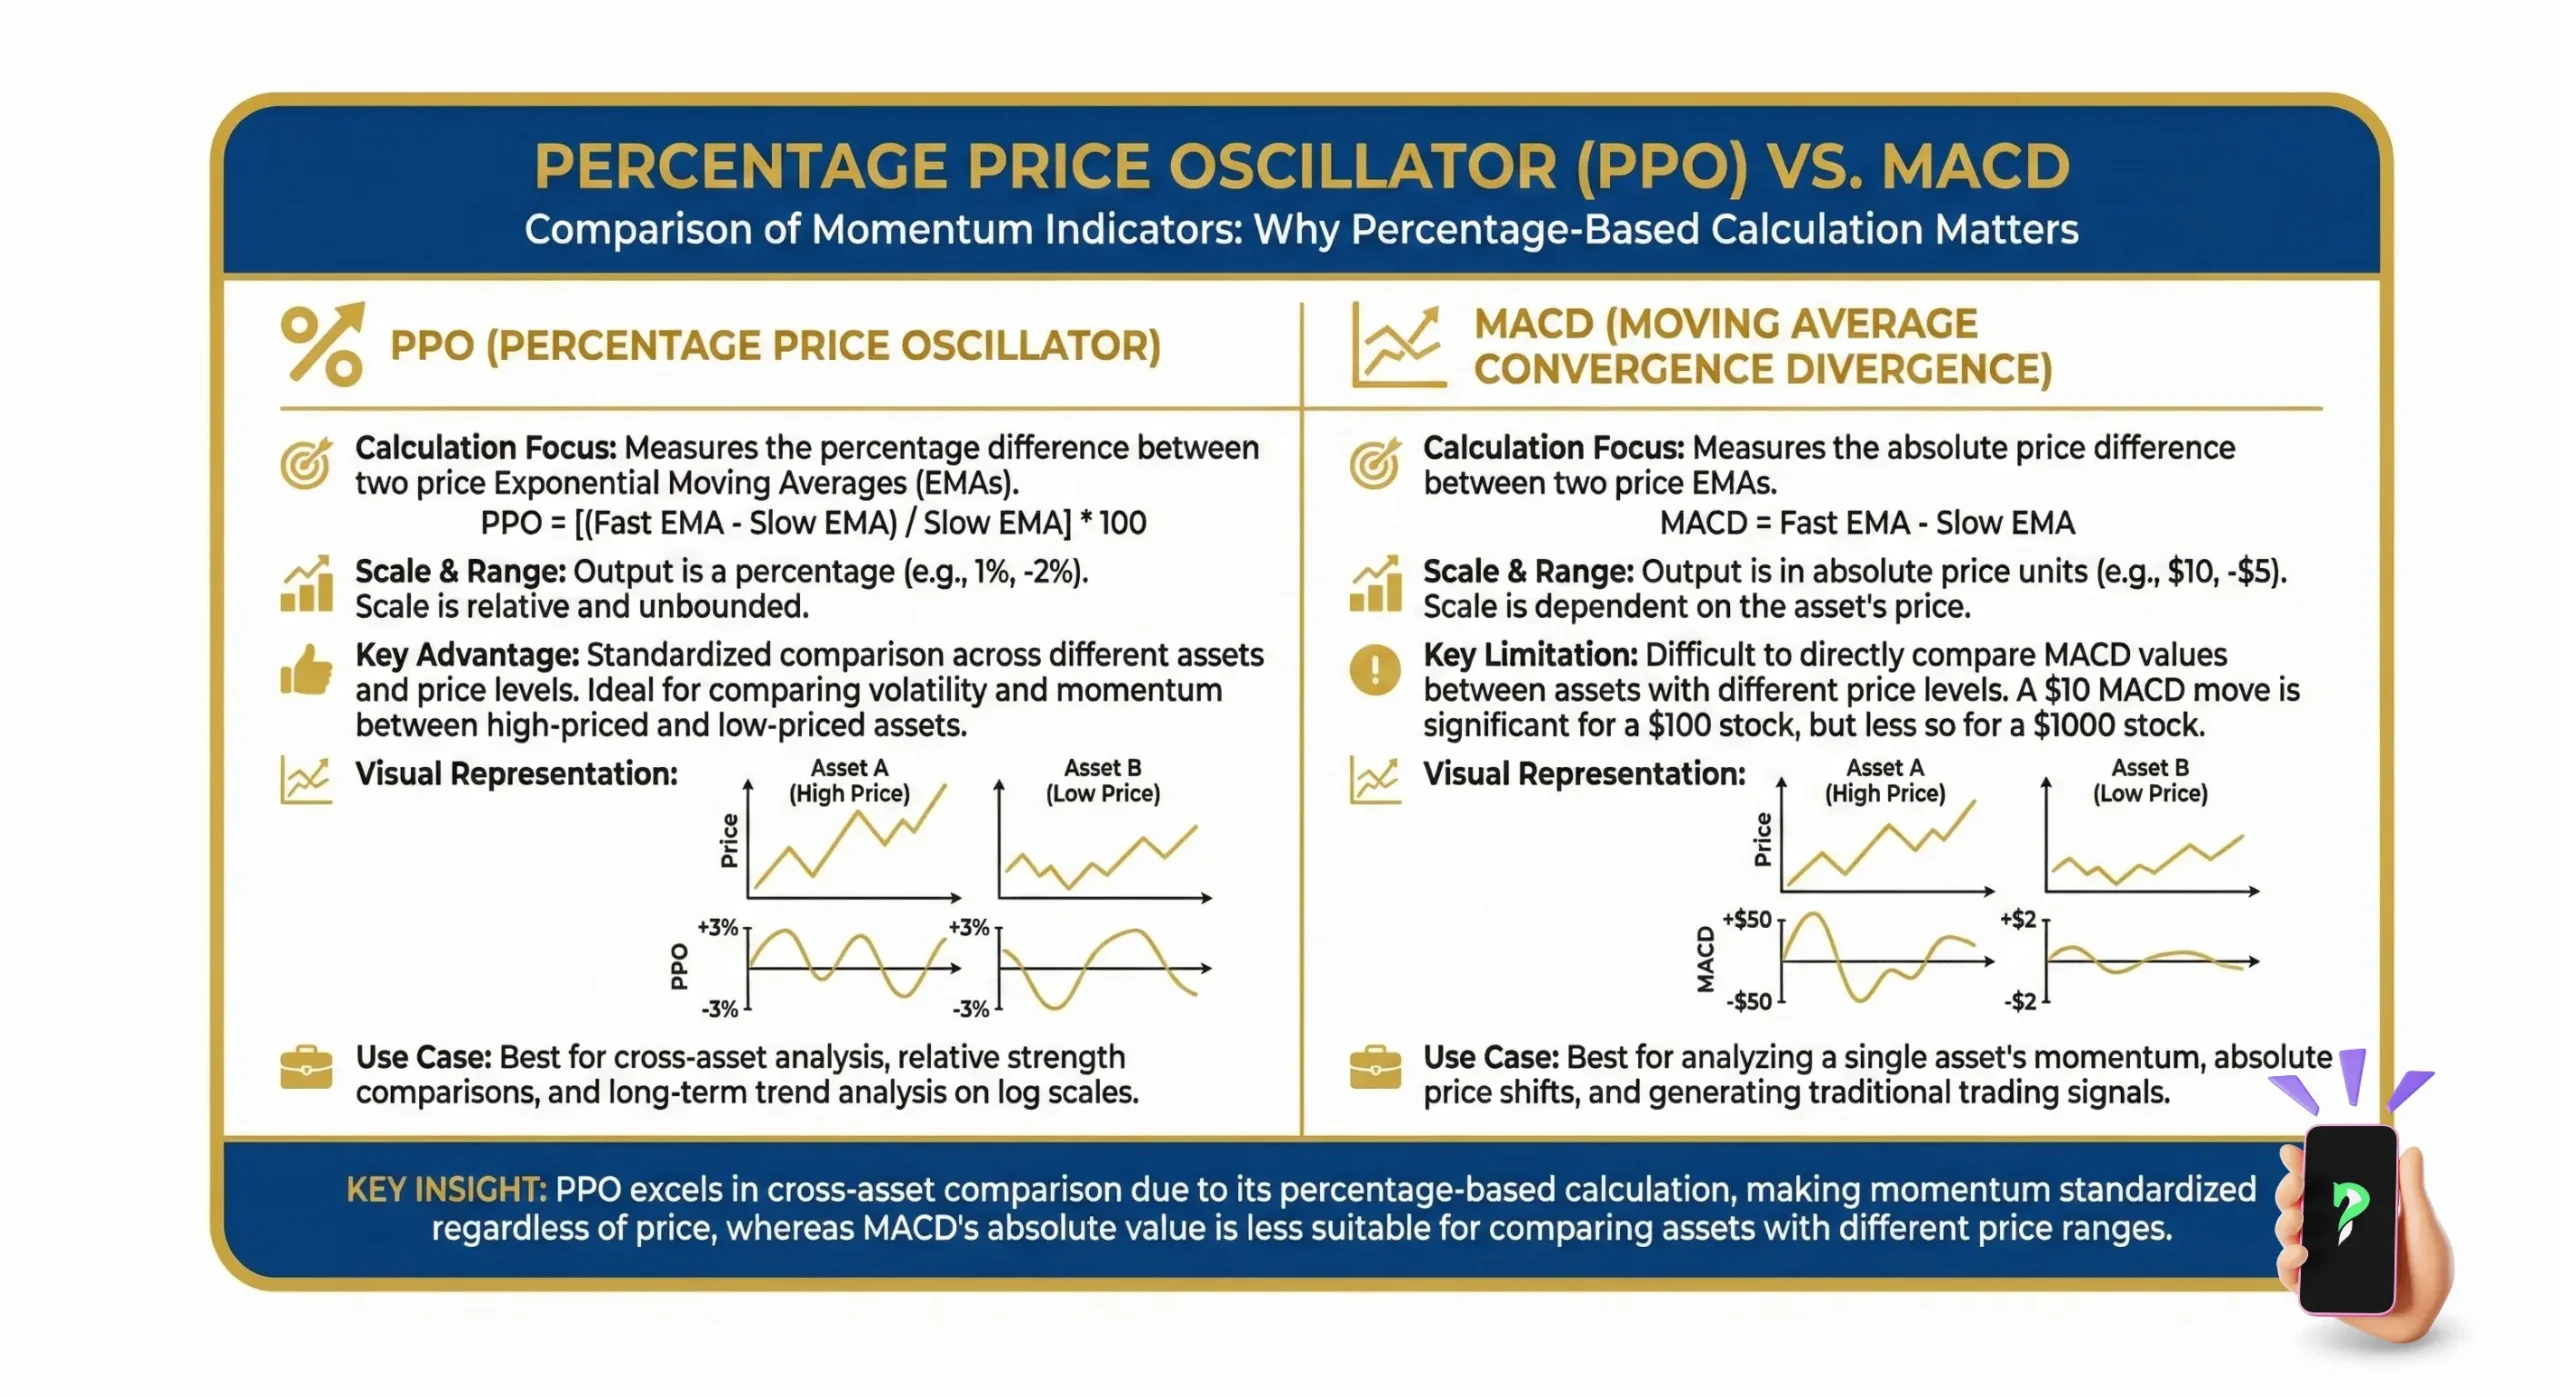
5. PPO vs. MACD: Key Differences
At first glance, the Percentage Price Oscillator (PPO) and the Moving Average Convergence Divergence (MACD) look nearly identical. Both are momentum oscillators that use two exponential moving averages, a signal line, and a histogram. They are also interpreted in much the same way, generating signals from crossovers and divergences.
However, one fundamental difference in their formulas sets them apart. The MACD calculates the absolute difference between two EMAs, while the PPO calculates that difference as a percentage (TC2000, n.d.). This single distinction gives each indicator a unique advantage and makes them suitable for different analytical tasks.
Here is a direct comparison of their key attributes:
| Aspect | Percentage Price Oscillator (PPO) | Moving Average Convergence Divergence (MACD) |
| Measurement Unit | Measures the difference as a percentage (%). | Measures the absolute value difference. |
| Primary Application | Ideal for comparing trend strength across different assets or markets. | Best for analyzing the trend strength of a single asset in isolation. |
| Sensitivity to Price | More stable and less affected by an asset’s price level. | Readings are directly influenced by the asset’s price. |
| Best Suited For | Cross-market analysis and comparing assets with different price volatility. | Standard momentum and swing trading analysis for one security. |
The main takeaway is that the PPO’s percentage value is normalized. This means you can use it to objectively compare the momentum of a high-priced asset against a low-priced one. The MACD’s absolute value is not comparable across different price scales, making the PPO a more versatile tool for traders analyzing multiple markets.
6. How to Trade with the Percentage Price Oscillator
The PPO is a versatile tool that can be used to build several effective trading strategies. While it can generate direct buy and sell signals, it is most powerful when used to filter trades and confirm the signals of other indicators. Below are three common strategies for trading with the PPO.
6.1. Strategy 1: The Signal Line Crossover
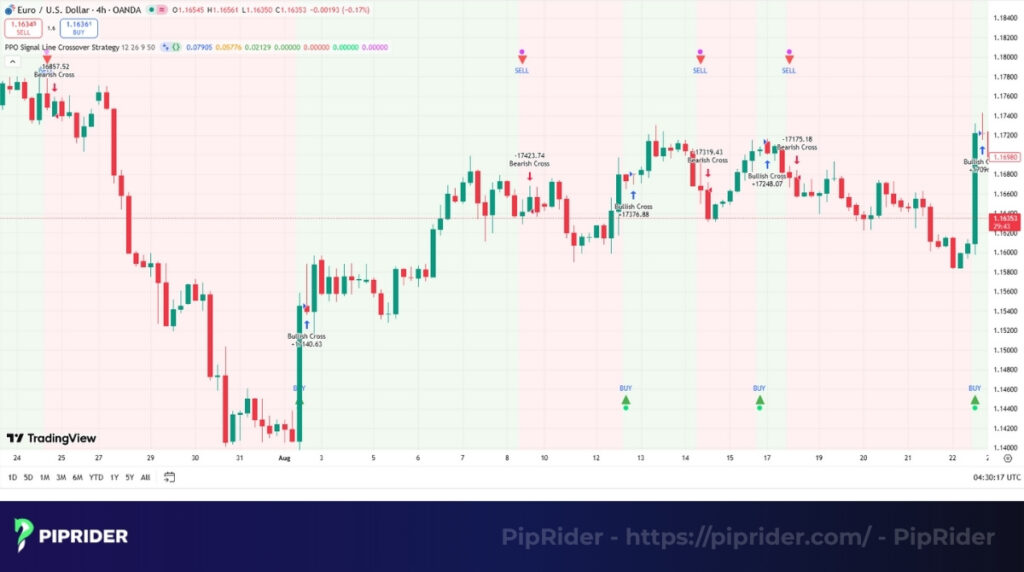
This is the most fundamental strategy for trading with the PPO. It involves using the interaction between the PPO line and the signal line to generate potential entry signals. While straightforward, this method is most effective in clearly trending markets.
- Buy Signal: A potential buy signal occurs when the PPO line crosses above the signal line. This is known as a bullish crossover and suggests that buying pressure is turning positive.
- Sell Signal: A potential sell signal occurs when the PPO line crosses below the signal line. This bearish crossover indicates that selling pressure is shifting to the negative.
6.2. Strategy 2: The Zero Line Trend Filter
To improve the quality of crossover signals and avoid taking risky counter-trend trades, you can use the zero line as a trend filter. This conservative approach ensures you are only trading in the direction of the broader market momentum.
- For Buy Signals: Only consider taking long (buy) trades when the PPO is trading above the zero line. A bullish crossover that happens above the zero line is considered a higher-probability signal.
- For Sell Signals: Only consider taking short (sell) trades when the PPO is trading below the zero line. This confirms that the market is in an established downtrend.
6.3. Strategy 3: Divergence for Reversal Confirmation
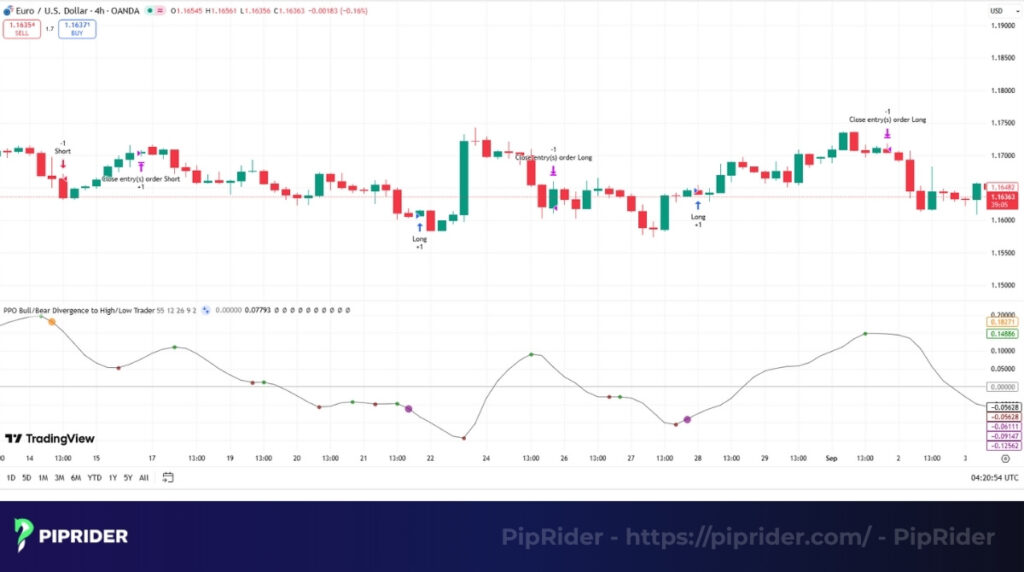
This advanced strategy uses PPO divergence to warn of potential trend reversals. To improve accuracy, the signal should always be confirmed with another momentum tool, like the Relative Strength Index (RSI). For instance, a bullish divergence on the PPO is a much stronger buy signal if the RSI is showing a similar bullish divergence at the same time.
Essential “No-Trade” Rules to Avoid Whipsaws
While the strategies above are effective, knowing when not to trade is equally important. To avoid false signals and whipsaws (rapid price reversals), adhere to these four rules:
- Avoid flat PPO lines: Skip trades when the PPO and signal lines are “flat” and hugging the zero line. This indicates a choppy, range-bound market where crossovers will frequently fail.
- Align with the trend: Only take signal line crossover trades that align with the direction of your primary trend filter.
- Require confirmation for divergence: Divergence is merely an early warning, not an immediate entry trigger. Always wait for price action confirmation, such as a market structure break or a definitive candle close, before taking the trade.
- Anchor your Stop Loss to structure: Always place your Stop Loss (SL) based on recent market structure (such as swing highs or swing lows). Never rely on a “feeling” or wait for a reverse indicator crossover to exit a losing position.
Finally, no indicator is foolproof. Always combine signals from the PPO with other forms of technical analysis, proper risk management, and a clear understanding of the current market conditions before entering any trade.
7. Using PPO to Compare Different Securities
One powerful and unique application of PPO is its ability to compare momentum across different securities on an apples-to-apples basis. This is the primary advantage it holds over the MACD. Because PPO is normalized to a percentage scale, a +2% reading on one asset means the exact same thing as a +2% reading on another, regardless of their price.
This feature is incredibly useful for traders and investors managing a multi-asset portfolio. By plotting the PPO for various stocks, indices, or ETFs, you can quickly gauge their relative strength. It allows you to answer critical questions like, “Which market sector has the strongest momentum right now?” Or which currency pair is losing momentum the fastest?
For example, imagine you want to compare the momentum between the S&P 500 index (via the SPY ETF) and the Nasdaq-100 index (via the QQQ ETF). By applying the PPO to both chart patterns, you can get a direct, objective comparison. If the PPO for QQQ is at +3.5% while the PPO for SPY is only at +1.5%, it tells you that the upward upward force is currently more than twice as strong in the tech-heavy Nasdaq-100. This insight helps traders allocate capital to the strongest-performing assets, especially during periods of high volatility.
8. Benefits and Limitations of the PPO
Like any technical tool, the Percentage Price Oscillator has distinct advantages and disadvantages. Acknowledging both is crucial for using the indicator effectively and managing risk. A successful trader knows not only what an indicator can do but also what it cannot.
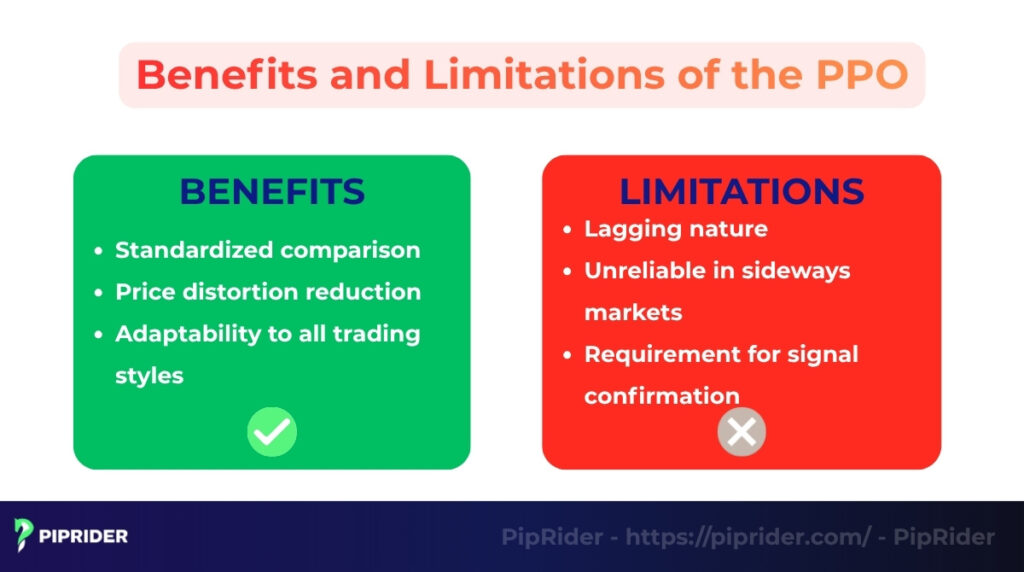
8.1. Benefits
The PPO’s primary strengths lie in its unique calculation and resulting versatility.
- Standardized comparison: Its greatest benefit is that it measures momentum as a percentage. This allows traders to make objective, apples-to-apples comparisons of momentum across assets with vastly different price levels.
- Price distortion reduction: The PPO reading is not influenced by an asset’s absolute price. A significant price move will be reflected consistently, whether on a low-priced or high-priced security, leading to more stable momentum analysis.
- Adaptability to all trading styles: The indicator’s settings can be easily adjusted to fit any timeframe. This makes it equally useful for short-term scalpers and long-term trend followers.
8.2. Limitations
The PPO’s weaknesses are common among momentum oscillators and stem from its reliance on past price action.
- Lagging nature: Because the PPO is based on moving averages of past prices, its signals will always lag behind real-time price movements. This can sometimes result in delayed entry and exit signals.
- Unreliable in sideways markets: In a non-trending or ranging market, the PPO can generate multiple false signals as it hovers around the zero and signal lines. This series of false crossovers is often called “whipsaws.”
- Requirement for signal confirmation: Using the PPO in isolation is not recommended. For higher-probability trades, its signals should always be confirmed with other tools. Furthermore, unlike bounded oscillators used in a demarker indicator strategy, the PPO is not ideal for identifying specific overbought conditions or oversold conditions on its own.
9. A Illustrative Example on a Percentage Price Oscillator Chart
Theory is important, but applying technical analysis by seeing the PPO in action is the best way to understand how it works. Let’s analyze a hypothetical EUR/USD daily chart to see how these signals can be combined to identify trading opportunities. The daily and 4-hour (4H) timeframes are excellent starting points for using the PPO.
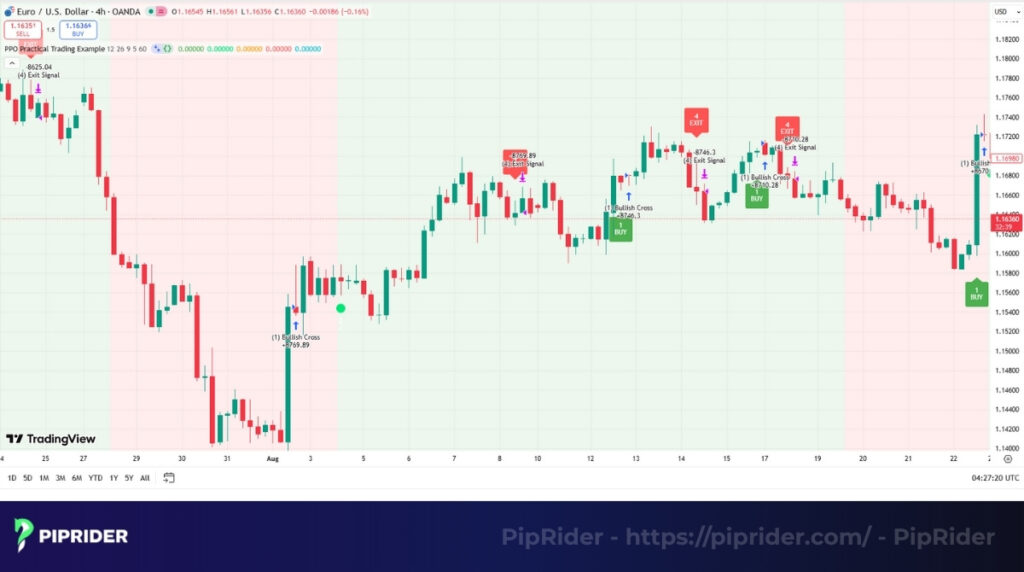
The chart above illustrates how a trader could interpret PPO signals throughout a market trend. The key events are marked from 1 to 4.
- The Buy Signal (Bullish Crossover): At point (1), the PPO line crosses above the signal line. This bullish crossover signals that momentum is shifting to the upside and provides a potential entry point for a long (buy) trade.
- The Trend Confirmation (Zero Line Cross): Shortly after, at point (2), the PPO indicator crosses above the zero line. This is a strong confirmation that the broader trend has turned bullish, giving traders more confidence in their long position.
- The Warning Sign (Bearish Divergence): At point (3), a critical warning sign appears. The price pushes to a new high, but the PPO fails to do the same, creating a lower high. This is a classic bearish divergence, suggesting that the upward momentum is weakening.
- The Exit Signal (Bearish Crossover): The warning from the divergence is confirmed at point (4) when the PPO line crosses below the signal line. This bearish crossover is a clear signal to exit the previous long trade to secure profits and could even be used by aggressive traders as an entry signal for a new short (sell) position.
10. Frequently asked questions about Percentage Price Oscillator
11. The Bottom Line
The Percentage Price Oscillator (PPO) is a powerful indicator that offers a more standardized view of trend strength thanks to its percentage-based scale. This makes it an exceptional tool for comparing momentum across multiple assets and for confirming overall trend. For the highest probability trades, always combine the PPO’s signals with other forms of technical analysis, such as the RSI, volume, or price action.
To discover more essential tools for your trading strategy, explore our comprehensive list of technical indicators in the Learn Forex section at Piprider.
Infographic Section
-
Comparision of Momentum indicators -
3 key trading strategies -
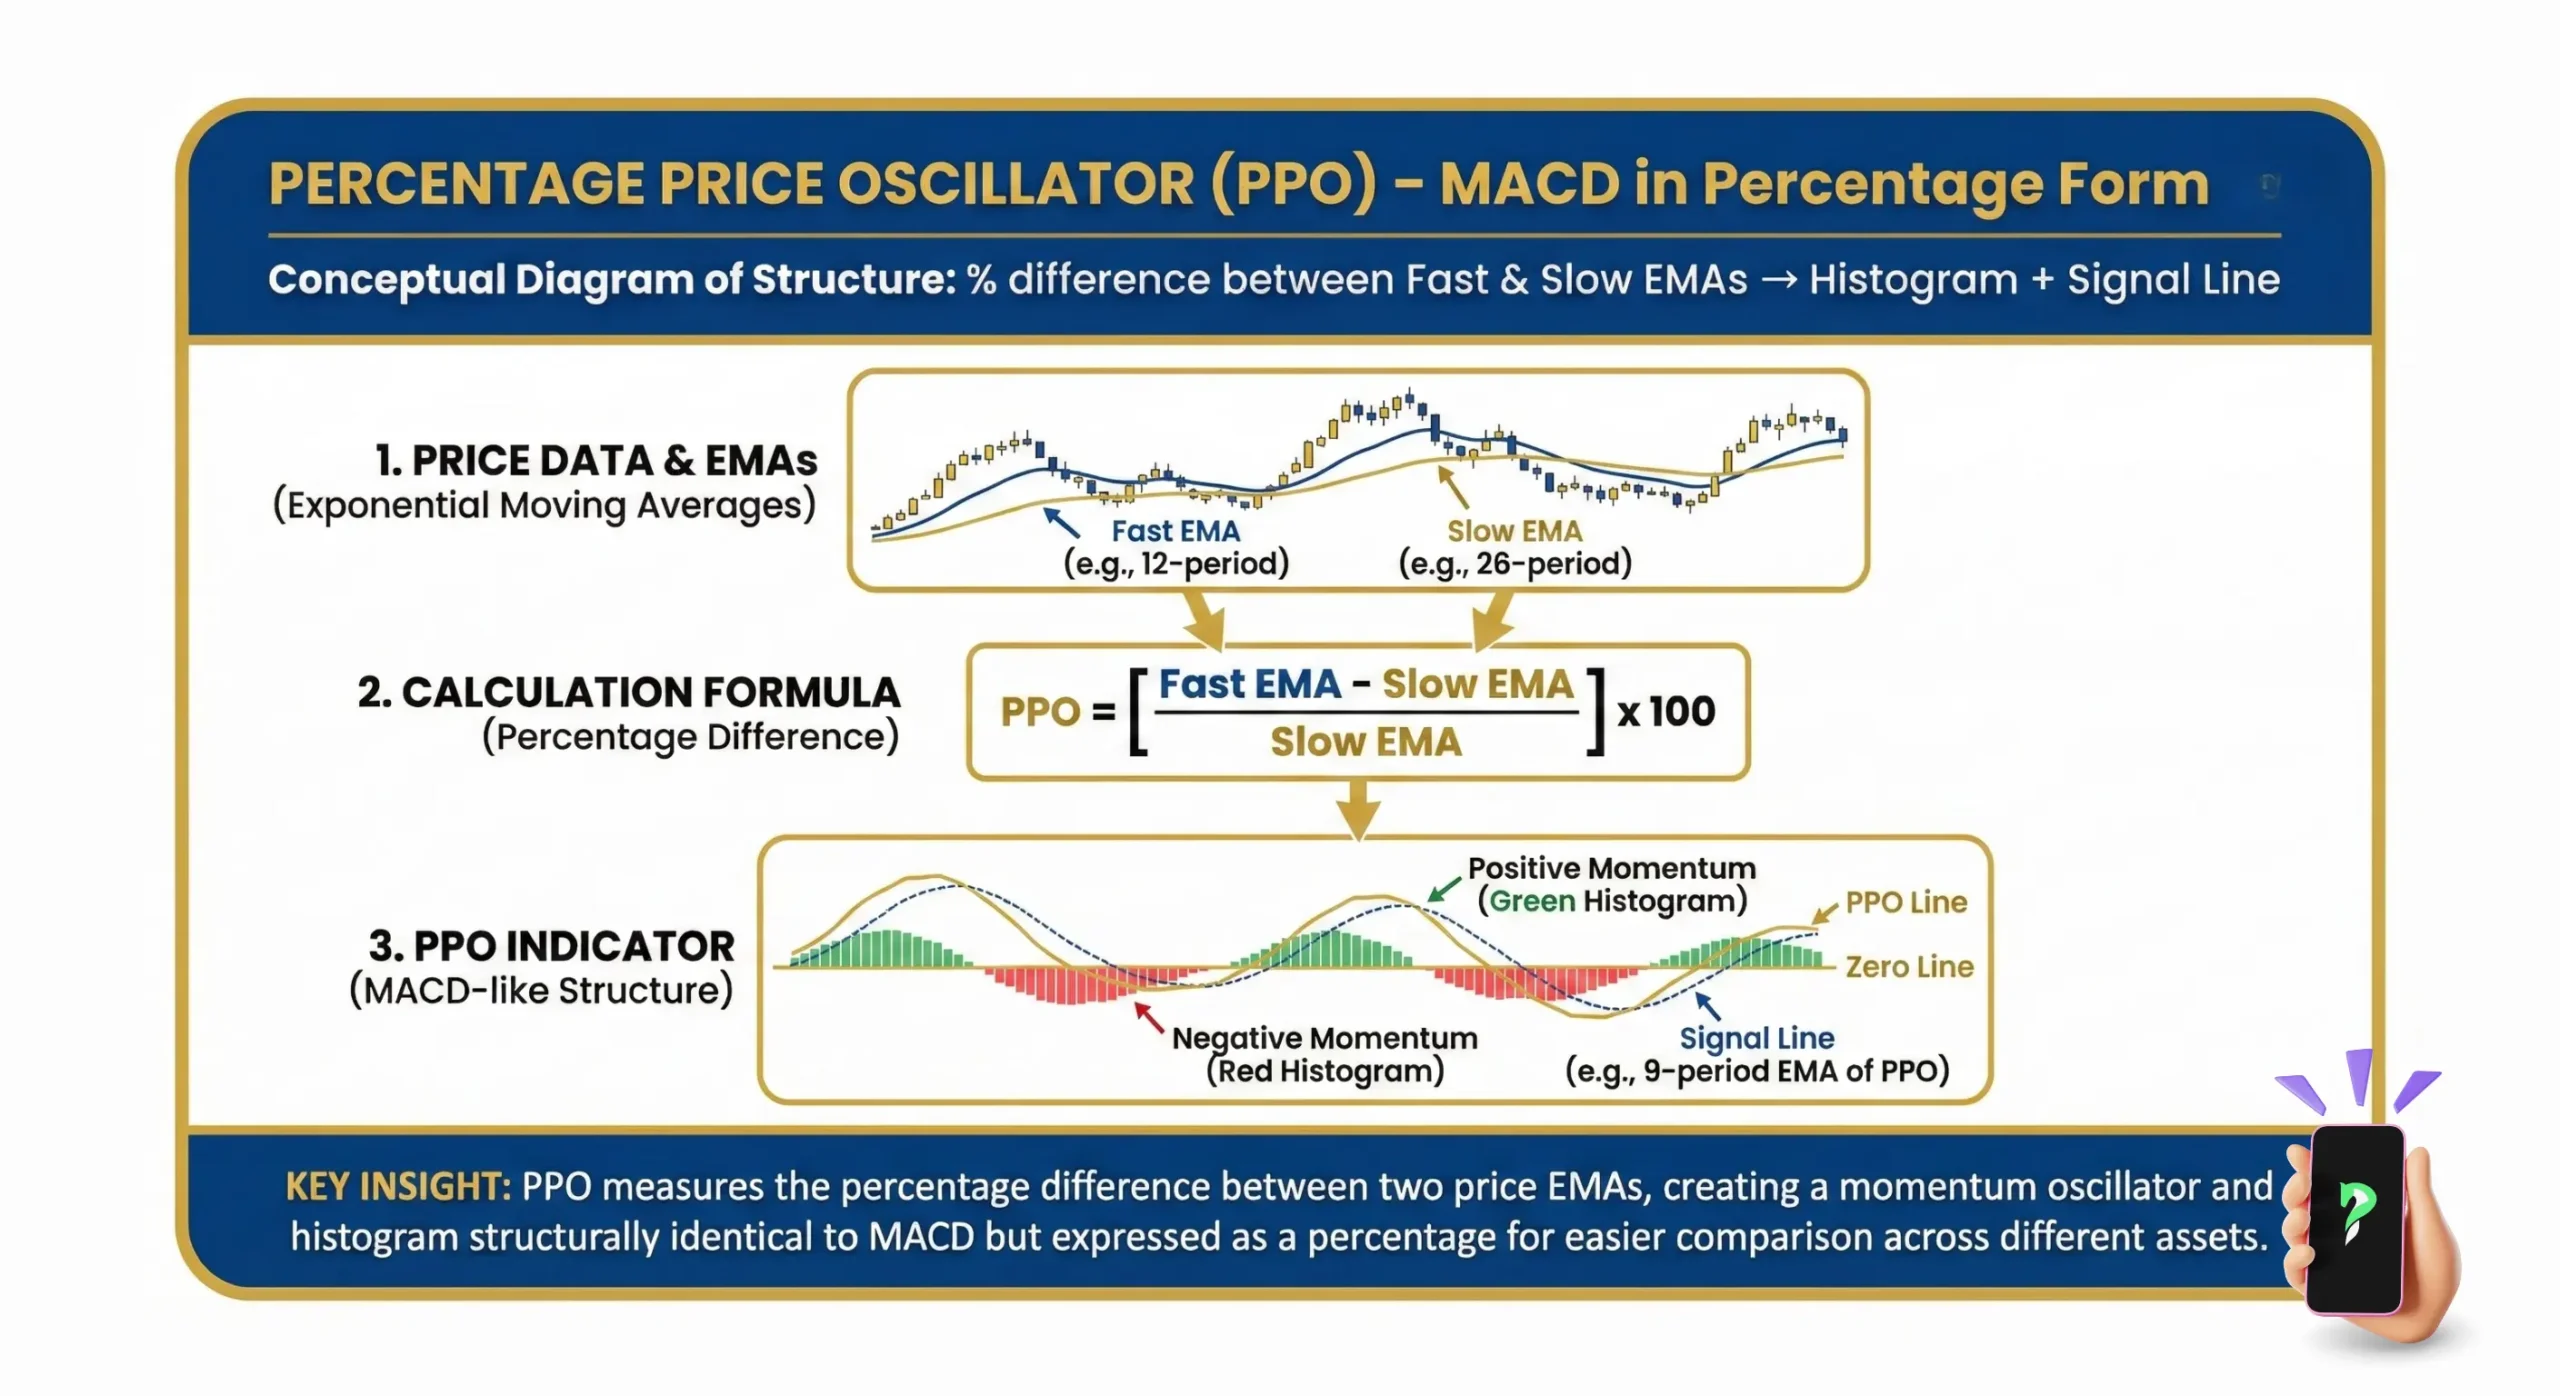
conceptual diagram of structure