
Are you searching for a responsive oscillator to help pinpoint trend fatigue but find the RSI can be overly erratic at times? The DeMarker indicator (DeM), a powerful yet often underutilized tool, offers a compelling solution. This indicator presents a distinct view of market dynamics and serves as a fantastic alternative or companion to the RSI.
The DeMarker indicator is most useful for spotting trend exhaustion, overbought/oversold exits, and divergence. It works best as a confirmation tool around turning points, not as a standalone entry command in strong trends.
This manual will be your complete guide to the DeM. We’ll dive into its unique calculation, explain how to interpret its signals, and provide three actionable strategies for applying it effectively in the Forex market.
Key Takeaways
- The DeMarker is a tool that measures market pressure to forecast trend reversals.
- Its signal is often smoother than the RSI, helping to filter out market noise.
- The 0.3 and 0.7 thresholds help identify potential oversold/overbought zones.
- One of the most powerful signals is divergence between the DeM and price.
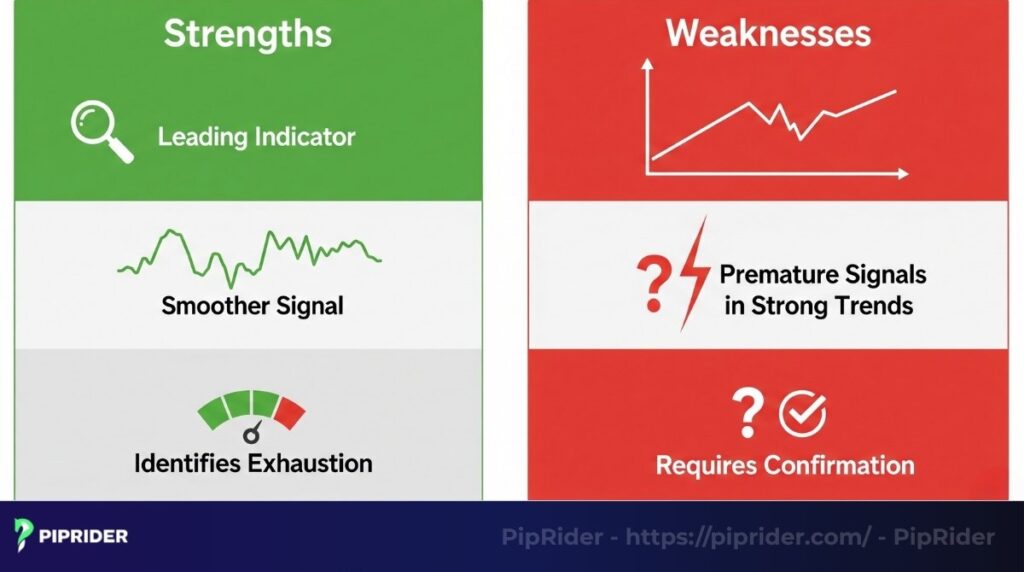
- As a leading indicator, DeM’s signals should always be confirmed by other tools.
1. What is the DeMarker indicator?
DeMarker (DeM) at a Glance:
- Core Function: A momentum oscillator designed to measure underlying demand and pinpoint trend exhaustion.
- Primary Edge: Best for spotting high-probability overbought/oversold exits and structural divergences.
- Key Advantage: Serves as a smoother, less erratic alternative (or complement) to the RSI.
- Strict Rule: Should never be used as a standalone entry command; always requires price action confirmation.
The DeMarker indicator is a technical tool from the oscillator family, and its central purpose is to gauge the underlying demand for an asset. It uses this information to evaluate the current trend’s vitality and, more importantly, to identify when that trend is likely losing drive. This makes it a crucial component of technical analysis.
The DeM indicator was invented by Thomas DeMark, a highly influential figure in technical analysis (Investopedia, n.d.). DeMark is a market visionary celebrated for creating a suite of advanced trading tools (like the TD Sequential) employed by major hedge funds and financial institutions.
The DeMarker indicator relies on these core components to measure market pressure and generate signals:
- DeM-High (Demax): Measures upward pressure by calculating the difference between the current high and the previous high. If the result is negative or zero, this value is reset to zero.
- DeM-Low (Demin): Measures downward pressure by calculating the difference between the previous low and the current low. If the result is negative or zero, this value is reset to zero.
- The lookback period: This is the ‘N’ value, which determines the number of periods used to smooth the DeMax and DeMin values. A common setting is 14.
- The final DeM value: The final indicator is calculated by dividing the smoothed DeMax by the sum of the smoothed DeMax and DeMin. This produces a single line that oscillates between 0 and 1 (or 0 and 100).
- Overbought and Oversold levels: The indicator’s primary function is to identify these levels, which are typically set at 0.7 and 0.3 and signal potential reversals.
2. Why choose DeMarker? 3 key advantages in Forex trading
The DeMarker provides a distinct edge by filtering out intraday noise, making its divergence signals significantly cleaner than those of highly sensitive oscillators like the Stochastic (Quantified Strategies, 2025).
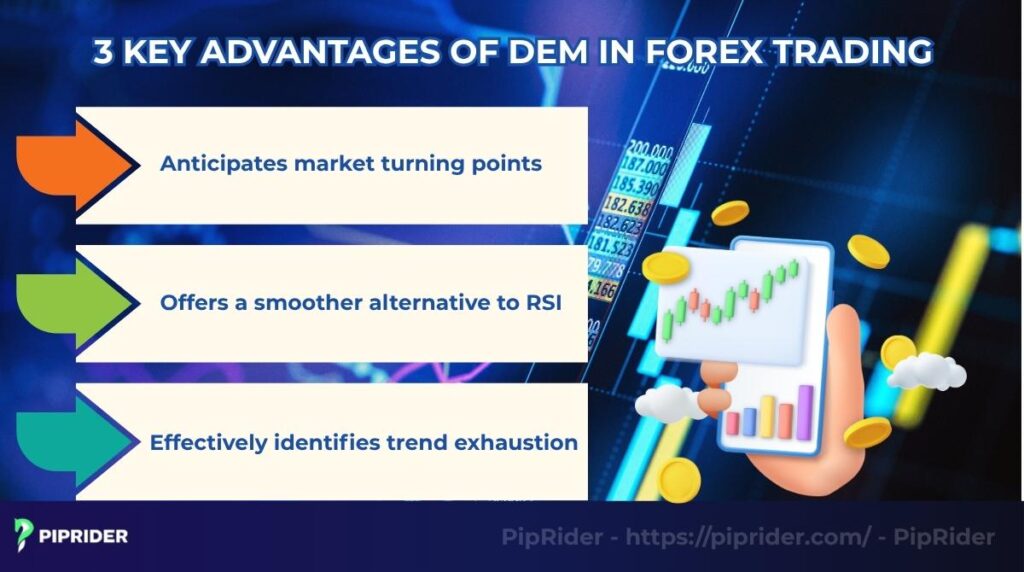
- Anticipates Market Turning Points: As a leading indicator, the DeM often generates signals before a price reversal becomes obvious on the chart. This early warning system allows traders to proactively manage their exits or prepare high-reward counter-trend setups before the broader market reacts.
- Provides a Smoother Alternative to the RSI (Relative Strength Index): The RSI often frustrates traders with “spiky” or erratic movements that can trigger false entries. The DeM’s unique calculation smooths out these minor price jitters. This built-in noise filter keeps your focus locked on legitimate shifts in momentum rather than irrelevant intraday volatility.
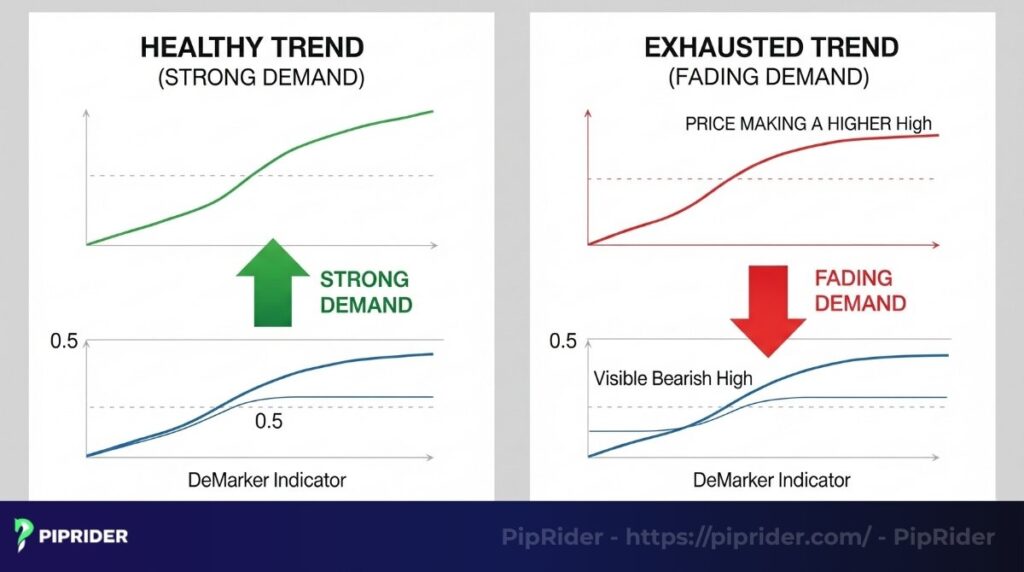
- Pinpoints Trend Exhaustion: By measuring the underlying demand behind a price move, the DeM detects when a trend is mathematically running out of fuel. It clearly highlights divergences—such as when the price continues to inch higher, but the internal buying power is demonstrably evaporating.
3. The Mathematics Behind the DeMarker Indicator
Most traders will never calculate the DeM by hand. The value of understanding the formula is knowing exactly why the DeM reacts more smoothly than the RSI in many market conditions.
While the RSI compares the magnitude of recent gains to recent losses based strictly on closing prices, the DeMarker focuses on the intraday extremes (Highs and Lows) to gauge the true absolute limits of buying and selling pressure.
The calculation follows a straightforward three-step logical process:
Step 1: Calculate DeMax (Buying Pressure)
- If the current high is greater than the previous high:
DeMax = Current High - Previous High - If the current high is lower than or equal to the previous high:
DeMax = 0
Step 2: Calculate DeMin (Selling Pressure)
- If the current low is lower than the previous low:
DeMin = Previous Low - Current Low - If the current low is higher than or equal to the previous low:
DeMin = 0
Step 3: Apply Smoothing and Calculate Final Value
The raw DeMax and DeMin values are then smoothed using a Simple Moving Average (SMA), typically over a standard 14-period lookback. The final DeMarker value is calculated as a ratio of these smoothed forces:
DeM = SMA(DeMax) / [SMA(DeMax) + SMA(DeMin)]
The mathematical result is an oscillator bound tightly between 0 and 1 (often scaled from 0 to 100 on platforms like TradingView or MT4), providing a clean, filtered visual representation of directional momentum.
4. How to read the DeM Indicator on a Forex chart
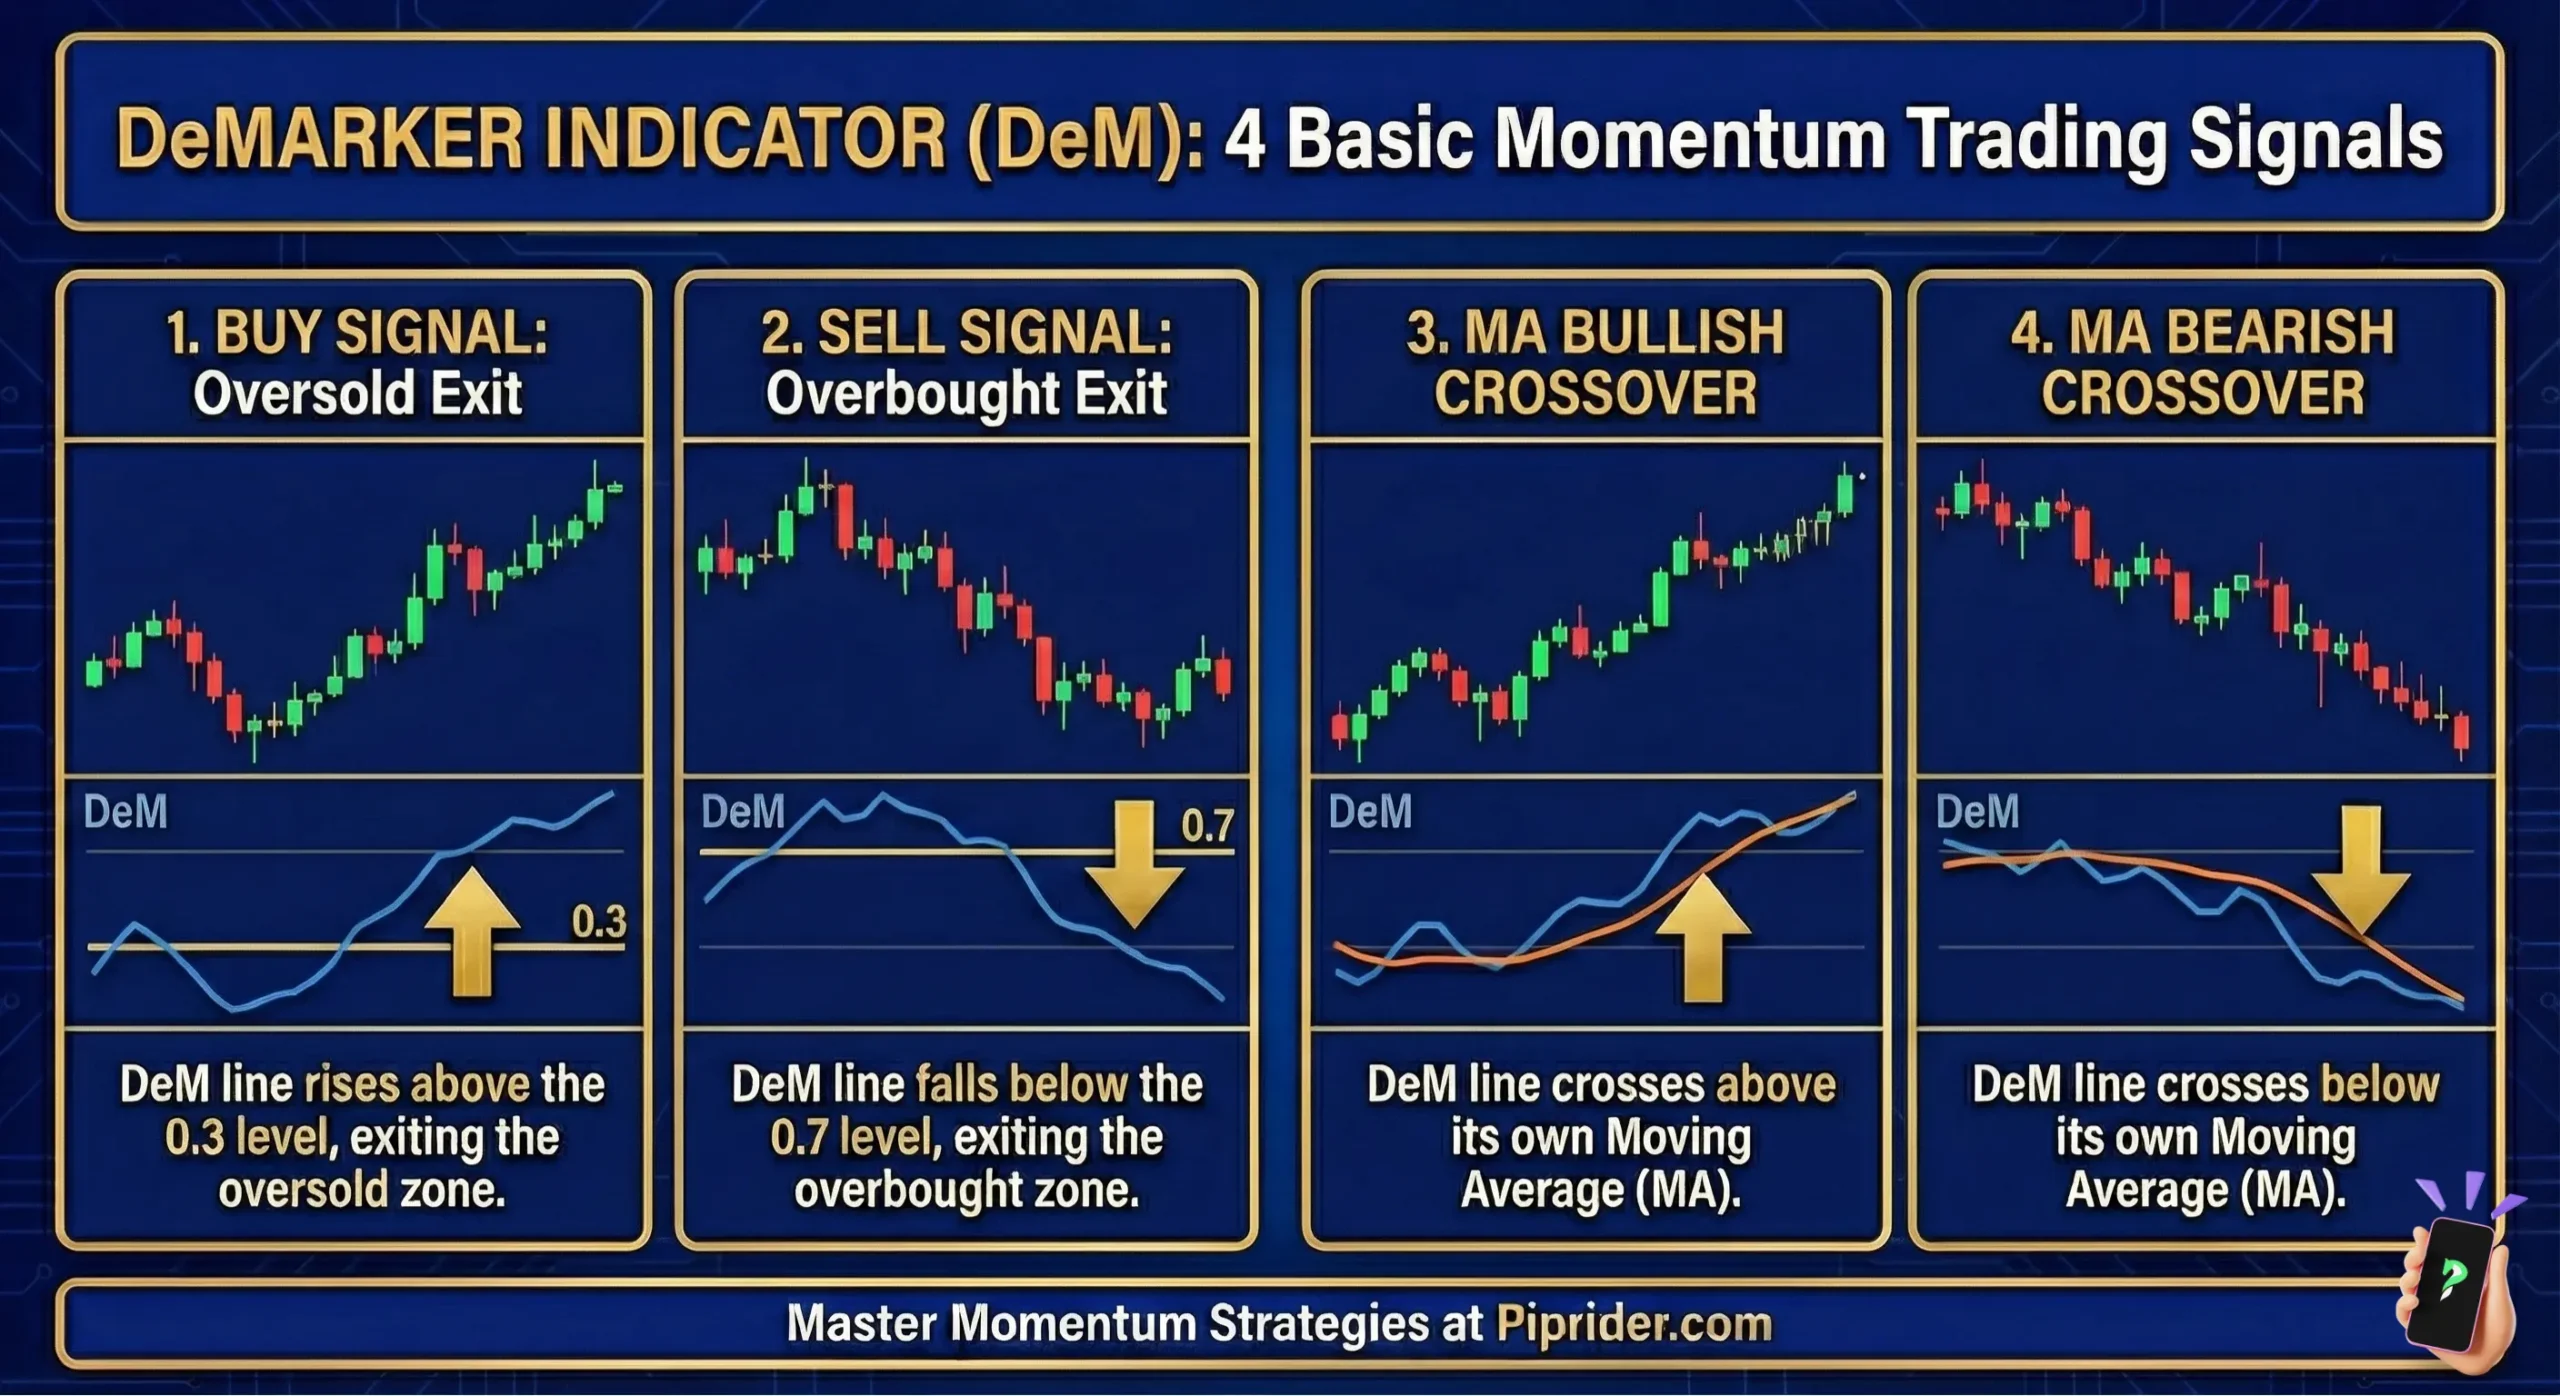
Interpreting the DeMarker (DeM) is not just about identifying static zones; it requires an actionable interpretation framework. Treating the 0.7 or 0.3 levels as immediate buy or sell triggers is a common amateur mistake. These levels serve as benchmarks for assessing strength, alerting you to potential turning points, and providing insights into the broader trend direction.
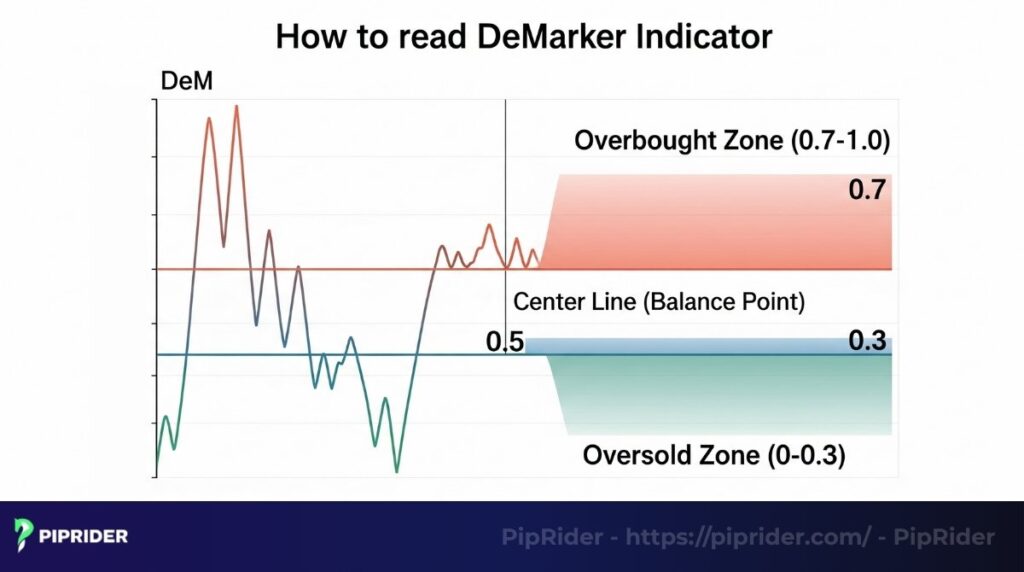
The following matrix transforms theoretical definitions into a strict execution protocol:
| DeM Level | Market Context (The “What”) | Actionable Protocol (The “How”) |
|---|---|---|
| Above 0.7 | Overextended (Overbought): The market is potentially stretched to the upside. The current trend may be nearing exhaustion. | Wait: Do not sell immediately. Wait for the DeM line to cross back below 0.7, strictly combined with bearish price action confirmation. |
| Below 0.3 | Undervalued (Oversold): The market is potentially stretched to the downside. Selling pressure is likely losing its fuel. | Wait: Do not buy immediately. Wait for the DeM line to cross back above 0.3, strictly combined with bullish price action confirmation. |
| Above 0.5 | Bullish Bias: Buyers are currently maintaining control of the underlying momentum. | Trend Filter: Use as a secondary confirmation tool to prioritize Long (buy) setups and avoid counter-trend shorts. |
| Below 0.5 | Bearish Bias: Sellers are currently maintaining control of the underlying momentum. | Trend Filter: Use as a secondary confirmation tool to prioritize Short (sell) setups and avoid counter-trend longs. |
The “Snap-Back” Rule
The most crucial takeaway from this framework is patience. The DeM indicator can remain pinned above 0.7 or below 0.3 for extended periods during strong macroeconomic trends. A valid signal is only generated when the indicator “snaps back” toward the center line, proving that the opposing force has actually stepped into the market.
5. Practical Trading Playbook: 3 High-Probability DeMarker Strategies
To transform the DeMarker (DeM) from a simple oscillator into a professional trading system, you must move beyond signal descriptions and follow a strict execution framework. The following “Playbook” defines the exact market conditions, entry triggers, and risk parameters required for institutional-grade execution.
Strategy 1: The Mean Reversion (Overbought/Oversold Exit)
Best for: Traders capturing high-probability pullbacks or range reversals.
Market Context: Price is approaching a significant support/resistance level or is trading within a well-defined horizontal range.
- Buy Setup (Long): DeM drops below 0.3 (Oversold), then successfully crosses back above 0.3.
- Entry Trigger: Enter strictly when a bullish confirmation candle (e.g., Pin Bar or Engulfing) prints at the support zone.
- Sell Setup (Short): DeM rises above 0.7 (Overbought), then crosses back below 0.7.
- Entry Trigger: Enter strictly when a bearish confirmation candle prints at the resistance zone.
- Stop-Loss (SL): Place 5–10 pips beyond the most recent swing low (for longs) or swing high (for shorts).
- Take-Profit (TP): Target the opposing range boundary or the next major structural level.
- Avoid When: The market is in a “Parabolic” trend. In extreme momentum, the DeM will remain pinned in the 0.7/0.3 zones, generating multiple false reversal signals.
Strategy 2: The Exhaustion Hunter (Divergence Setup)
Best for: Traders identifying the end of a major trend and looking for high-reward-to-risk reversals.
Market Context: A mature trend showing clear signs of structural fatigue on higher timeframes (H4 or D1).
- Bullish Divergence: Price prints a Lower Low (LL), but the DeMarker prints a Higher Low (HL). This indicates that despite the price drop, selling pressure is mathematically evaporating.
- Bearish Divergence: Price prints a Higher High (HH), but the DeMarker prints a Lower High (LH). This suggests buying demand is failing to support the new peak.
- Entry Trigger: Do not enter on the divergence alone. Wait for a break of a minor structural level (e.g., the most recent H1 swing high/low) or a clear trendline break on the price chart.
- Stop-Loss (SL): Place strictly beyond the recent price extreme (the HH or LL of the divergence).
- Take-Profit (TP): Target the 50% retracement of the previous move or the next major institutional liquidity pool.
- Avoid When: Divergence appears in the middle of a strong momentum move without touching a key higher-timeframe supply or demand zone.
Strategy 3: The Early Warning (DeM Trendline Break)
Best for: Advanced traders seeking early entry signals before the price action makes an obvious move.
Market Context: The DeMarker indicator is forming clear “peaks and valleys,” allowing for the construction of internal trendlines.
- The Logic: Momentum often shifts before price. A break of a trendline drawn directly on the DeM indicator acts as a leading signal of an impending price breakout.
- Entry Trigger: A decisive close of the DeM line outside its own trendline. This must be accompanied by a price-action shift, such as a loss of momentum (smaller candles) or a breakout from a chart pattern (e.g., a flag or wedge).
- Stop-Loss (SL): Follow the price structure. Place the SL beyond the most recent structural pivot on the price chart, not based on the indicator’s value.
- Take-Profit (TP): Target the next structural level or use a trailing stop to capture an extended move.
- Avoid When: The indicator is oscillating in a very tight, choppy range (stagnant momentum), as this produces “false breaks” that lack the fuel to move the price.
6. Live Market Execution: 2 DeMarker Case Studies
To truly bridge the gap between theory and execution, let’s examine how these strategies play out on live charts. The following case studies demonstrate the precise mechanics of combining the DeMarker indicator with price action and market structure.
6.1. Case Study 1: Bearish DeM Exit from Overbought (EUR/USD)
EUR/USD is experiencing a short-term rally and pushes directly into a major, higher-timeframe resistance zone.
- The Signal: The DeMarker (14) line rises above the 0.7 threshold (Overbought), indicating that the upward momentum is overextended. Crucially, we wait. The signal fires when the DeM line decisively drops back below 0.7.
- Confirmation: Precisely as the DeM exits the overbought zone, a classic Bearish Engulfing candlestick pattern forms at the resistance level, proving that institutional sellers are defending the zone.
- Entry: Execute a Short (Sell) order immediately upon the close of the Bearish Engulfing candle.
- Stop-Loss (SL): Placed 10–15 pips above the wick of the Engulfing candle (the recent swing high) to protect against a fake-out.
- Take-Profit (TP): Targeted at the prior structural support level or the middle of the current trading range, securing a favorable Risk/Reward ratio.
- The Lesson: A DeM overbought exit is a low-probability gamble in the middle of nowhere. The signal becomes exponentially stronger when it physically aligns with a known resistance zone and is validated by a clear price-action rejection.
6.2. Case Study 2: Bullish Divergence on GBP/USD
GBP/USD is in a prolonged downtrend. The price action makes a final aggressive push downward, printing a fresh Lower Low (LL) into a historical support level.
- The Signal: While the price prints that new Lower Low, the DeMarker indicator fails to follow suit, instead forming a Higher Low (HL). This classic bullish divergence mathematically proves that the selling pressure driving the new low is exhausted.
- Confirmation: The price prints a strong Bullish Pin Bar (long lower wick) rejecting the support zone, immediately followed by a breakout above the minor local downtrend line.
- Entry: Execute a Long (Buy) order directly after the close of the confirmation candle or the trendline break.
- Stop-Loss (SL): Placed safely below the absolute extreme of the fresh Lower Low.
- Take-Profit (TP): Targeted at the previous major swing high or the closest supply zone.
- The Lesson: Divergence is a warning system, not an entry trigger. A divergence setup is only a valid trade after the price structure confirms the momentum shift. Buying a divergence blindly during a strong downtrend is a quick way to catch a falling knife.
7. DeMarker vs. RSI: Choosing the Right Tool for Your Strategy
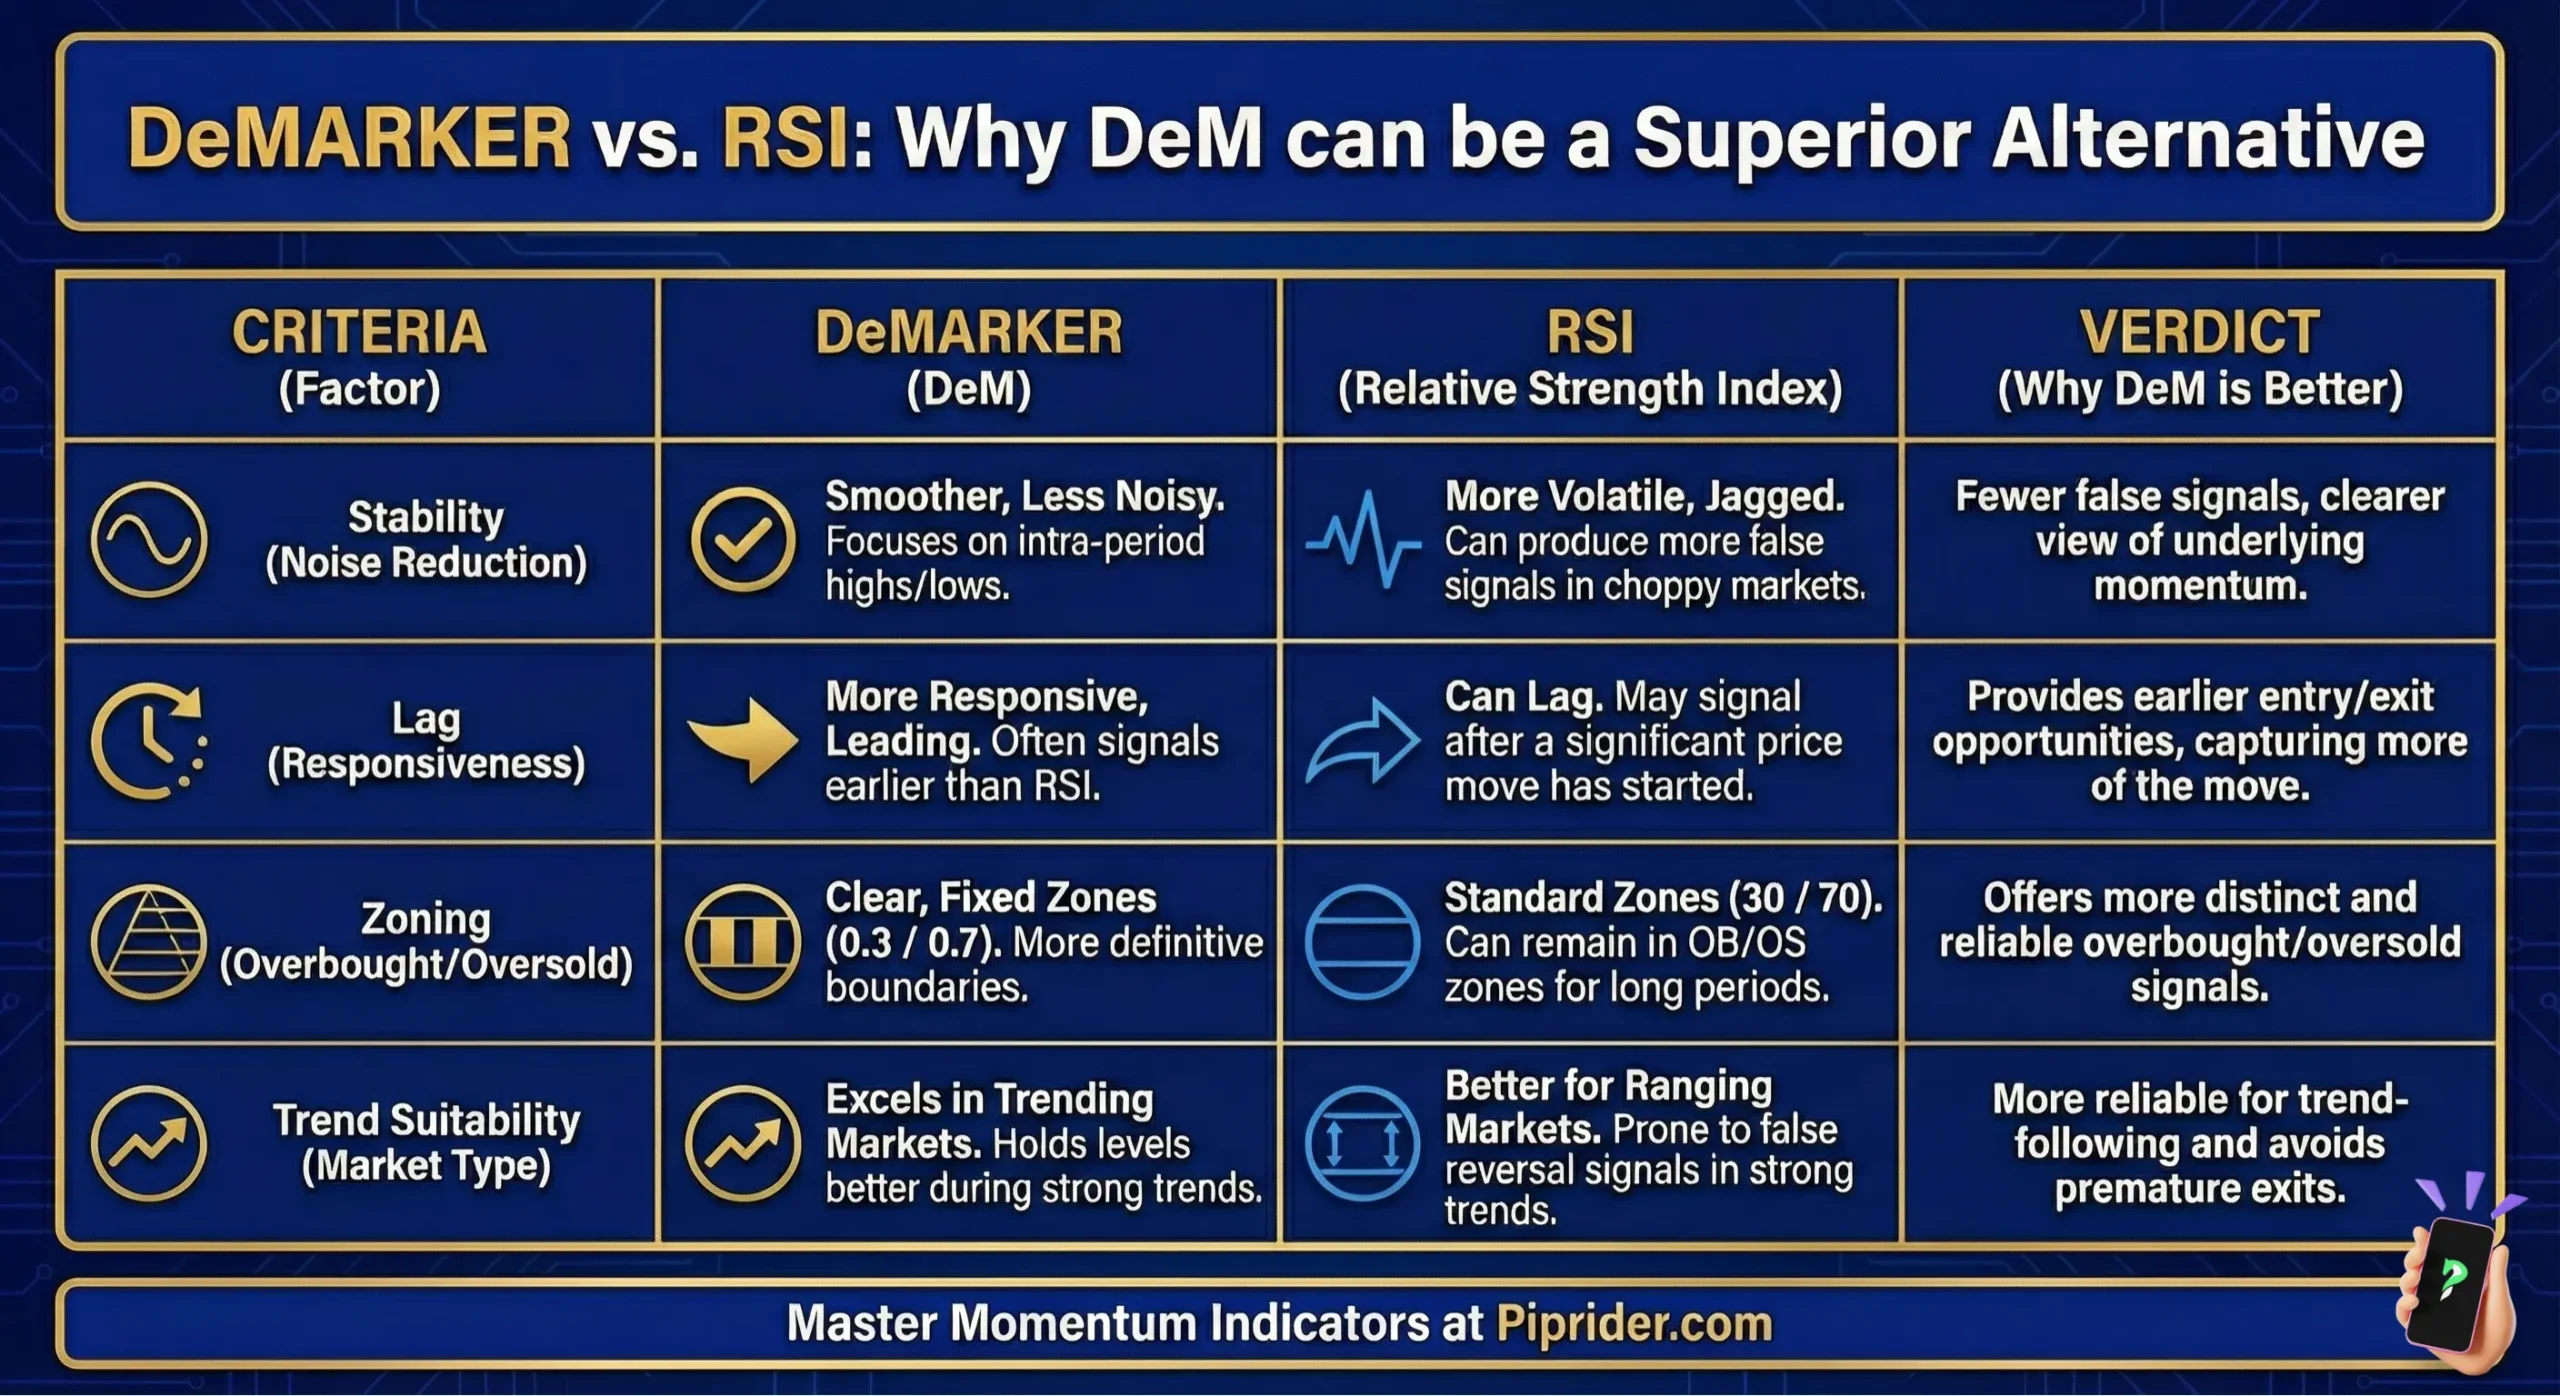
At a glance, the DeMarker (DeM) and the Relative Strength Index (RSI) look like identical lines moving within boundaries. However, they are built on different philosophies. The RSI asks: “How powerful were the ‘up’ closes compared to the ‘down’ closes?” Meanwhile, the DeM asks: “Is today’s demand strong enough to push the price beyond yesterday’s range?”
Because the DeM focuses on intraday highs and lows rather than just closing prices, it naturally filters out more market noise. To help you choose the right tool for your system, use the following Decision Support Matrix:
| Your Trading Goal | Preferred Indicator |
|---|---|
| I want a familiar, standard tool that is easy to learn and widely discussed. | RSI |
| I want a smoother signal that focuses specifically on trend exhaustion. | DeMarker |
| I want to trade divergences with significantly less market noise and “spikes.” | DeMarker |
| I need an indicator that reacts instantly to sudden price shocks and volatility. | RSI |
| I trade mean-reversion in sideways, ranging markets. | RSI (More sensitive) |
The Verdict for Traders
For Advanced/System Traders: Choose the DeMarker when you want to upgrade your system with a smoother, more “institutional” feel. It is the superior choice for identifying structural trend exhaustion and high-conviction divergences where the RSI might generate too many false signals.
For Beginners: Start with the RSI. Its widespread use means you will find more educational resources and standard templates to help you understand basic oscillator mechanics.
8. Operational Context: When DeMarker Works vs. When It Fails
No technical indicator is a “holy grail.” The DeM’s predictive power is highly dependent on the market regime. To use it responsibly, you must distinguish between environments where the math holds true and those where the indicator becomes a liability.
8.1. DeMarker Works Best When:
The indicator delivers its highest-conviction signals in environments where price action is cyclic or reaching structural limits:
- Near Structural Exhaustion: When the price is approaching a major Daily (D1) or Weekly (W1) Support or Resistance zone.
- Confluence with Key Levels: When a 0.7/0.3 exit or a divergence aligns perfectly with a Supply/Demand zone or a high-volume psychological level.
- Mature Trends: In established trends that are starting to show “rounded” tops or bottoms, indicating that the initial momentum is cooling off.
- Divergence at Key Levels: When a divergence appears specifically after the price has failed to break a long-term structural barrier.
8.2. DeMarker Fails More Often When:
The indicator is mathematically prone to “False Positives” in environments where raw momentum overrides standard mean-reversion logic:
- Strong Parabolic Trends: In runaway trends (e.g., during major news breaks), the DeM will stay pinned in the extreme zones. Selling a “strong” reading here is a recipe for a blown account.
- “Blind” Entries: Entering a trade simply because the indicator touched 0.7 or 0.3 without waiting for a “snap-back” or a price-action trigger.
- No Price Confirmation: Executing based on the indicator alone while the price is still printing strong, full-bodied candles in the direction of the trend.
- Low-Liquidity Environments: During the Asian session or bank holidays, thin liquidity can cause erratic “spikes” in the DeM that do not represent true institutional demand or supply.
The Golden Rule of Failure
The DeMarker indicator is a momentum gauge, not a physical barrier. If the price is moving with extreme velocity, the indicator’s boundaries (0.7/0.3) will act as magnets rather than ceilings. In these cases, ignore the indicator until the price structure itself begins to break.
9. Professional Tips for Maximizing DeMarker Efficiency
To extract the most value from the DeMarker (DeM) indicator and avoid common retail pitfalls, follow these professional execution standards. These rules are designed to filter out market noise and align your entries with high-probability institutional flow.
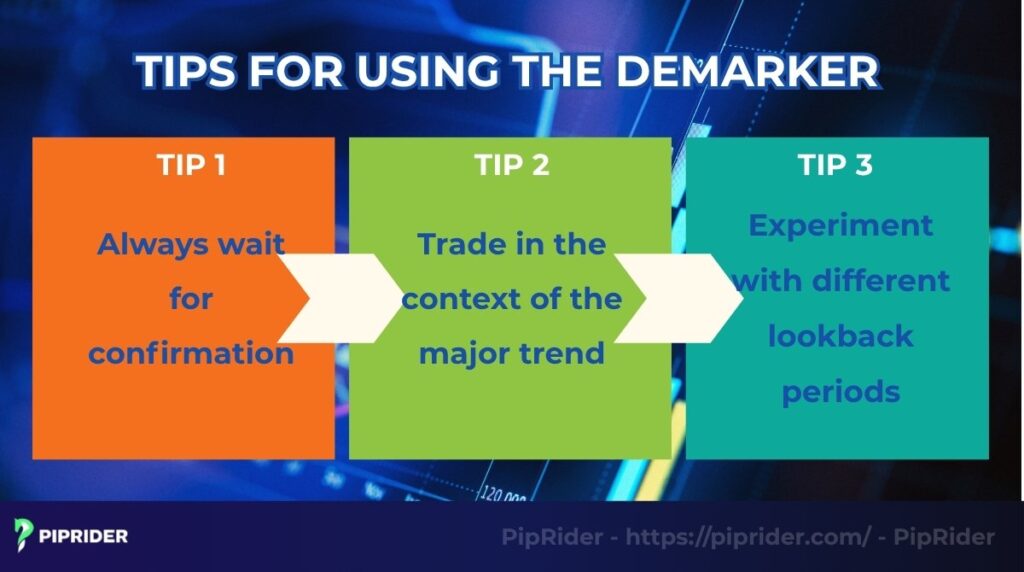
9.1. The Golden Rule: Wait for Price Confirmation
A DeM signal, whether a divergence or an overbought exit, is a warning, not a command to trade. Never enter a position based solely on the indicator’s movement.
- The Protocol: Always wait for a corresponding price-action trigger. This includes a Bullish/Bearish Engulfing candle, a Pin Bar rejecting a key level, or a breakout of a minor structural trendline on a lower timeframe.
9.2. Prioritize Trend Alignment (The Path of Least Resistance)
While the DeM is famous for spotting reversals, its highest win rates occur when used as a timing tool within a dominant trend.
- Uptrends: Look exclusively for “Oversold” (0.3) exits to time your entry on a pullback. Ignore overbought signals as they often represent healthy mid-trend strength.
- Downtrends: Focus strictly on “Overbought” (0.7) exits to time your short entries. Ignore oversold readings as they frequently persist during strong bearish momentum.
9.3. Optimize Lookback Periods by Trading Style
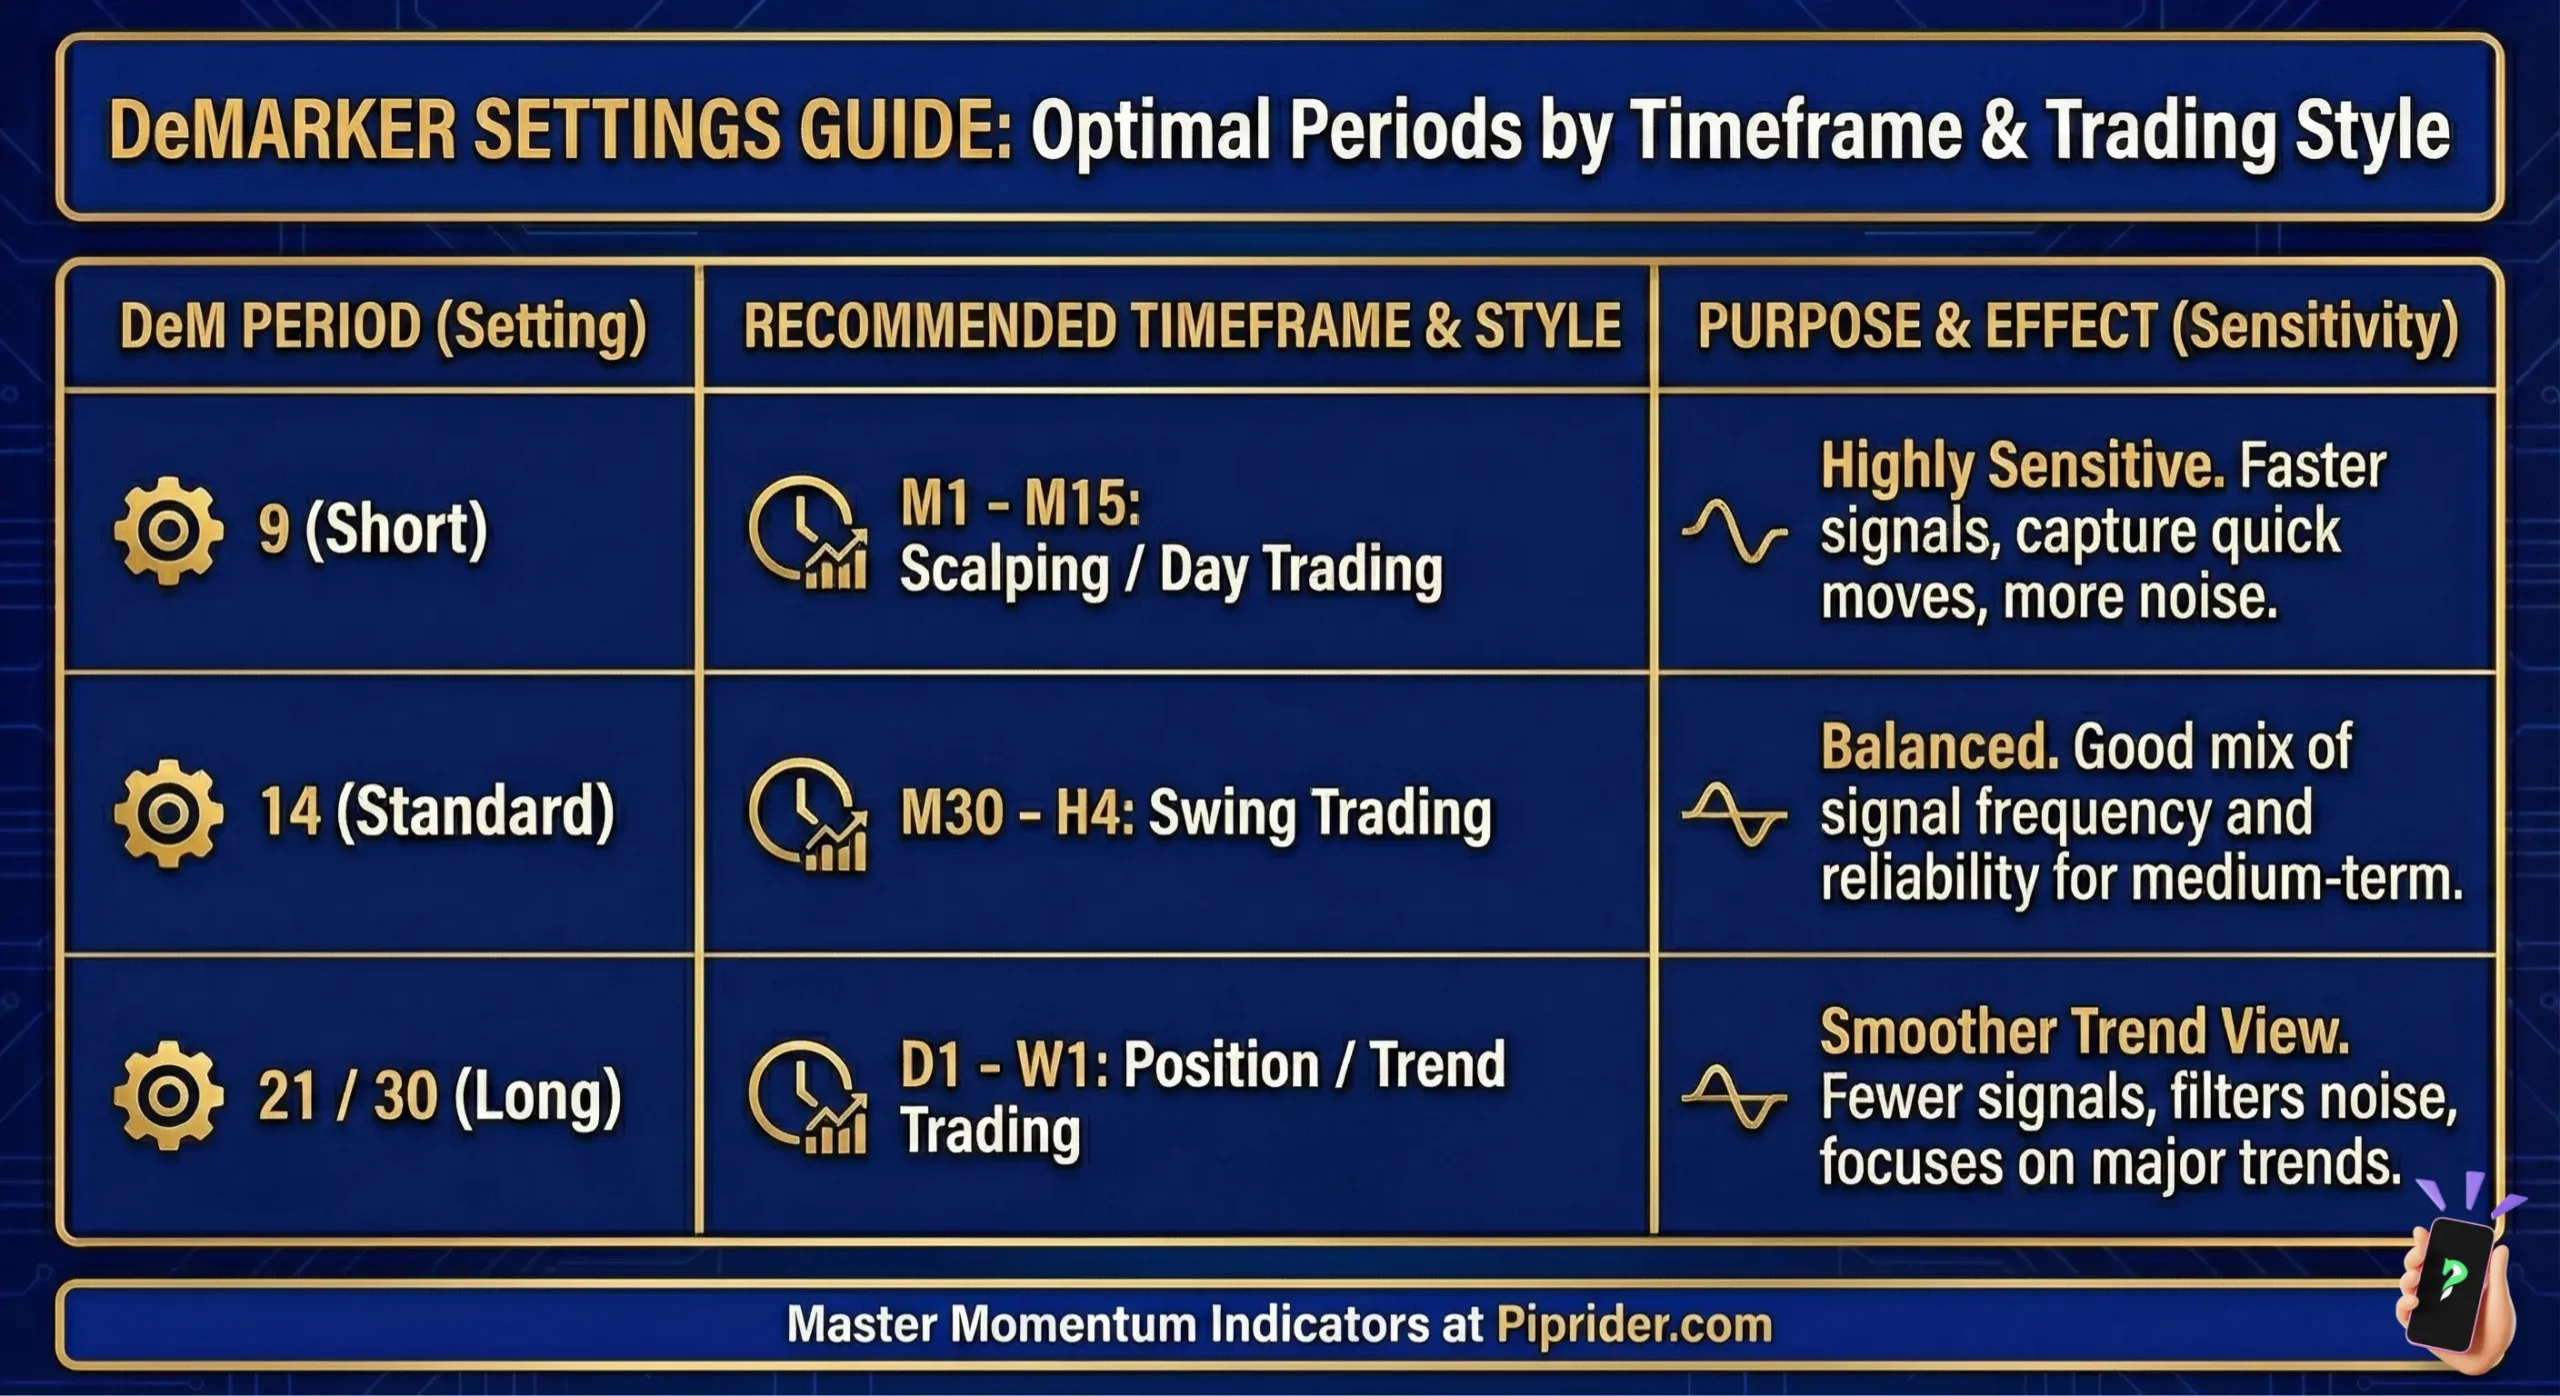
The standard 14-period setting is a versatile starting point, but professional traders often calibrate the “N” value to match their specific execution horizon:
- Day Trading (M5 – M15): Use a shorter period (9 or 10) to increase sensitivity to rapid intraday momentum shifts.
- Swing Trading (H4 – D1): Use a longer period (21 or 30) to smooth out daily volatility and focus only on significant structural exhaustion.
9.4. Employ Multi-Indicator Confluence
The DeM measures directional demand but ignores volume and structural context. For a robust trading system, never use it in isolation:
- Structural Context: Align DeM signals with historical Support/Resistance or Supply/Demand zones.
- Volume Context: Pair with a volume-based tool (e.g., On-Balance Volume or Chaikin Money Flow) to verify if the momentum shift is backed by actual money flow.
- Candlestick Confirmation: Only execute when the indicator signal is validated by a high-probability candlestick pattern at a key value area.
10. Quick Setup: Adding DeMarker to MT4/MT5
The DeMarker (DeM) indicator is a standard tool included in both MetaTrader 4 and MetaTrader 5 (Admiral Markets, n.d.). You do not need to download external files; simply follow this 4-step execution to add it to your charts:
- Open the Navigator: Press Ctrl+N on your keyboard or select the “Navigator” icon from the top toolbar.
- Locate the Indicator: Expand the Indicators folder, then open the Oscillators sub-folder.
- Apply to Chart: Find DeMarker in the list. Click and drag it directly onto your active price chart (or double-click it).
- Configure Parameters: In the pop-up window, ensure the Period is set to 14 (standard) and confirm that the 0.3 and 0.7 levels are active in the “Levels” tab. Click OK to finish.
Pro Tip: To keep your workspace clean, save your configuration as a Template (Right-click chart > Templates > Save Template) so you can apply your DeM settings to any new pair instantly.
11. Frequently asked questions (FAQs) about the DeMarker indicator
12. Conclusion
The DeMarker indicator is a powerful, nuanced, and highly effective tool that presents a valuable alternative to more common oscillators like the RSI. Its unique capacity to measure market demand and generate a smoother signal line makes it exceptional for identifying trend exhaustion.
However, always remember that it is a leading indicator. Its signals must be treated with respect and consistently confirmed by price action. By understanding its strengths and weaknesses and incorporating it into a solid trading plan, the DeM can become a vital component of your analytical toolkit.
Are you ready to see the difference the indicator can make in your analysis? Follow PipRider to find out the best technical indicators for your trading now!
Infographic Section
-
DeMarker Indicator: Trading Signals -
DeMarker Indicator Vs. RSI Indicator -
DeMarker Indicator Settings Guide


