
Price charts only tell part of the story. What if you could see the conviction behind price movements, the actual buying and selling force that fuels a trend?
The Chaikin Oscillator (CO) is a powerful technical indicator designed to do precisely that. It moves beyond price alone to analyze the momentum of money flowing into or out of an asset. By measuring the rate of change of the Accumulation/Distribution Line (ADL), it offers a crucial perspective on a trend’s health and sustainability.
This in-depth guide will break down the mechanics of this sophisticated tool, clarify its formula, and demonstrate actionable trading strategies to help you integrate it into your Forex analysis with confidence.
Key Takeaways
- The Chaikin Oscillator measures the momentum of buying and selling pressure.
- It helps traders spot potential trend reversals or confirm existing trends.
- Signals often occur when the oscillator crosses the zero line, indicating a shift in market control.
- Bullish or bearish divergences between the oscillator and price can predict upcoming trend changes.
- It is most effective when combined with price action and other analysis methods for confirmation.
1. What is the Chaikin Oscillator?
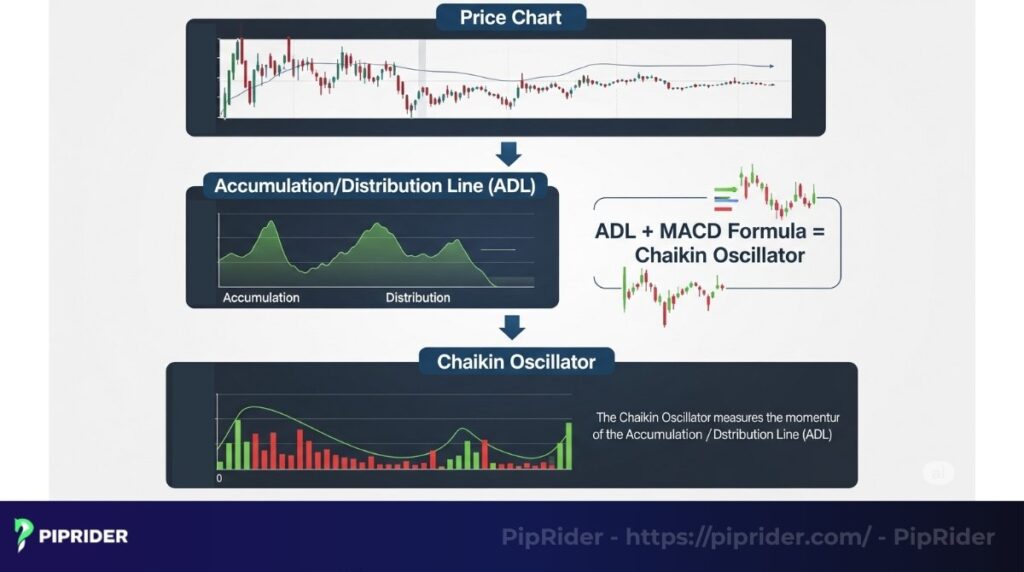
The Chaikin Oscillator (CO) is a technical indicator developed by Marc Chaikin that measures the momentum of the Accumulation/Distribution Line (ADL). It essentially applies the MACD framework, comparing a fast moving average to a slow moving average to the ADL rather than to the price itself.
To use this tool effectively, it is vital to understand its positioning relative to its parent indicator:
- The Accumulation/Distribution Line (ADL) provides the cumulative direction of money flow (where the money is going).
- The Chaikin Oscillator (CO) measures the velocity or momentum of that flow (how fast it is getting there).
By quantifying the rate of change in money flow, the CO helps traders identify whether a trend is gaining strength or losing conviction before the price itself begins to turn.
2. What the Chaikin Oscillator Really Measures
Before diving into complex formulas, it is important to understand what the Chaikin Oscillator is actually telling you. Many traders mistake it for a simple volume indicator, but it is more accurately described as a “momentum of money flow” tool.
The oscillator tracks the interaction between price and volume to determine market conviction:
- Accumulation (Buying Pressure): When a currency pair consistently closes in the upper half of its daily range on high volume, the oscillator rises, indicating strong buying momentum.
- Distribution (Selling Pressure): When a pair closes in the lower half of its range on high volume, the oscillator falls, signaling that selling pressure is accelerating.
Ultimately, the Chaikin Oscillator tells you if the “fuel” behind a price move is increasing or decreasing. If the price is rising but the oscillator is falling, it suggests the trend is “running on fumes” – a vital insight that price-only indicators often miss.
3. The Components of the Chaikin Oscillator
To master the Chaikin Oscillator, you must recognize it as a two-layer system. It is not a direct measurement of price; rather, it is a momentum indicator built upon a volume indicator.
3.1. The Accumulation/Distribution Line (ADL)
The entire calculation of the Chaikin Oscillator is driven by the ADL, which serves as its exclusive data source. The ADL is a volume-weighted indicator that maintains a running total of money flowing into or out of an asset.
It trends upward when an asset closes in the upper portion of its trading range (signaling accumulation) and trends downward when it closes in the lower portion (signaling distribution). By using the ADL as its base, the Chaikin Oscillator accounts for both price action and volume.
3.2. The Moving Average Convergence-Divergence (MACD) Principle
The Chaikin Oscillator borrows its mathematical structure from the MACD. While the standard MACD calculates the spread between two Exponential Moving Averages (EMAs) of an asset’s price, the Chaikin Oscillator applies this same logic to the ADL.
By calculating the difference between a “fast” and a “slow” EMA of the ADL, the indicator isolates the momentum of the money flow, making it easier to spot when buying or selling pressure is accelerating or decelerating.
4. The Calculation Formula of the Chaikin Oscillator
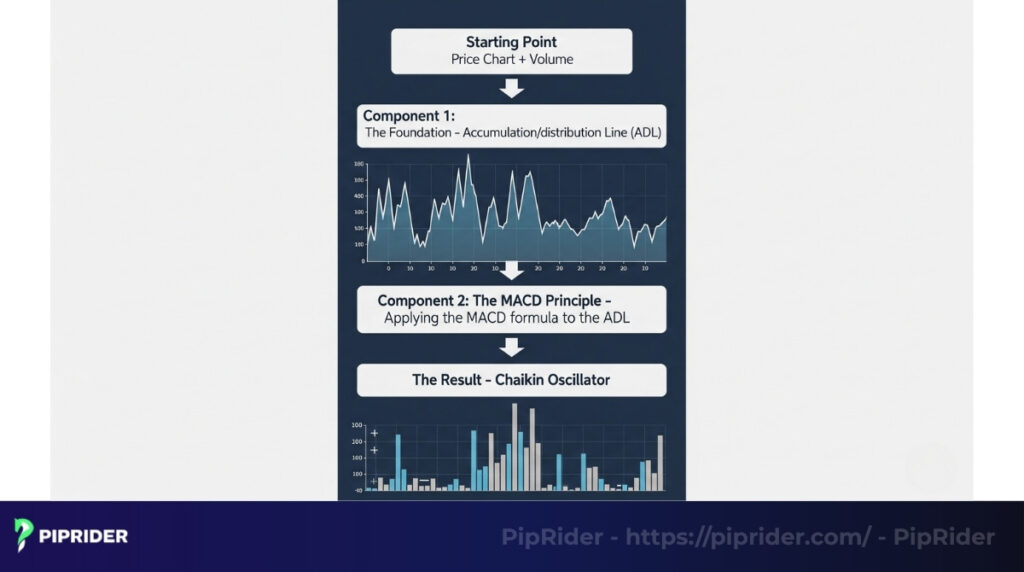
The formula for the Chaikin Oscillator translates raw price and volume data into a momentum reading. This is a multi-stage process that first computes the foundational ADL before applying exponential moving averages.
Step 1: Calculating the Money Flow Multiplier and Volume For each period, the Money Flow Multiplier is determined by the close’s position relative to the high-low range:
- Money Flow Multiplier = [(Close – Low) – (High – Close)] / (High – Low)
- Money Flow Volume = Money Flow Multiplier x Volume for the period
Step 2: Deriving the ADL The ADL is a running sum of the Money Flow Volume:
- ADL = Previous ADL + Current Period’s Money Flow Volume
Step 3: The Chaikin Oscillator Formula The final value is determined by subtracting a 10-period EMA from a 3-period EMA of the ADL:
- Chaikin Oscillator = (3-period EMA of ADL) – (10-period EMA of ADL)
5. How to Interpret the Chaikin Oscillator
Reading the Chaikin Oscillator involves interpreting its position relative to the zero line and its current direction. The following table provides a quick-reference guide for translating oscillator behavior into market conviction.
| Oscillator Behavior | Market Meaning | Potential Action |
|---|---|---|
| Above Zero | Bullish money flow dominance | Look for long (buy) setups |
| Below Zero | Bearish money flow dominance | Look for short (sell) setups |
| Rising (Moving Up) | Accumulation is accelerating | Trend is strengthening; hold position |
| Falling (Moving Down) | Distribution is accelerating | Trend is weakening; tighten stops |
| Crossing Above Zero | Momentum has shifted to the bulls | Confirmation of a new buy signal |
| Crossing Below Zero | Momentum has shifted to the bears | Confirmation of a new sell signal |
The Zero Line as Equilibrium The zero line represents the point where buying and selling momentum are balanced. When the CO is in positive territory (> 0), buying pressure is dominant. When it is in negative territory (< 0), selling pressure is in control. The further the indicator moves from zero, the more intense the market conviction is.
6. How to Read the Chaikin Oscillator Step-by-Step
To translate these signals into a trading plan, use this systematic four-step decision-making framework:
- Check Overall Trend: Identify the primary trend using price action or a long-term moving average.
- Verify Oscillator Position: Confirm if the oscillator is staying mostly above zero (bullish) or below zero (bearish).
- Watch for Momentum Shifts: Look for crossovers or sharp turns toward the zero line as early warnings.
- Confirm with Price: Never trade the oscillator in isolation. Wait for a breakout or a candle pattern to confirm the momentum shift.
Beginner Shortcut: The “Follow the Zero” Rule
If you are new to this indicator, avoid complex divergence signals initially. Focus strictly on the zero-line cross:
- Buy when the oscillator crosses above 0 and the price is in an uptrend.
- Sell when the oscillator crosses below 0 and the price is in a downtrend.
7. Chaikin Oscillator Trading Strategies
Strategy 1: Trend Confirmation (The “Stay In” Signal)
In a trending market, the Chaikin Oscillator acts as a validator. If the price is making higher highs and the oscillator remains comfortably above zero, it indicates that “smart money” is supporting the move. This gives you the confidence to hold your position rather than exiting early on minor pullbacks.
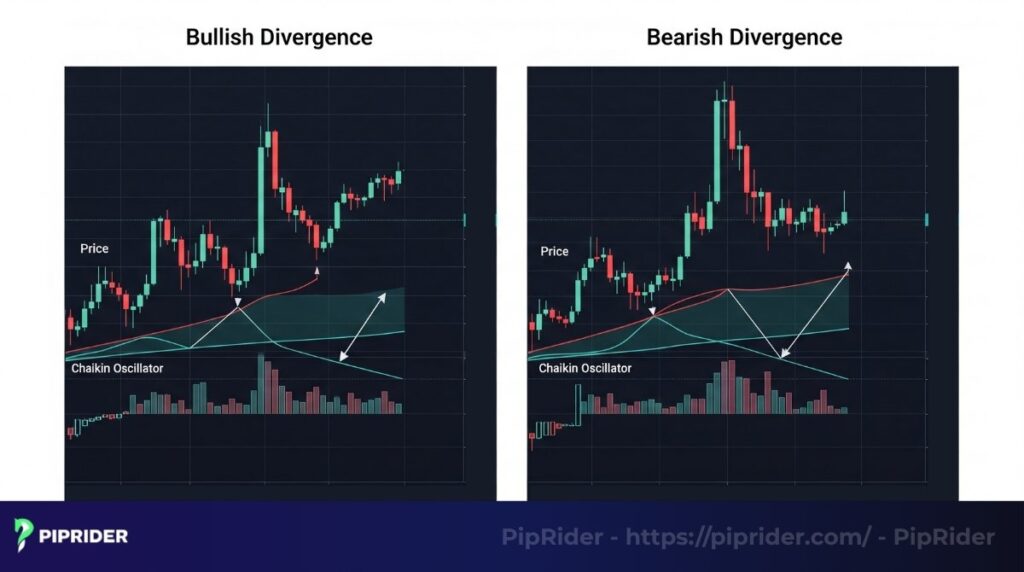
Strategy 2: Early Reversal (The Divergence Signal)
Divergence is a leading signal that predicts trend exhaustion:
- Bullish Divergence: Price makes a lower low, but the CO makes a higher low. This shows selling pressure is drying up despite the falling price.
- Bearish Divergence: Price makes a higher high, but the CO makes a lower high. This warns that buying momentum is fading even as price peaks.
8. A Practical Walkthrough: Trading with the Chaikin Oscillator
Let’s look at a real-world scenario on the EUR/JPY H4 chart.
- Observation (Divergence): The price rallies to a new peak, but the Chaikin Oscillator forms a peak significantly lower than its previous one. This is our “Early Warning.”
- Confirmation (Crossover): Instead of selling immediately, we wait for the oscillator to cross below the zero line. This confirms that the bears have officially taken control of the momentum.
- Refinement (Confluence): By checking a major resistance level, we see the crossover happens right at a historical “ceiling.” This confluence reduces the risk of a “fake-out.”
- Execution: Enter the trade with a stop-loss above the recent high.
Note on Failure Points: In my experience, divergences often “fail” if the market is in a super-trend. If the oscillator shows divergence but refuses to cross the zero line, the original trend is likely to continue. Always wait for that zero-line confirmation.
9. Chaikin Oscillator vs. A/D vs. CMF
Traders often confuse the Chaikin Oscillator with its “relatives” because they all utilize price and volume data. However, they serve different purposes in a trading workflow.
| Indicator | Type | Primary Purpose |
|---|---|---|
| Accumulation/Distribution (A/D) | Cumulative Line | Shows the long-term direction of money flow |
| Chaikin Oscillator (CO) | Momentum Oscillator | Measures the velocity/momentum of money flow changes |
| Chaikin Money Flow (CMF) | Bounded Oscillator | Measures total buying/selling pressure over a fixed window (e.g., 20 days) |
The A/D Line is the foundation. The Chaikin Oscillator is the “fast” signal that tells you when that foundation is shifting. Meanwhile, CMF is a more stable, bounded version often used for long-term trend health.
10. Best Timeframes and Market Context
The Chaikin Oscillator is highly sensitive. Using it in the wrong environment can lead to significant “noise” and false signals.
Recommended Timeframes
- H1 (1-Hour) and H4 (4-Hour): These are generally considered the “sweet spots” for Forex traders. They provide enough data for volume trends to be meaningful while filtering out minor price flickers.
- Daily (D1): Excellent for long-term swing traders looking for major institutional accumulation.
- M1 to M15: Generally discouraged. On very low timeframes, tick volume is often erratic, causing the oscillator to whipsaw across the zero line too frequently to be reliable.
The Ideal Market Context
The Chaikin Oscillator performs best in Trending Markets or at the End of a Trend (reversal). Because it measures momentum, it requires a directional move to generate a clean reading.
11. When the Chaikin Oscillator Fails
No indicator is 100% accurate. Understanding the “failure conditions” of the Chaikin Oscillator is just as important as knowing when to follow it.
- Sideways/Range-bound Markets: When the price is moving horizontally in a tight range, the oscillator will frequently cross the zero line back and forth. These are usually “fake-outs.”
- Low Volume Periods: During bank holidays or the late New York session when liquidity drops, the money flow data becomes thin. This can lead to exaggerated oscillator movements that don’t reflect real market conviction.
- Fast Market News (Slippage): During major economic releases (like NFP), price moves so fast that the EMA-based nature of the oscillator may lag significantly, causing you to enter or exit a trade too late.
- False Divergences: In a “Super Trend,” price can continue to make new highs for a long time while the oscillator shows divergence. This is why the zero-line crossover is essential as a secondary confirmation.
12. Pros and Cons of the Chaikin Oscillator
To use this tool effectively, it is vital to have a balanced view of both its key strengths and its inherent limitations.
Pros:
- Beyond Price Action: By incorporating volume, it provides insight into the “conviction” of a trend, which price-only indicators can miss.
- Leading Signals: Its ability to spot divergence provides an early warning of trend exhaustion before a reversal occurs.
- Trend Validation: Sustained readings above or below zero help traders stay in profitable trends with confidence.
Cons:
- Forex Volume Limitations: Since Forex is decentralized, the indicator relies on tick volume (price frequency), which is an approximation of actual money flow.
- False Signals in Ranges: In low-volatility or sideways markets, the oscillator can “whipsaw” across the zero line, creating confusing noise.
- Lagging Crossovers: Like all moving average-based signals, zero-line crossovers confirm a move that has already begun, potentially leading to later entries.
13. Chaikin Oscillator vs. MACD: Which is Better?
While both indicators use a similar EMA-based formula, they tell two very different stories. The choice depends on what part of the market you want to analyze.
| Feature | Chaikin Oscillator | MACD |
|---|---|---|
| Data Source | ADL (Price + Volume) | Price (Closing Price) |
| Gauges | Money Flow Momentum | Price Change Velocity |
| Best Use | Spotting institutional conviction | Tracking trend strength/direction |
Conclusion: Neither is superior; they are complementary. A powerful synergy involves using the MACD for a primary signal and the Chaikin Oscillator for confirmation. For instance, a MACD bullish crossover is significantly more reliable if the CO is also in positive territory.
14. Tips for Success: Confluence and Market Structure
To maximize the effectiveness of the Chaikin Oscillator, follow these expert tactics:
- Pair with Market Structure: The most compelling signals appear when a Chaikin Oscillator event confirms a price action level. A divergence forming at a major historical support or resistance level is much more significant than one forming in “mid-air.”
- The Power of Confluence: To filter out false signals, use the Chaikin Oscillator alongside other tools. For example, pair a bullish CO zero-line crossover with an RSI reading moving out of oversold territory.
- Stick to Major Pairs: Due to the reliance on tick volume, this indicator is most reliable on highly liquid majors (e.g., EUR/USD, GBP/USD) where volume data is more robust and consistent.
- Use it as a Filter, Not a Crystal Ball: Treat the oscillator as a verification tool. If your price action analysis says “Buy” but the Chaikin Oscillator is showing accelerating selling pressure (negative and falling), it may be wise to stay on the sidelines.
15. FAQs
16. Conclusion
The Chaikin Oscillator stands out as a sophisticated tool that enriches technical analysis by incorporating the dimension of money flow dynamics. By mastering the predictive power of divergence and the confirming strength of zero-line crossovers, you can significantly enhance your ability to gauge trend health.
Remember that it is a component of a comprehensive strategy, not a standalone solution. Its signals are most potent when used to confirm insights from price action and market structure. Consistent practice on a demo account is the best way to build the intuition needed to separate true signals from market noise.
Infographic Section
-
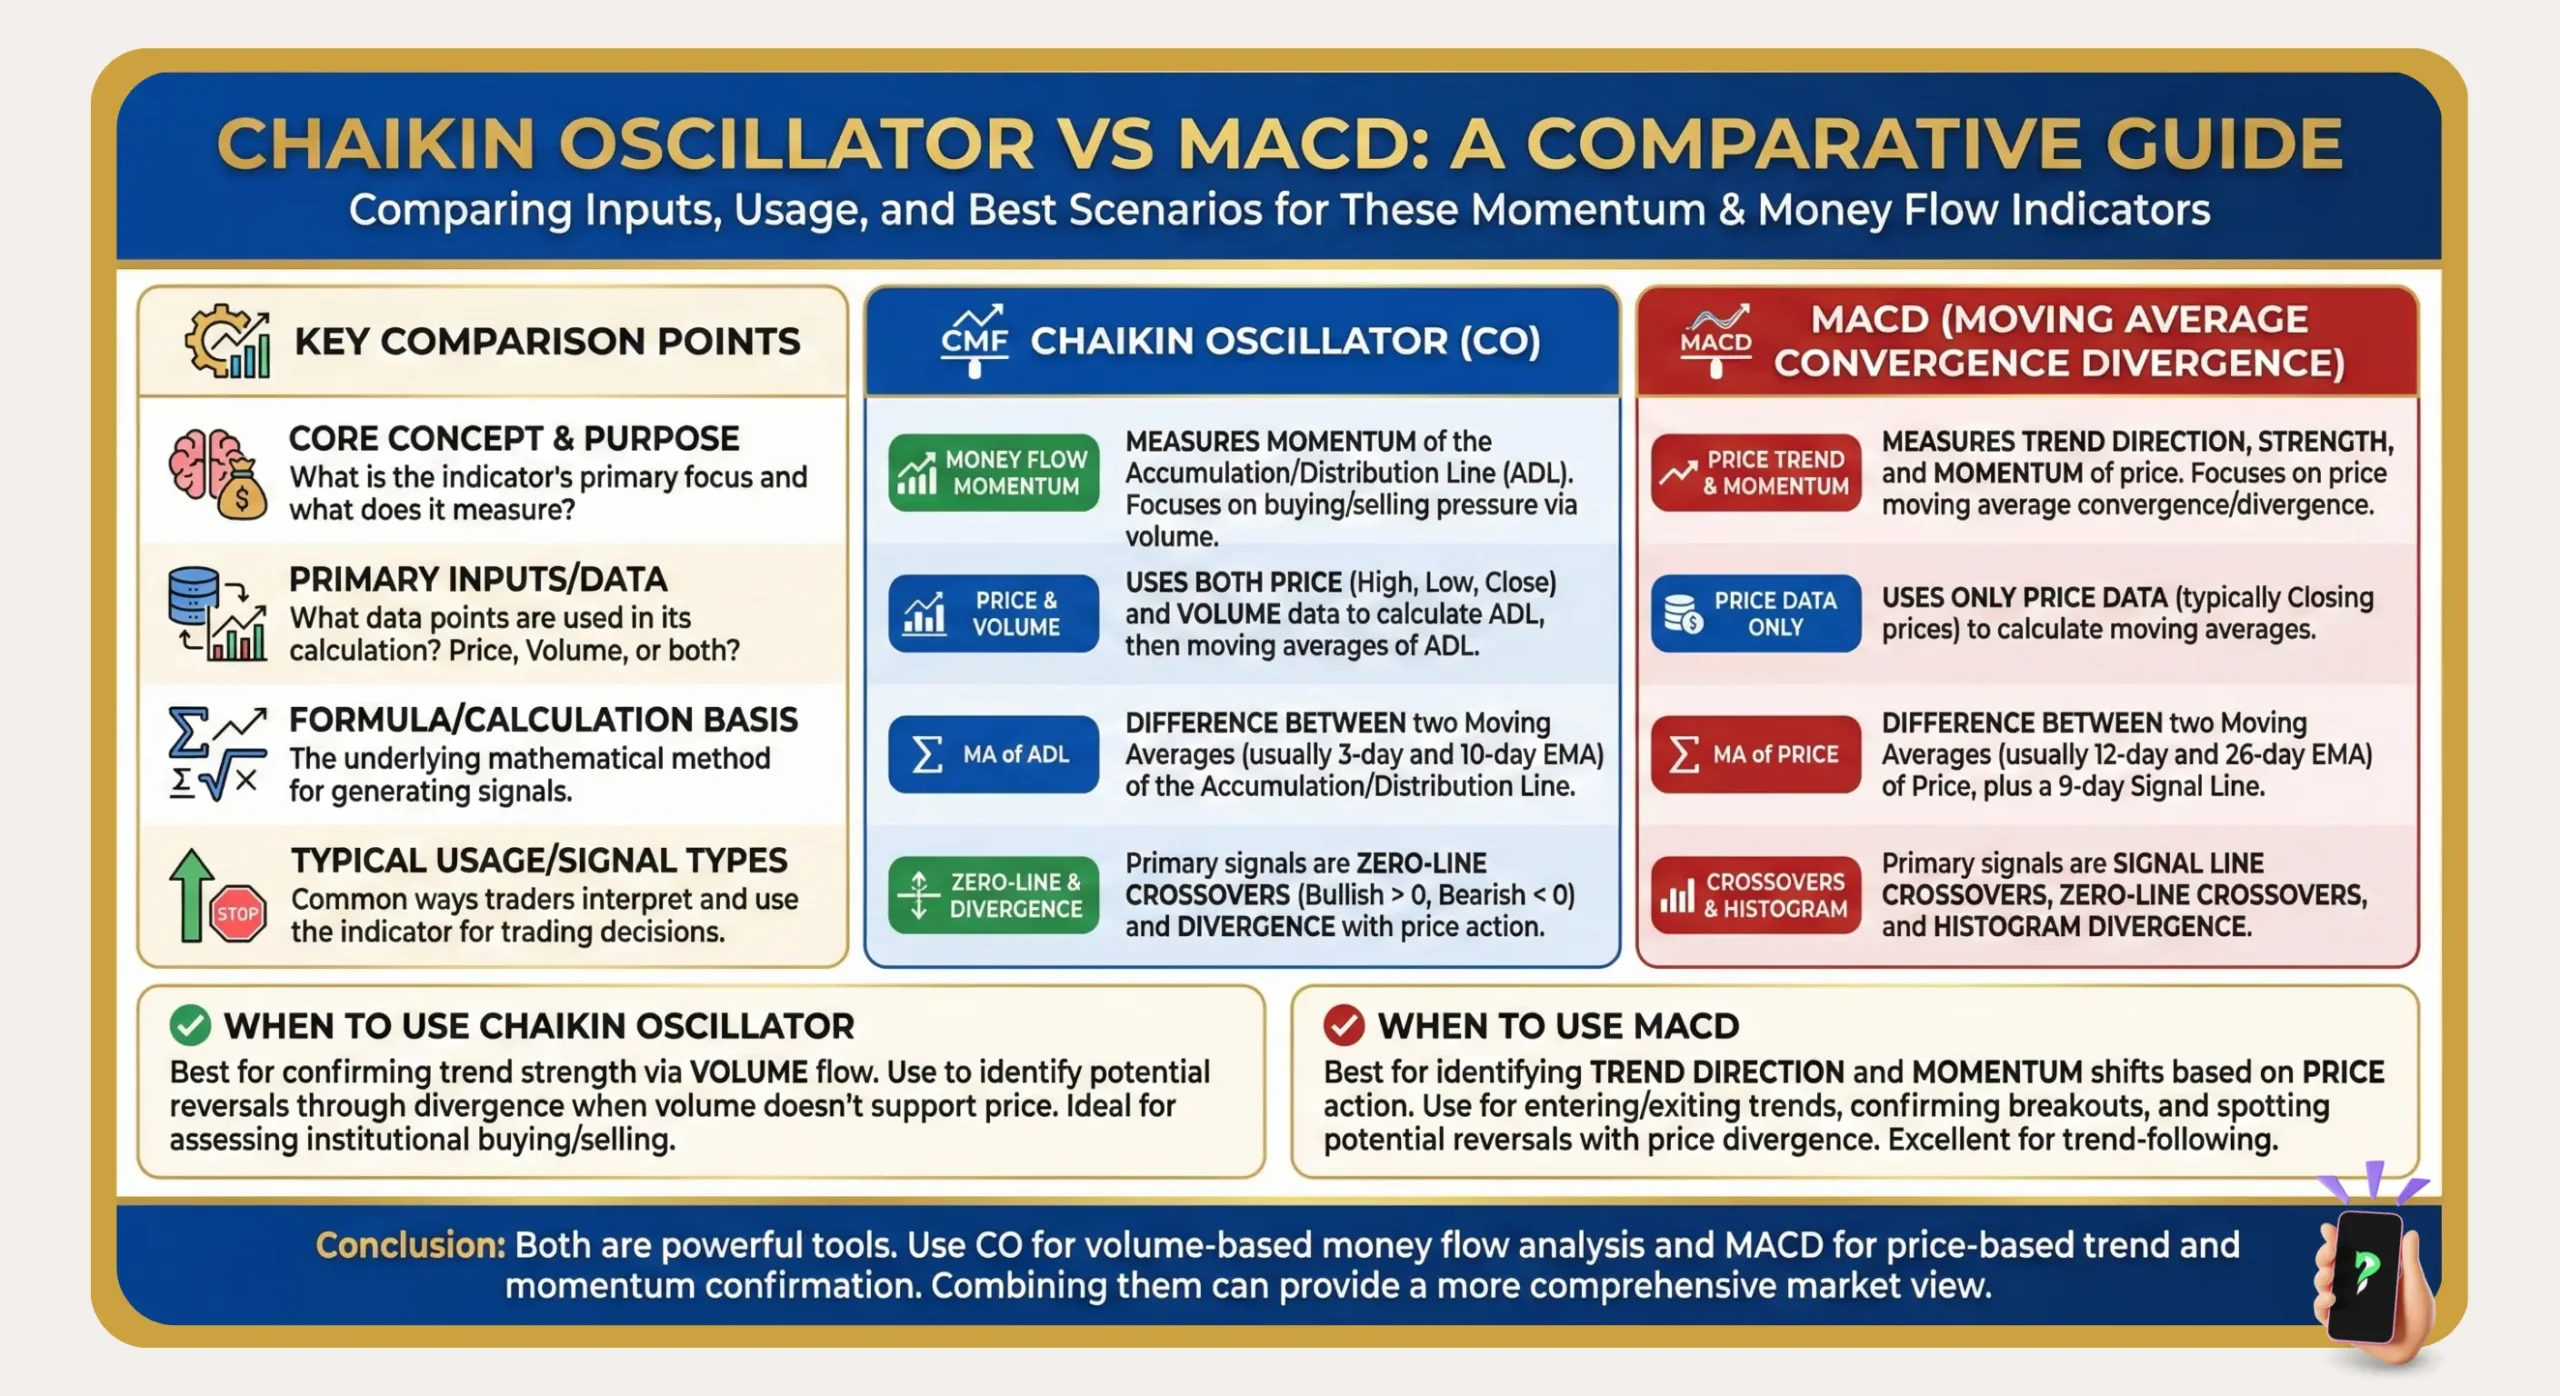
Chaikin Oscillator vs. MACD -
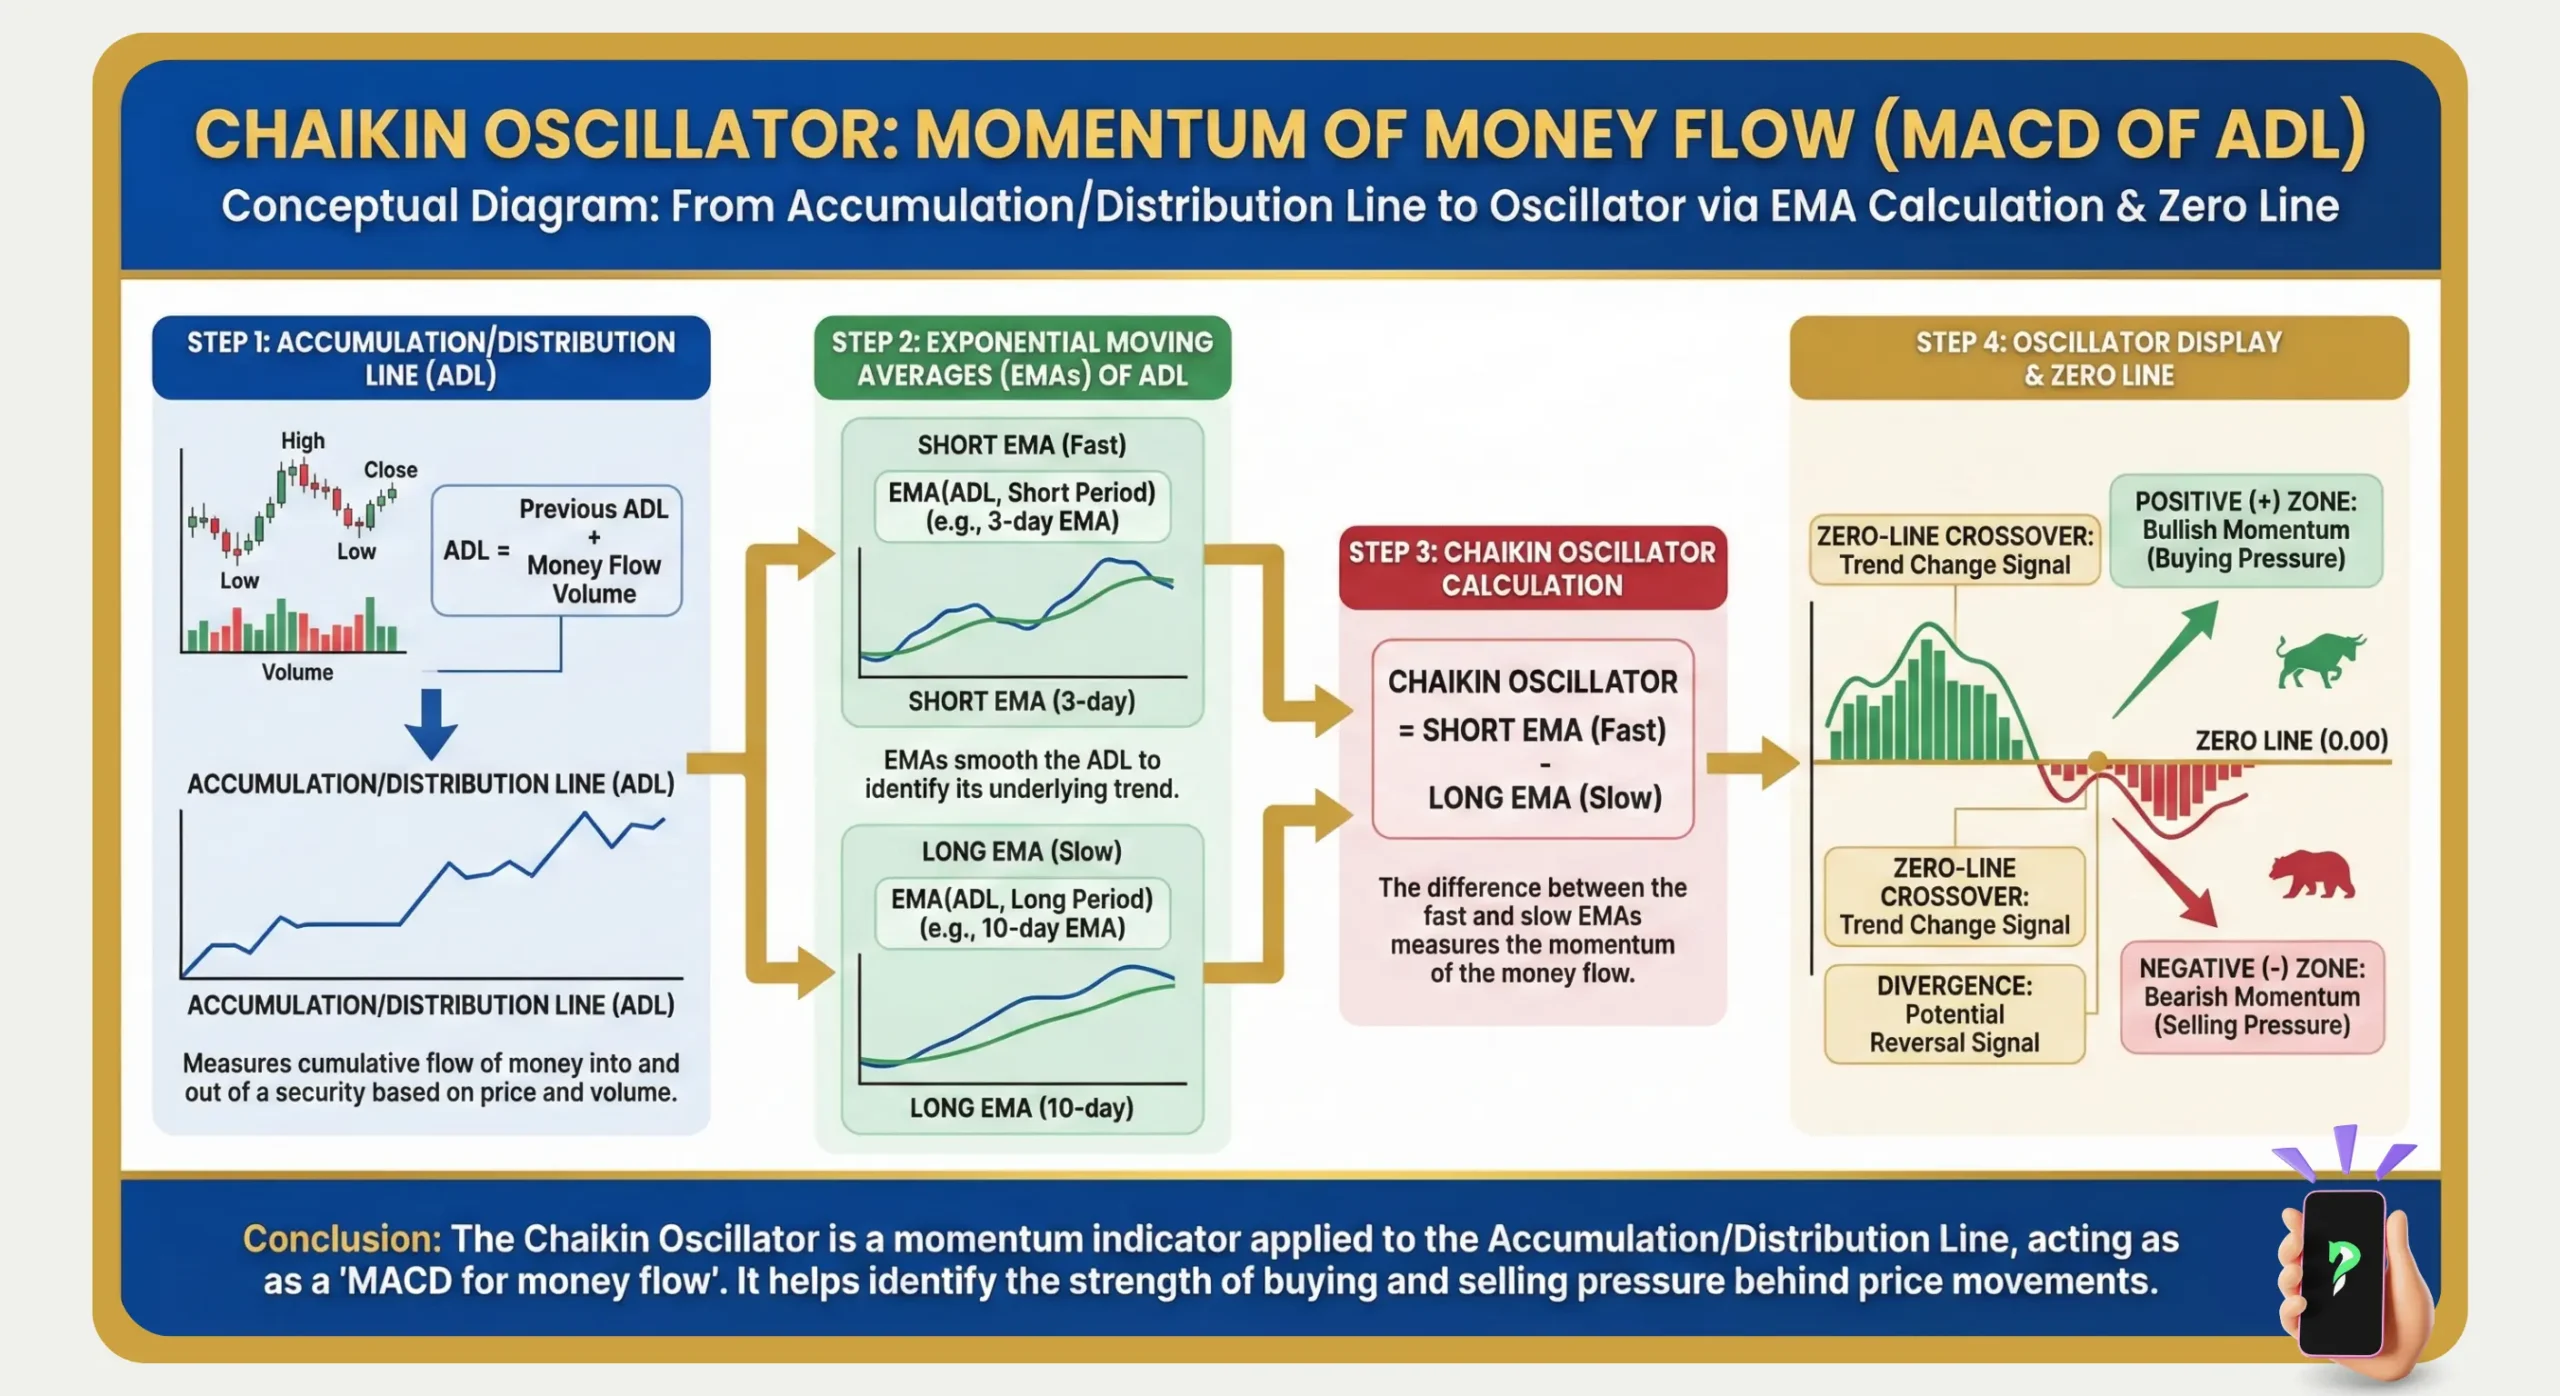
Chaikin Oscillator: Momentum of Money Flow -
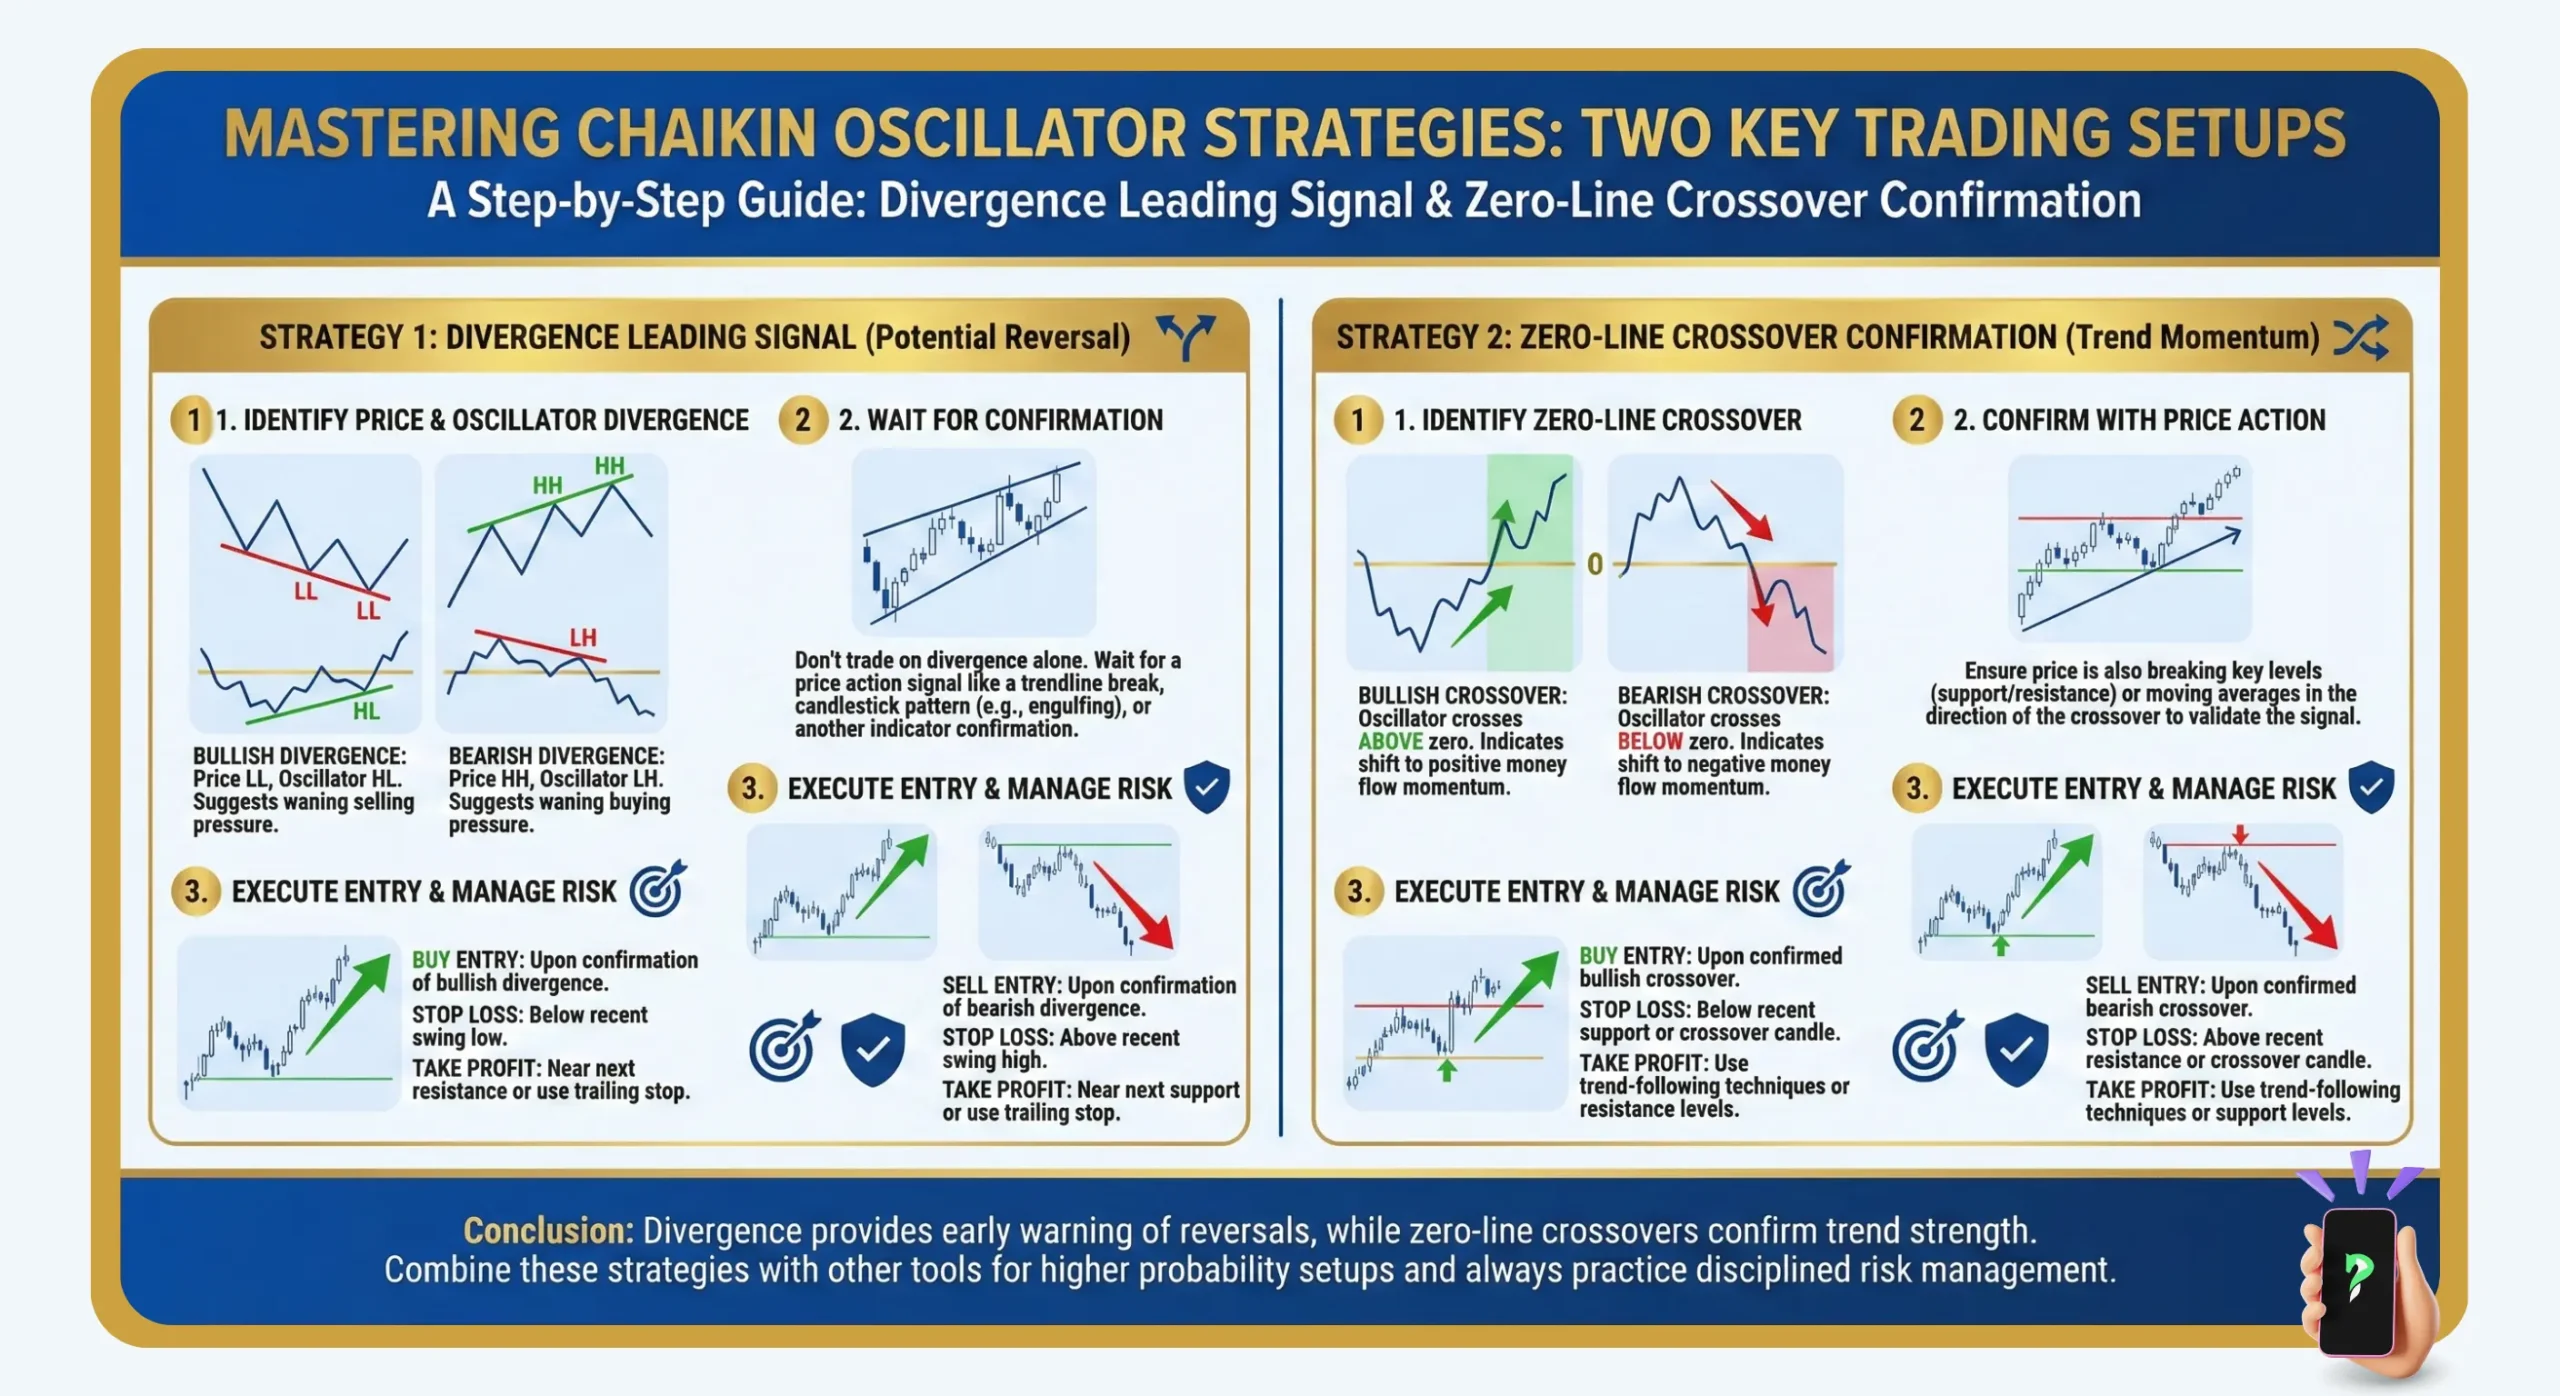
Mastering Chaikin Oscillator Strategies


