
The Commodity Channel Index CCI is a momentum oscillator introduced by Donald Lambert in 1980 (Lambert, 1980). It measures the level of the current price relative to an average price level over a given period of time. The CCI is most useful for reading trend momentum and detecting signs of exhaustion (divergence) before a price reversal occurs.
While originally designed for the commodities market, the CCI has proven to be a versatile tool in Forex trading, providing insights into trend velocity and critical market turning points. This guide examines the mechanics of the CCI, its key features, and three specific strategies designed for the Forex market.
Key Takeaways
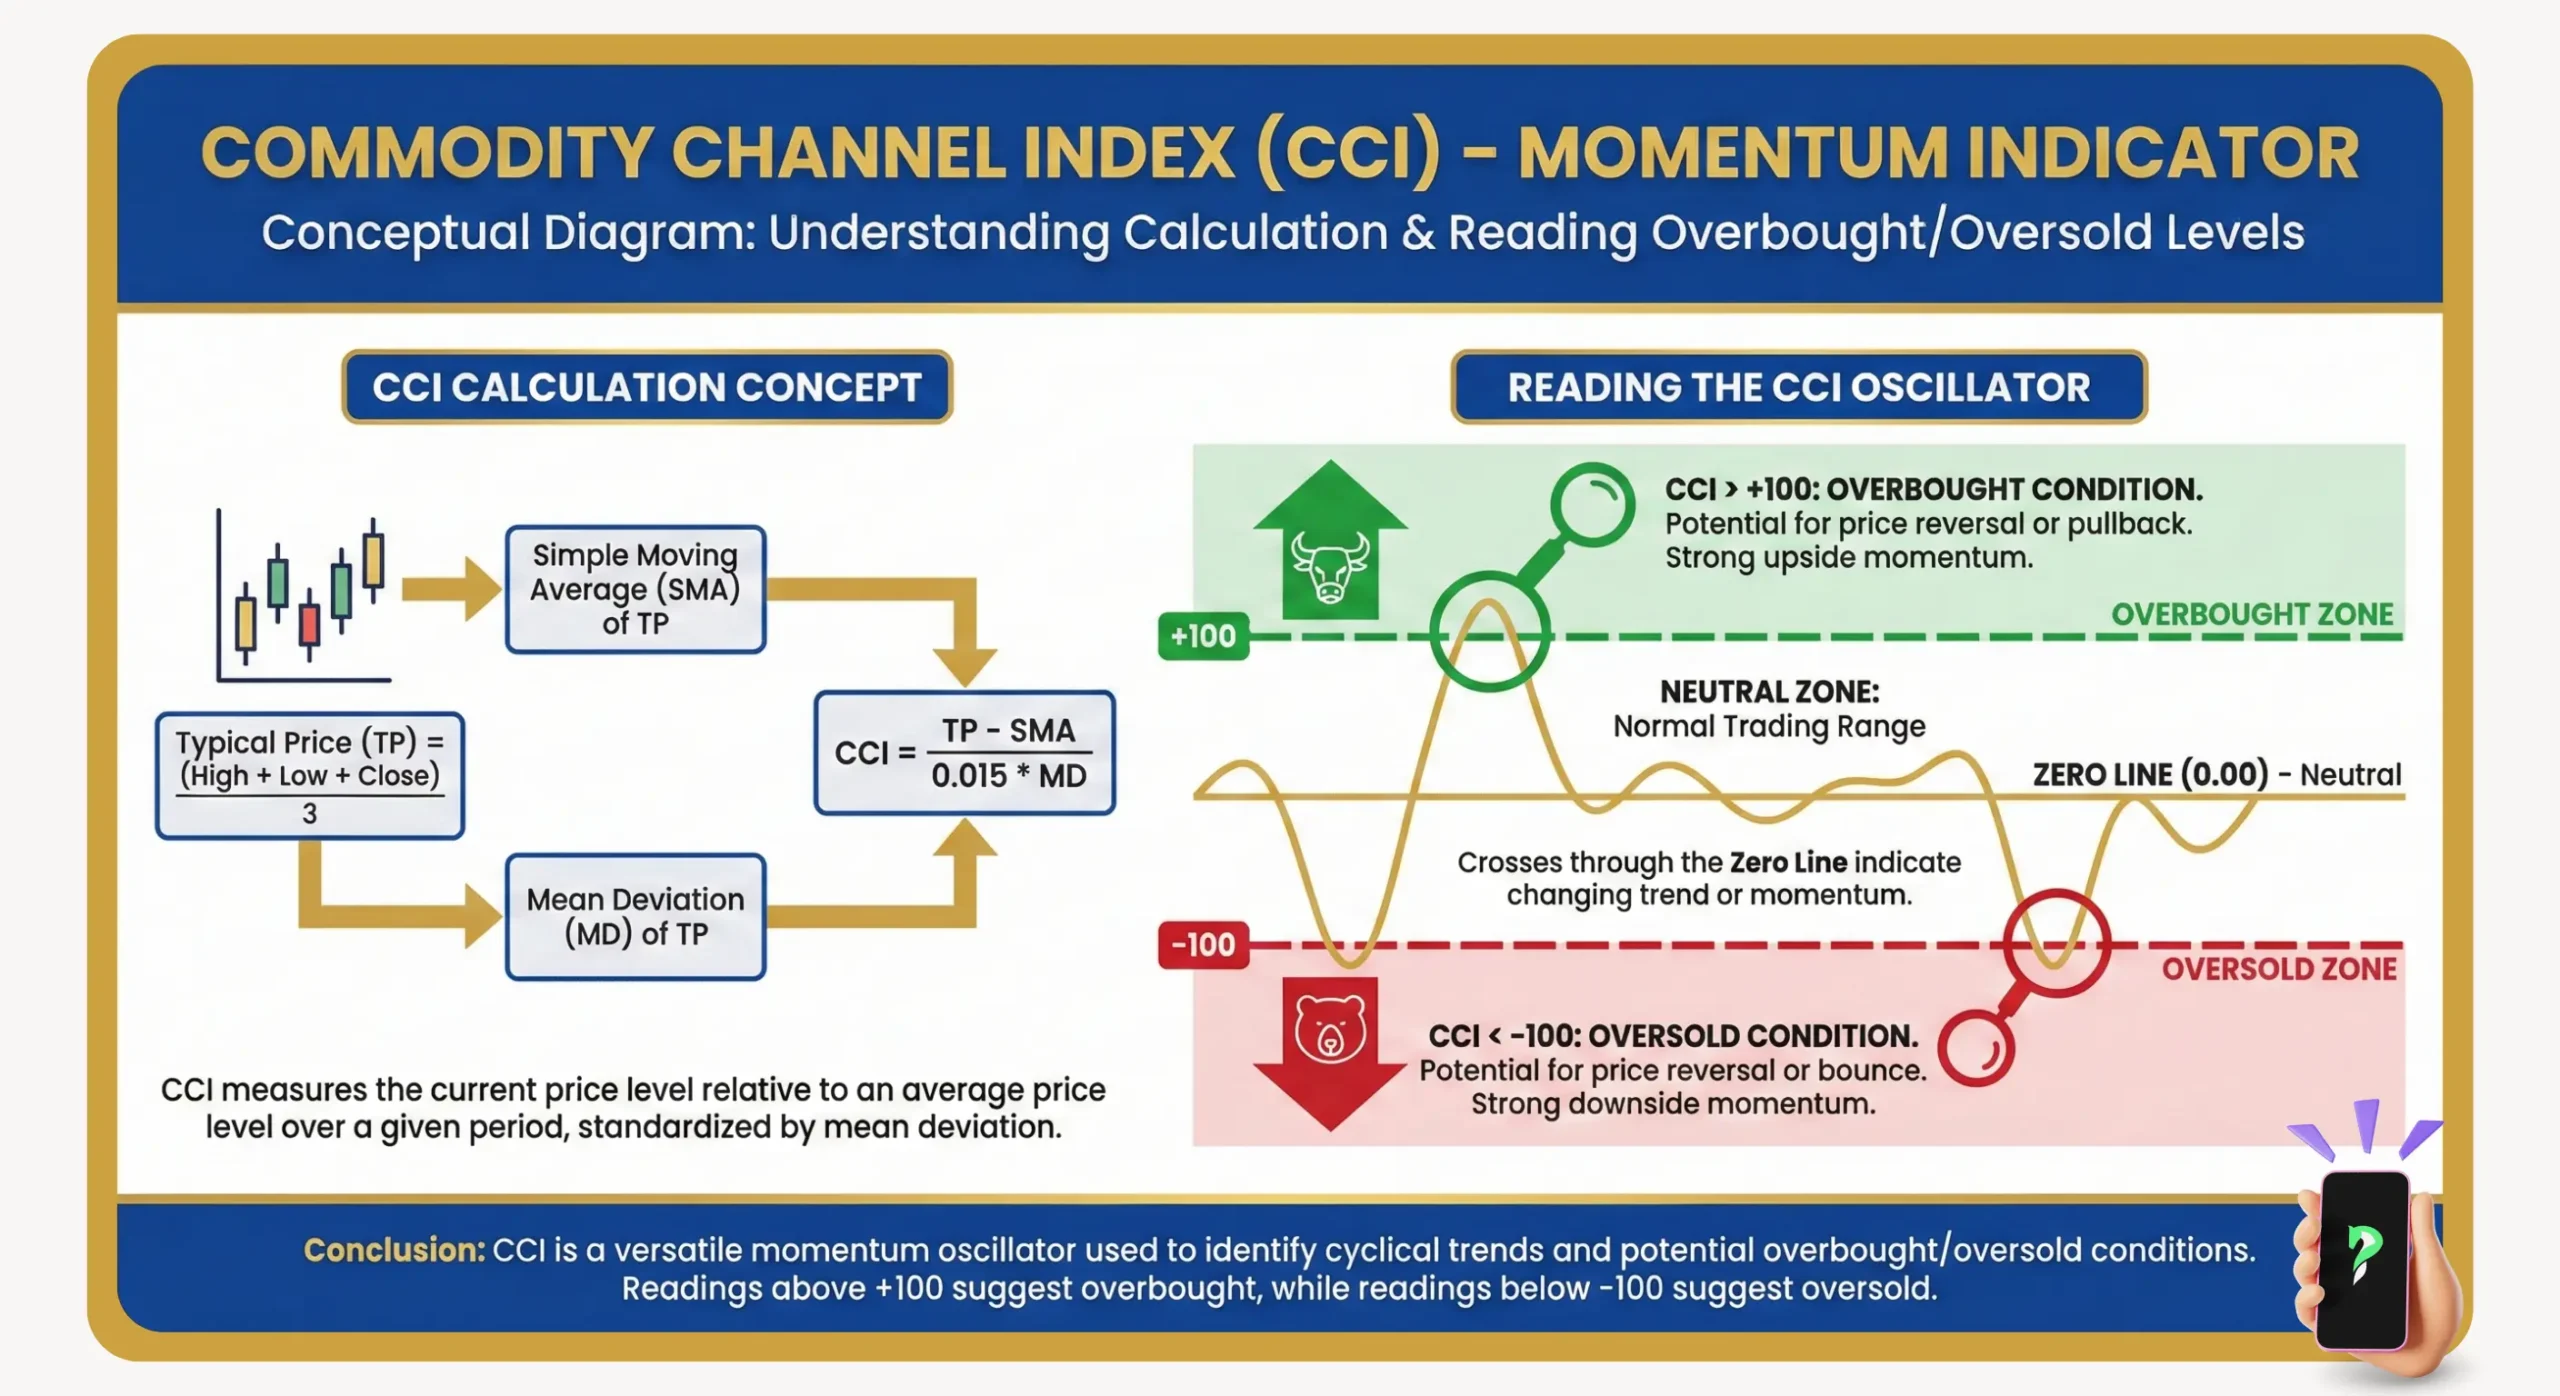
- Calculation Foundation: The CCI measures the distance between the “Typical Price” and its Simple Moving Average (SMA), standardized by mean deviation to reflect price volatility.
- Momentum Filter: The zero line serves as a primary filter; readings above zero generally indicate a bullish bias, while readings below zero indicate a bearish bias.
- Momentum Zones: The +100 and -100 levels are viewed as “strong momentum zones”. Breaching these levels suggests a trend has significant statistical strength rather than being an immediate signal to fade the move.
- Unbounded Nature: Unlike the RSI, which is constrained between 0 and 100, the CCI is unbounded. This allows it to reflect extreme trend strength without “flatlining” at a maximum value.
- Divergence Warning: Divergence between price action and the CCI is a primary early warning sign of trend exhaustion, though it typically requires price action confirmation before an entry is made.
1. What is the Commodity Channel Index (CCI)?
The Commodity Channel Index (CCI) is a momentum-based oscillator introduced by Donald Lambert in 1980 (Lambert, 1980). While Lambert’s initial objective was to identify cyclical shifts and seasonal patterns in commodities, the indicator’s mathematical foundation has made it a universal tool across all asset classes, including Forex.
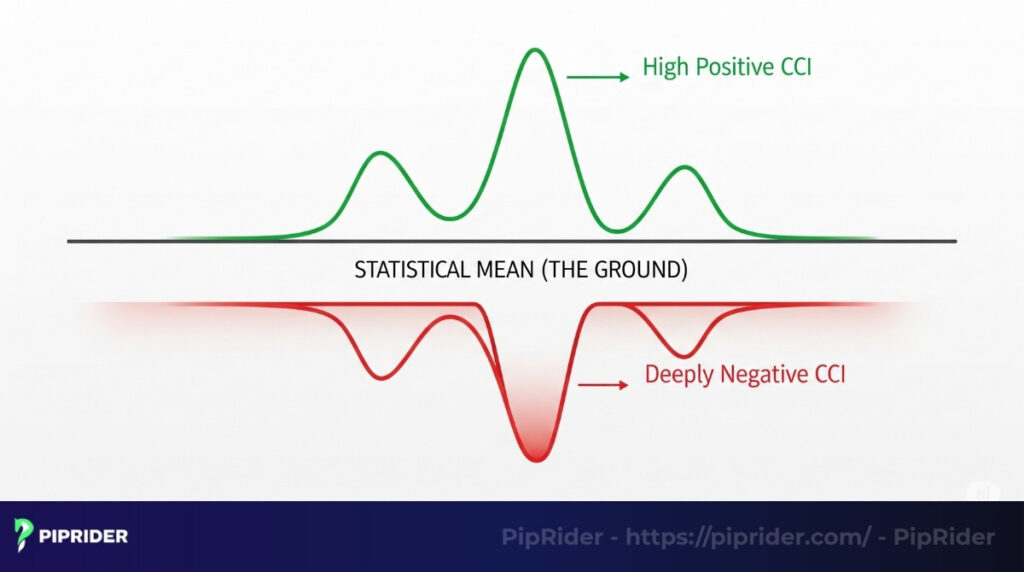
The CCI functions by quantifying the variation of a currency pair’s price from its statistical mean (Fidelity Investments, n.d.). Essentially, it measures how far the current price has strayed from its recent average. For a Forex trader, this provides a gauge of market “stretch”. A high positive CCI value indicates that the price is trading significantly above its mean, signaling bullish momentum. Conversely, a deeply negative reading indicates the price is well below its average, pointing to significant bearish pressure.
The primary utility of the CCI lies in assessing whether a trend is likely to sustain its current velocity or if the momentum is beginning to shift, which often serves as a lead indicator for a broader market turn.
2. Defining Key Features of the CCI Indicator
The CCI possesses several distinct characteristics that differentiate it from other oscillators, offering specific analytical advantages when measuring market dynamics.
A Momentum Gauge
At its core, the CCI measures the velocity of price movement. It functions as a market speedometer, indicating not just the direction of the trend but also how fast the price is moving relative to its average and whether that speed is accelerating or decelerating.
Unbounded by Design
One of the CCI’s most significant features is its unbounded scale. While indicators like the Relative Strength Index (RSI) are locked into a 0-100 range, the CCI has no theoretical upper or lower limits (StockCharts, n.d.). In strong, parabolic Forex trends, the RSI can become “pinned” at extreme levels (e.g., above 70 or 90), providing little new information as the trend continues. The CCI can continue to rise to +200, +300 or higher, accurately reflecting that underlying momentum is still building.
Focus on the Typical Price
Lambert designed the CCI formula using the “Typical Price” rather than the closing price. The Typical Price is the arithmetic average of the period’s high, low, and close: TP = (High + Low + Close) / 3. By incorporating the entire range of the session’s activity, the indicator offers a more balanced and authentic measure of market sentiment, reducing the potential for “noise” created by late-session volatility (TradingView, n.d.).
3. CCI Formula: Step-by-Step Calculation Guide
While modern trading platforms calculate the CCI automatically, understanding its internal logic helps traders interpret its signals more effectively. The formula standardizes the gap between the current price and its moving average to enable consistent comparisons across different timeframes.
Step 1: Calculate the Typical Price (TP)
TP = (High + Low + Close) / 3
Step 2: Calculate the Simple Moving Average (SMA)
Calculate the SMA of the Typical Price over a specific period (commonly 14 or 20). This acts as the baseline or “mean”.
Step 3: Calculate the Mean Deviation
This measures the average distance between the Typical Price and the SMA over the specified period, providing a gauge of recent volatility.
Step 4: The Final CCI Formula
CCI = (Typical Price – SMA of TP) / (0.015 x Mean Deviation)
Lambert used the 0.015 constant to scale the indicator so that the majority of values (approximately 70% to 80%) fall between -100 and +100 (TradingView, n.d.). The exact percentage depends on the lookback period used. This makes any movement beyond these levels statistically significant.
4. How to read and interpret the CCI Indicator
Interpreting the CCI involves monitoring price momentum as it moves across three primary territories: the zero line, the pm 100 thresholds, and extreme zones.
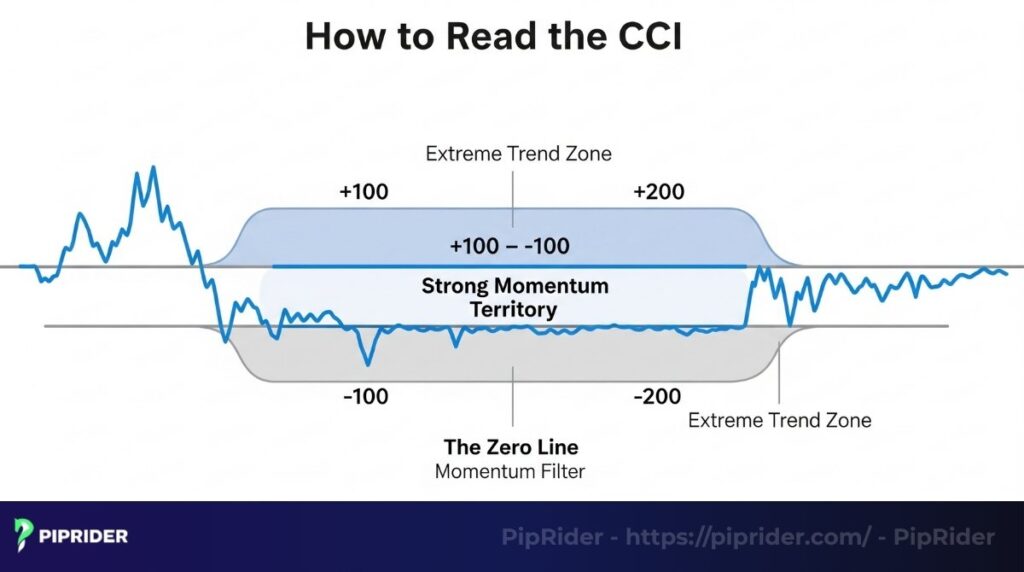
4.1. The zero line
The zero line acts as a simple momentum filter. Generally, when the CCI is above zero, the market is exhibiting a bullish bias as the price is trading above its average. When the CCI is below zero, a bearish bias prevails. Traders often use this line to confirm the direction of the immediate momentum before entering a trade.
4.2. The +100 and -100 levels
Rather than seeing these as simple overbought or oversold markers, these levels indicate that the market has entered “strong momentum territory”. A cross above +100 suggests that the uptrend has achieved significant statistical strength. A common error is to assume a reversal is imminent as soon as these levels are breached. Instead, these levels alert traders to potential trend continuation or eventual exhaustion.
4.3. Extreme readings (+200, -200 and beyond)
When the CCI reaches these levels, it signals an exceptionally powerful, often parabolic trend. While these readings indicate the market is significantly stretched from its mean, they primarily highlight strong market consensus. In such scenarios, it is often more prudent to look for signs of a trend following through or to wait for a clear divergence rather than attempting to pick a top or bottom solely based on the extreme reading.
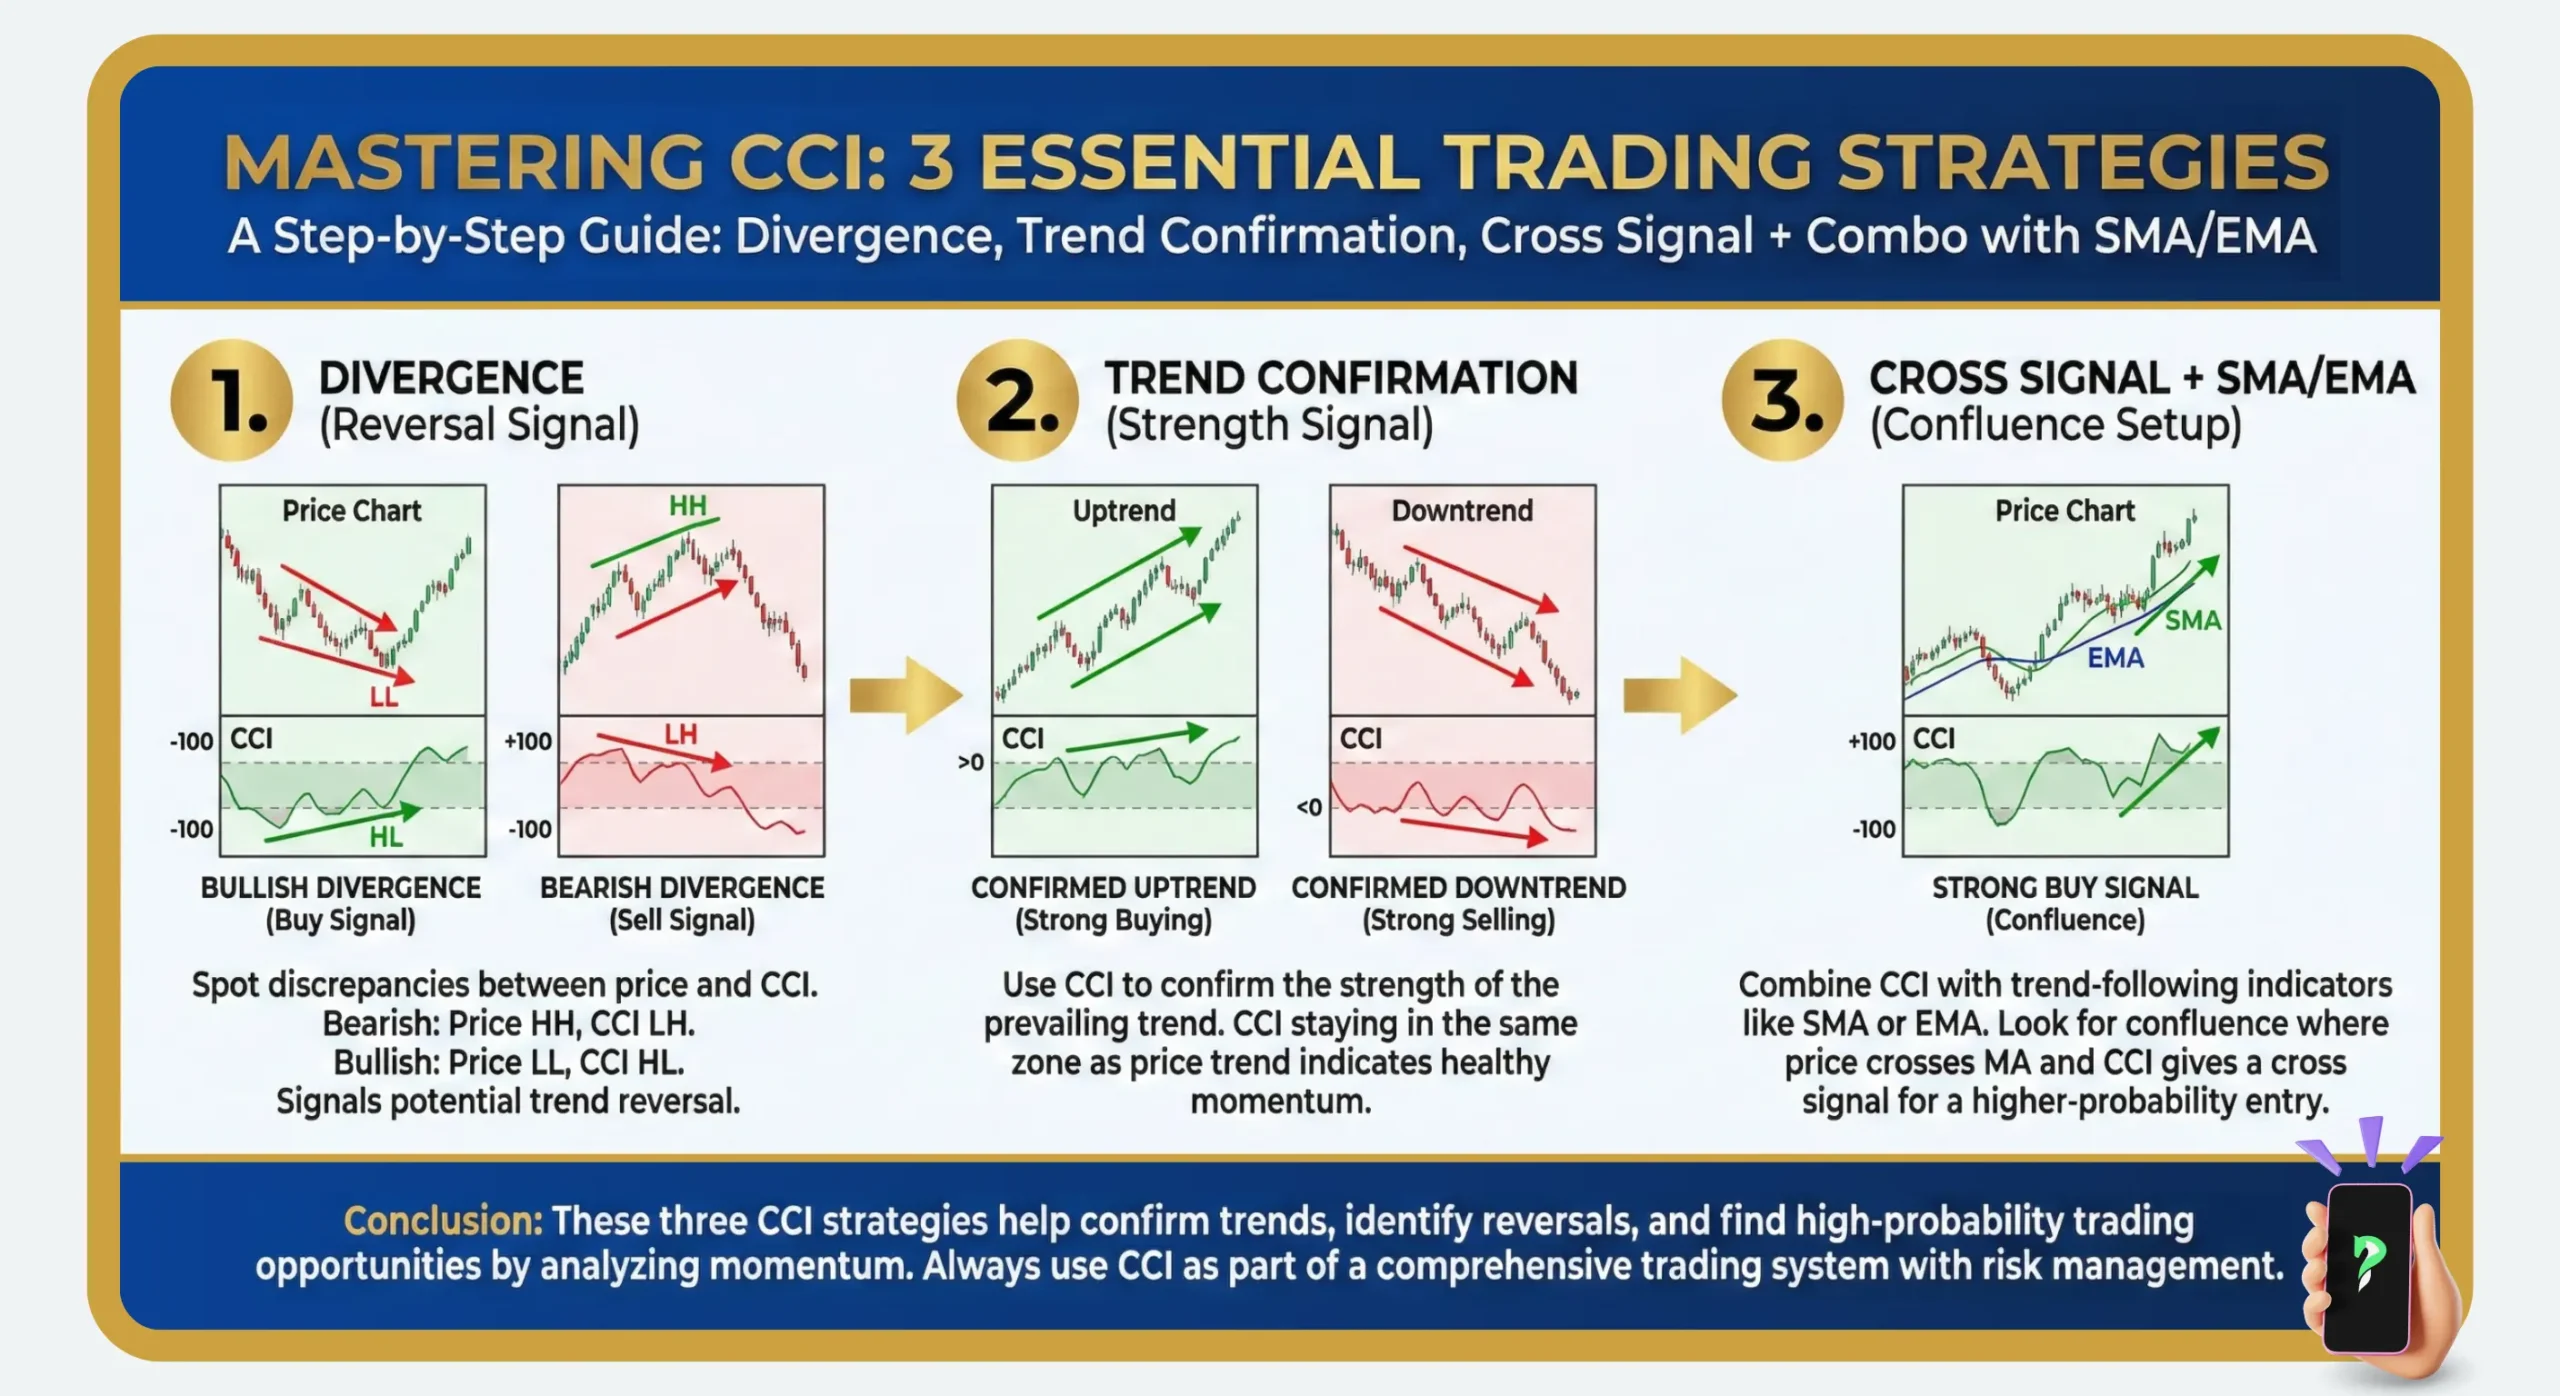
5. 3 Proven Trading Methodologies with CCI in Forex
The following methodologies provide a structured framework for applying the CCI to common Forex market conditions, ranging from momentum shifts to trend confirmation.
5.1. Strategy 1: Momentum Shifts at +/- 100 (Mean Reversion)
This strategy focuses on identifying when extreme momentum is beginning to normalize, suggesting a potential rotation in price.
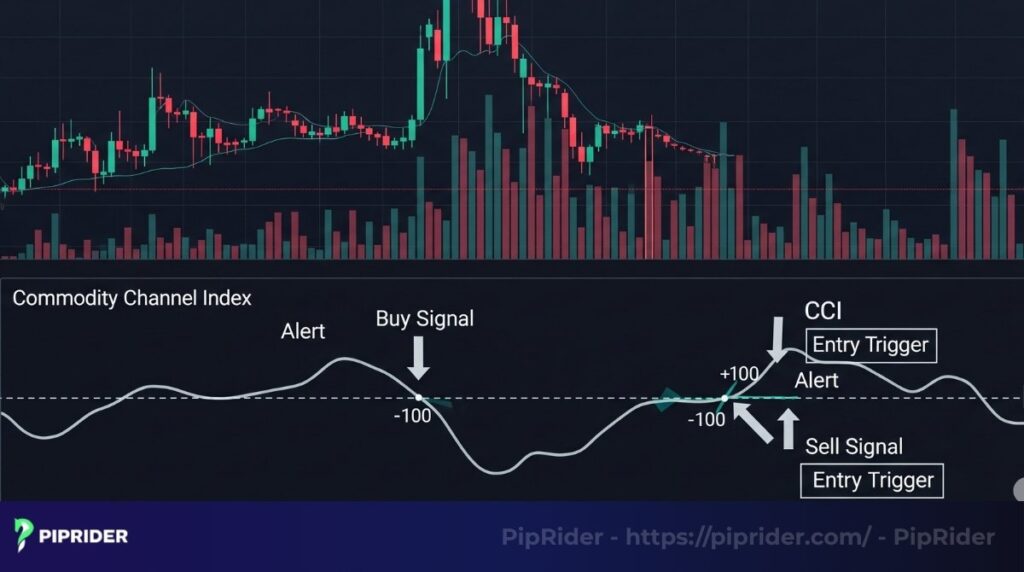
- Setup (Long): The CCI must first drop below -100. The signal triggers only when the CCI subsequently rallies back and crosses above the -100 line, suggesting that bearish momentum is weakening.
- Entry Trigger: Price action must confirm the shift by forming a higher low or breaking a minor market structure on a lower timeframe.
- Stop Loss (SL): Place the SL below the most recent swing low, incorporating a small buffer (such as a percentage of the ATR).
- Take Profit (TP): TP1 is typically the nearest resistance level or the zero line; TP2 can be set as the CCI reaching +100.
- Invalidation: The trade is invalidated if price breaks the swing low before the first target is reached.
5.2. Strategy 2: “Hunting” for reversals with CCI divergence
Divergence occurs when price action and the CCI move in opposite directions, exposing underlying weakness in the prevailing trend.
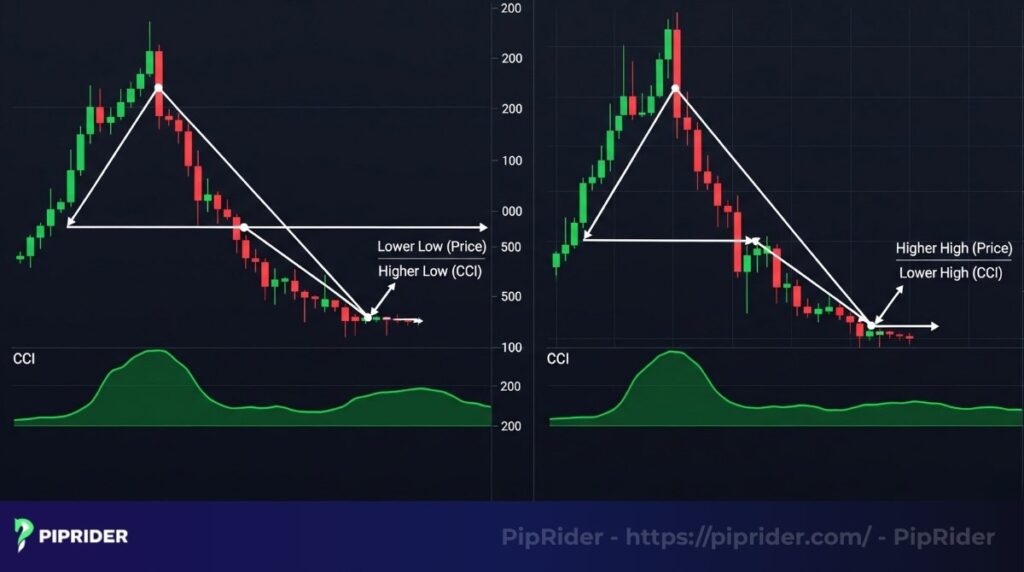
- Bullish Divergence: Price makes a lower low while the CCI makes a higher low.
- Bearish Divergence: Price makes a higher high while the CCI makes a lower high.
- Entry Rule: Never trade divergence in a vacuum. A trade should only be initiated if the divergence occurs at a key support or resistance level. The entry is triggered when price breaks a counter-trendline or the CCI crosses the zero line to confirm a bias shift.
- Stop Loss (SL): Position the SL below the recent divergence low (for longs) or above the divergence high (for shorts).
- No-Trade Zone: Avoid divergence signals that appear in the middle of a range without structural support or resistance.
5.3. Strategy 3: Using the Zero Line Crossover for trend confirmation
This is a trend-following approach that uses the zero line as a confirmation tool rather than an independent entry trigger.
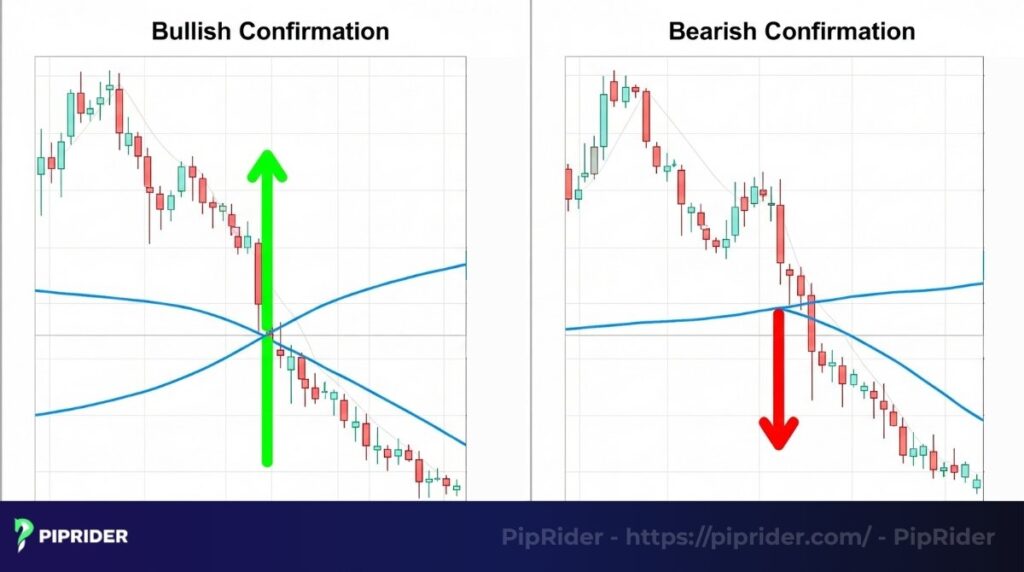
- Filter: To avoid whipsaws, only take long signals if price is above a long-term moving average (e.g., 50-period or 200-period SMA). Only take short signals if price is below the moving average.
- Bullish Confirmation: When the trend filter is bullish, a CCI cross from below to above the zero line confirms an increase in buying pressure.
- Entry: Trigger the trade when the zero-line cross coincides with a price breakout or a successful pullback to the moving average.
- Exit: Exit the position when the CCI crosses back over the zero line in the opposite direction or price closes beyond a structural trend level.
6. Optimizing CCI settings for Forex trading
While a 14 or 20-period lookback is standard, traders should align their settings with their specific methodology and timeframe.
| Criteria | Scalping | Day Trading | Swing Trading |
|---|---|---|---|
| Main Objective | Capture small price movements (pips) rapidly | Capture intraday waves within one session | Ride major market swings over days/weeks |
| Timeframe | M1, M5, M15 (Common: M5) | M15, M30, H1 (Common: H1) | H4, D1, W1 (Common: D1) |
| CCI Period | 5 – 10 (High sensitivity) | 14 – 20 (Balanced) | 30 – 50 (Filters market noise) |
| Core Strategy | Quick reversals from extreme zones (+/- 200) | Standard +/- 100 shifts and divergence | D1/H4 divergence and zero-line trend shifts |
| Risk Management | SL must be placed based on structure and volatility (ATR) | Focus on higher timeframe trend alignment | Requires wider SL and smaller position sizes |
Important Note on Risk: Regardless of the timeframe, we advise beginning with the default 20-period setting to understand the indicator’s behavior before adjusting for sensitivity. Shorter periods increase responsiveness but lead to more “false” signals (noise).
7. CCI vs. RSI: Which Indicator is Better for Forex?
Both the CCI and the RSI are highly effective momentum oscillators, but they are often utilized differently based on the market regime.
- The Core Difference: The RSI’s value is constrained within a fixed corridor of 0 to 100. The CCI is “unbounded”, meaning it can reflect extreme momentum without reaching a maximum limit.
- Application: In a strong trending market, the CCI’s unbounded design often provides a clearer gauge of how much momentum remains in a move. Conversely, the RSI is widely regarded as a superior tool for identifying overbought and oversold conditions in range-bound or sideways markets.
Many traders use both indicators in tandem: the RSI for structural support/resistance analysis in ranges, and the CCI to measure the raw power of trending breakouts.
8. Pitfalls to avoid when using the CCI in Forex
While a powerful tool, the CCI can lead to significant errors if its signals are interpreted in isolation.
8.1. Counter-Trend Trading in Strong Momentum
A frequent error is assuming that a breach of the +100 or +200 levels automatically signifies that a market is “overbought” and due for a reversal. As discussed, these are signals of statistical strength. It is recommended to wait for definitive evidence of weakness, such as a confirmed divergence or a cross back into the neutral channel, before considering a counter-trend position.
8.2. Trading Without Structural Confluence
A CCI signal’s probability of success increases when aligned with structural technical analysis. A bullish divergence occurring at a major historical support zone is a significantly more reliable signal than one appearing in the middle of a price range.
9. Frequently asked questions (FAQs)
10. Conclusion
The Commodity Channel Index (CCI) is a versatile instrument for gauging the velocity and sustainability of market momentum. By moving beyond simple overbought/oversold interpretations and focusing on statistical deviations from the mean, traders can gain a clearer perspective on trend strength and potential exhaustion points. As with all technical indicators, the CCI is most effective when validated by price action and governed by disciplined risk management.
Infographic Section
-
Commodity Channel Index – Momentum Indicator -
Mastering CCI: 3 Essential Trading Strategies -
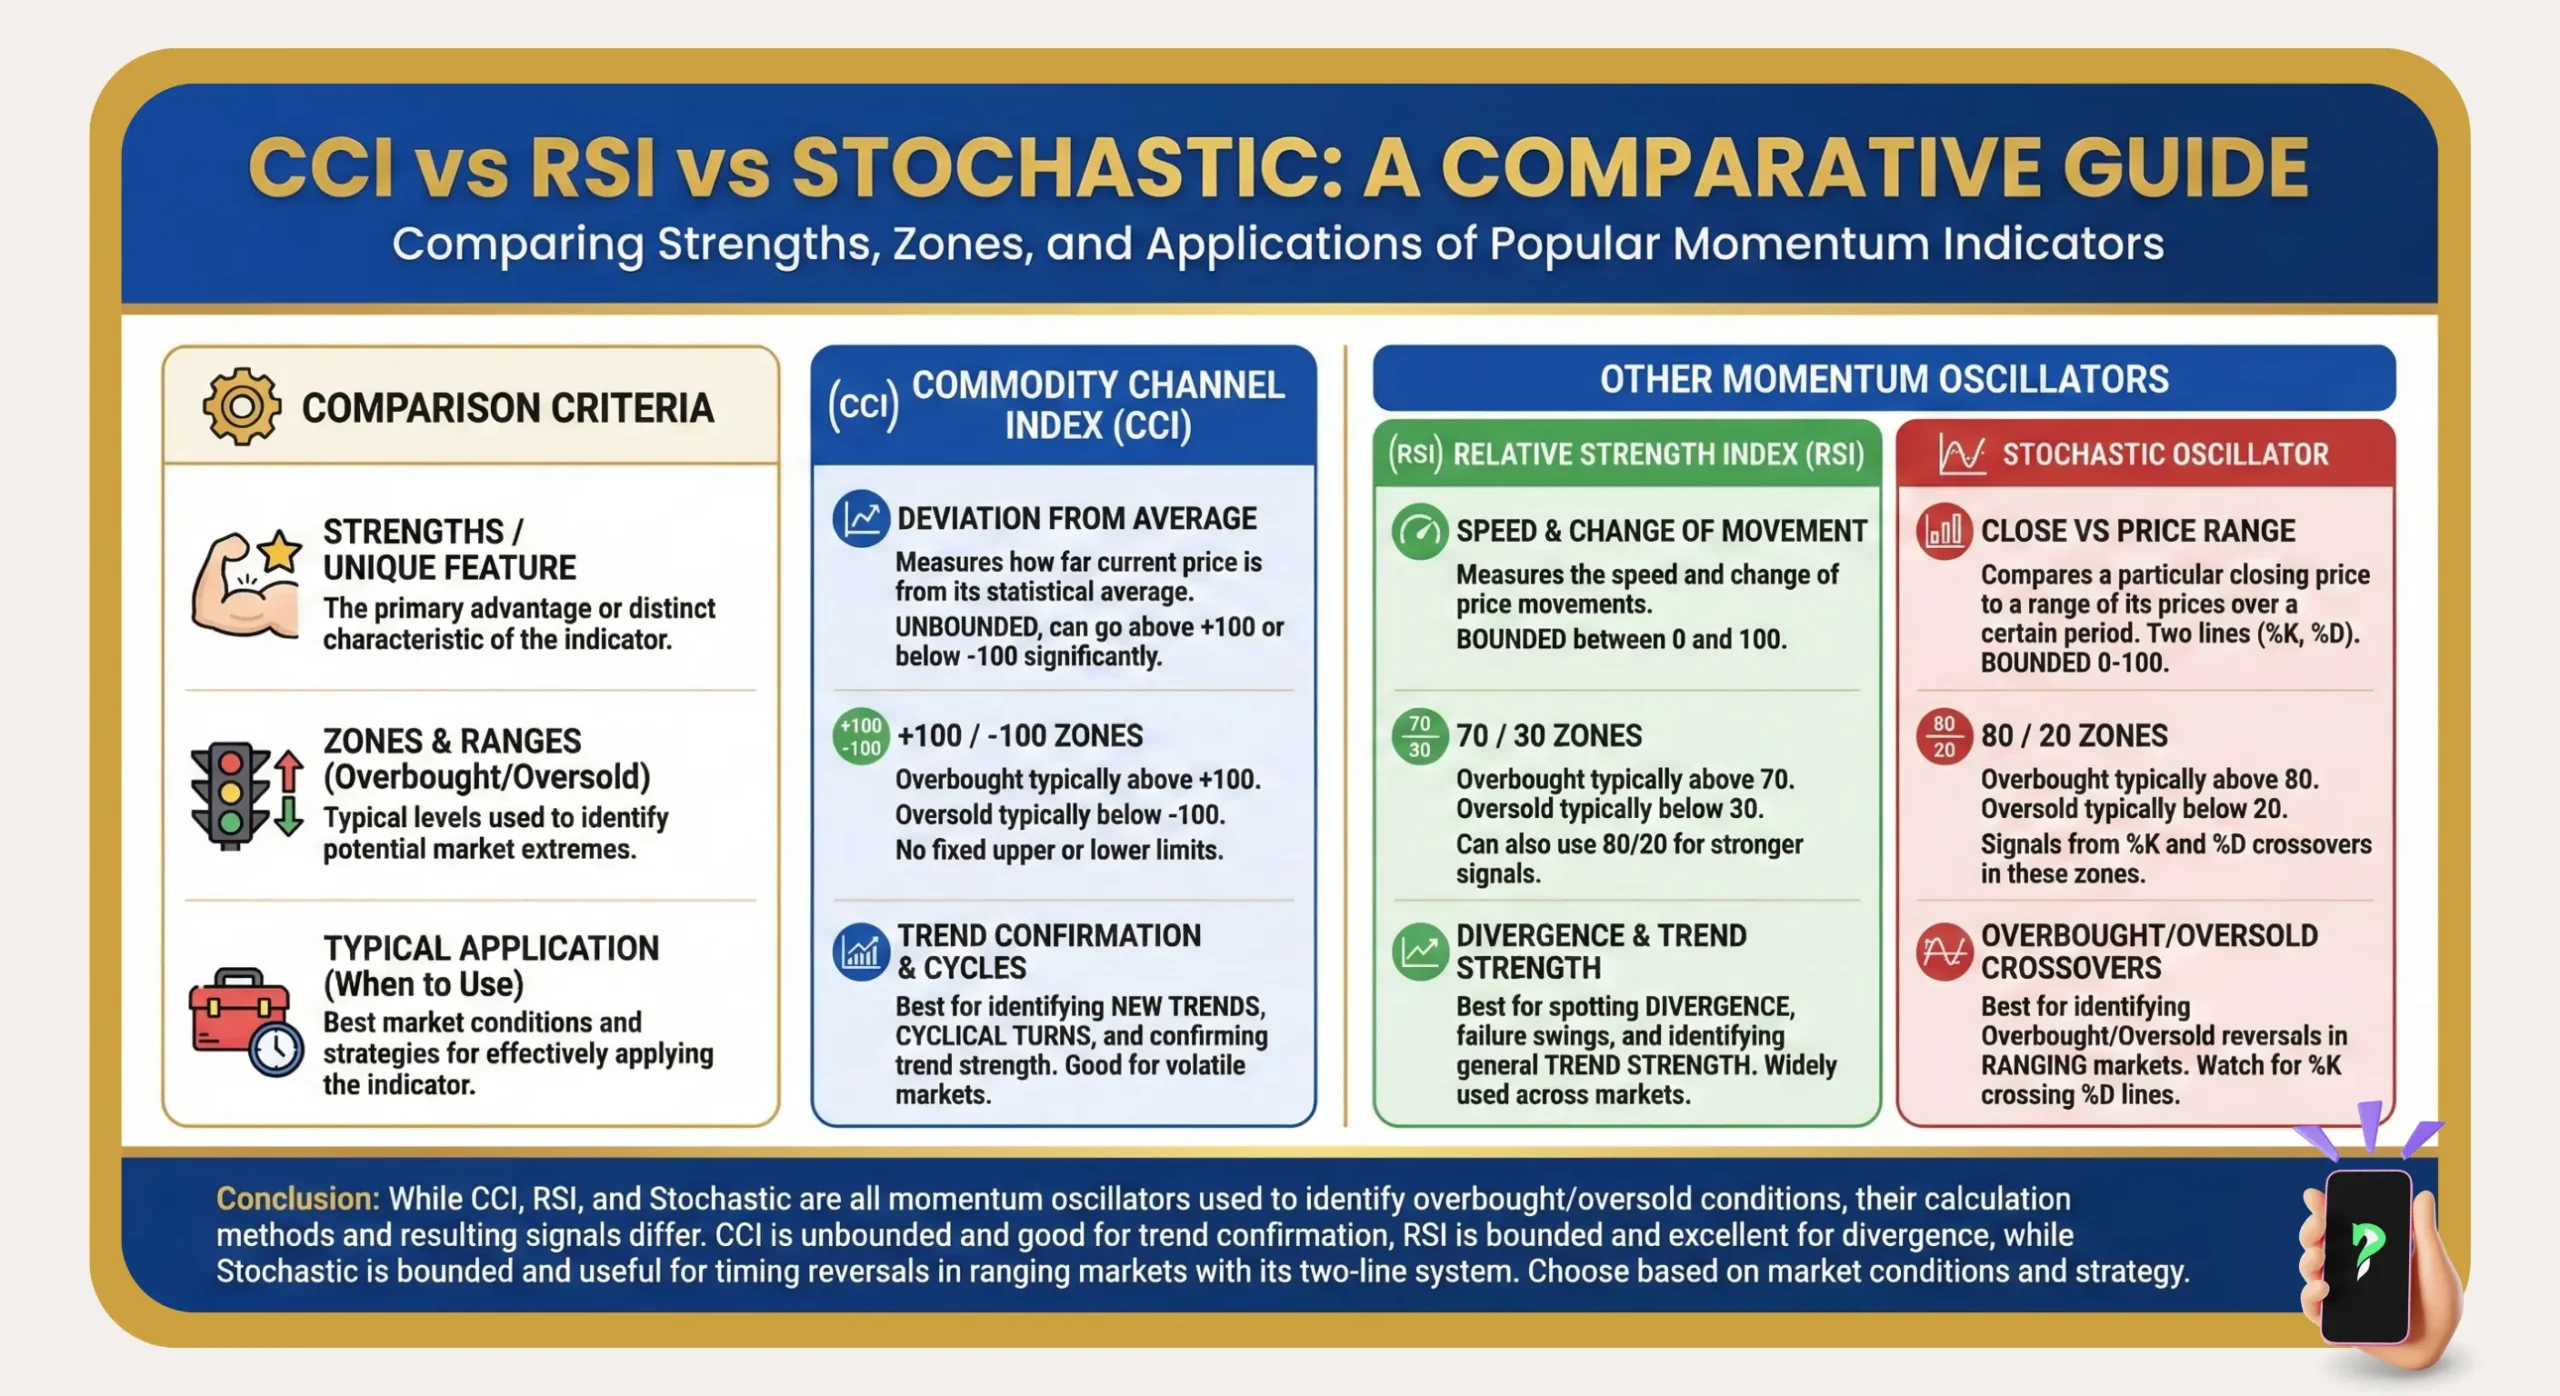
CCI vs. RSI vs. Stochastic: A Comparative Guide


