

Have you ever jumped into what looked like a powerful trend, only to have it run out of momentum the moment you entered? It’s a deeply frustrating experience that every trader faces. This is often the result of ignoring market velocity.
In the trading world, “Momentum” acts as a market speedometer. It doesn’t just tell you where the price is going; it tells you how fast it’s traveling and when it’s likely to run out of fuel. This guide will deep-dive into the core Momentum (MOM) indicator and explore 6 essential tools to help you master trend strength.
Key Takeaways
- Momentum tools measure the speed of price changes, helping you assess a trend’s true strength.
- This guide covers 6 top tools, including the RSI, MACD, and Stochastic.
- Their most powerful signals come from identifying overbought/oversold levels, spotting divergences, and confirming trends with crossovers.
- These indicators are confirmation tools and should never be used in isolation.
- The “best” indicator is subjective; the choice depends on your strategy and market conditions.
1. What is the Momentum (MOM) Indicator?
The Momentum indicator (often abbreviated as MOM) is a leading technical tool that measures the rate of change of an asset’s price. Unlike lagging indicators like Moving Averages, the MOM indicator focuses on the current speed of the move, often turning before the price itself does.
Primary Goal: To identify when a trend is gaining strength (acceleration) or losing steam (exhaustion) so you can time your entries and exits with precision.
Market Psychology: It reflects the “mass enthusiasm” or “panic” in the market. When momentum accelerates, it shows that more participants are jumping on the bandwagon. When it decelerates, the “smart money” is likely exiting.
2. Types of momentum indicators
Not all of these tools are created equal. They fall into two main families, and knowing which one to use is crucial because each is designed for a completely different job.
One family is built for markets moving sideways, while the other excels when the market is in a clear, powerful trend.
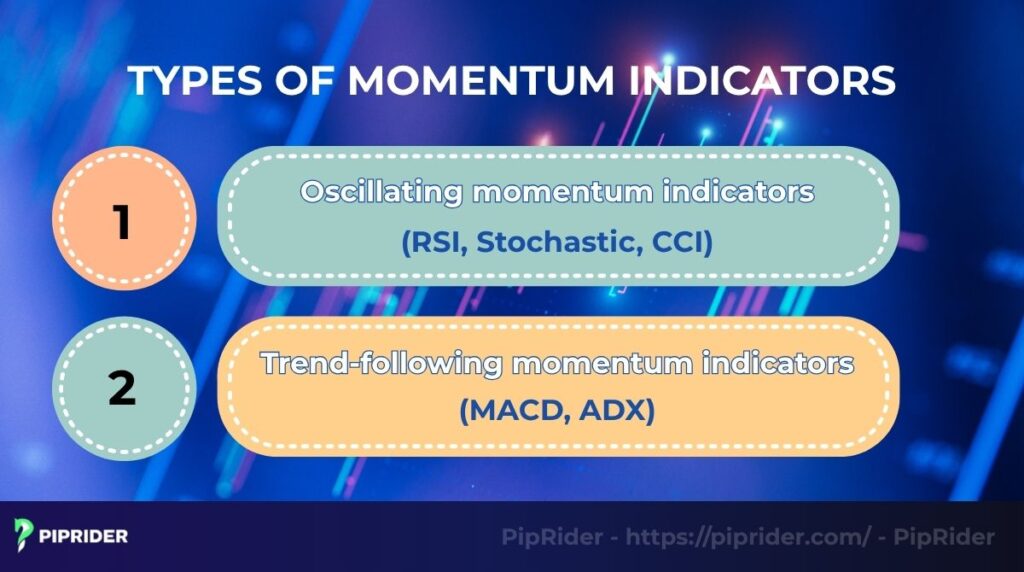
2.1. Oscillating momentum indicators
The first family of indicators is designed to operate within a fixed range, typically from 0 to 100. Because they are bounded, they are perfectly suited for identifying overbought and oversold levels. The goal is to spot when a market has moved too far, too fast, and is due for a reversal. They don’t measure pure trend velocity but rather the health of a trend.
- When to use them: When you’re looking for signs that a market is exhausted and a reversal is likely.
- Examples: The Relative Strength Index (RSI) and the Stochastic Oscillator.
2.2. Trend-following momentum indicators
The second family has no upper or lower limits, instead oscillating above and below a central zero line. Because they are unbounded, they are ideal for measuring raw momentum. Their primary purpose is to confirm trend power and velocity. A rising line above zero indicates that the momentum behind an uptrend is accelerating, while a falling line below zero shows that selling pressure is gaining speed.
- When to use them: When you want to confirm the power of a trend or spot disagreements between price and momentum.
- Examples: The Rate of Change (ROC) and the Moving Average Convergence Divergence (MACD).
Knowing the difference is critical. You wouldn’t use a speedometer to measure how much fuel is left in the tank. Similarly, you wouldn’t use an overbought/oversold indicator to measure a trend’s velocity.
3. Formula, Baselines, and Technical Setup
Understanding how the indicator is built is crucial for interpreting its signals on platforms like MetaTrader 5 or TradingView.
3.1. The Formula: Ratio vs. Difference
There are two primary ways to calculate momentum:
- The Ratio Method (Common on MT4/MT5) – This creates a baseline at 100:
Momentum = (Current Close / Close 'n' periods ago) x 100
- The Difference Method (Classic) – This creates a baseline at 0:
Momentum = Current Close - Close 'n' periods ago
While the visual look is similar, the Ratio Method is preferred in Forex because it normalizes the data, making it easier to compare across different currency pairs.
3.2. Default Settings & Baseline 100
- Default Period:14 is the industry standard.
- Lower (7-10): More signals, but higher risk of market “noise.”
- Higher (20-50): Smoother, best for identifying major institutional trends.
- The 100 Centerline: This is the point of equilibrium.
- Crossing above 100: Signals that price is rising faster than the historical average (Bullish).
- Crossing below 100: Signals that price is falling faster than the historical average (Bearish).
3.3. How to Setup on MT4/MT5
- Open your platform and go to Insert > Indicators > Oscillators > Momentum.
- Set the period to 14 and apply to Close.
- Ensure the “Levels” tab has the 100 level added (or 0 if your platform uses the difference method).
4. How to Read Momentum (MOM) Signals
The MOM indicator provides three high-probability signals that every trader should master:
- Centerline (100) Crossovers: This is the most basic entry signal. When the line breaks above 100, it’s a signal of a new bullish surge. However, to avoid “whipsaws,” professional traders wait for a candle to close above a recent swing high simultaneously with the crossover.
- Momentum Divergence: This occurs when the price action and the indicator disagree.
- Bearish Divergence: Price makes a Higher High, but MOM makes a Lower High. (Warning: Trend is losing internal fuel).
- Bullish Divergence: Price makes a Lower Low, but MOM makes a Higher Low. (Warning: Sellers are exhausted).
- Overextension (Extreme Peaks): Unlike bounded oscillators like RSI, the MOM indicator is unbounded. However, extreme vertical spikes often represent a “buying climax” or “selling panic,” suggesting the market is overextended and due for a mean-reversion.
5. Top 6 Momentum Tools for Forex Trading
While the MOM indicator is the “purest” measure of speed, combining it with other specialized tools can provide a clearer picture of the market.
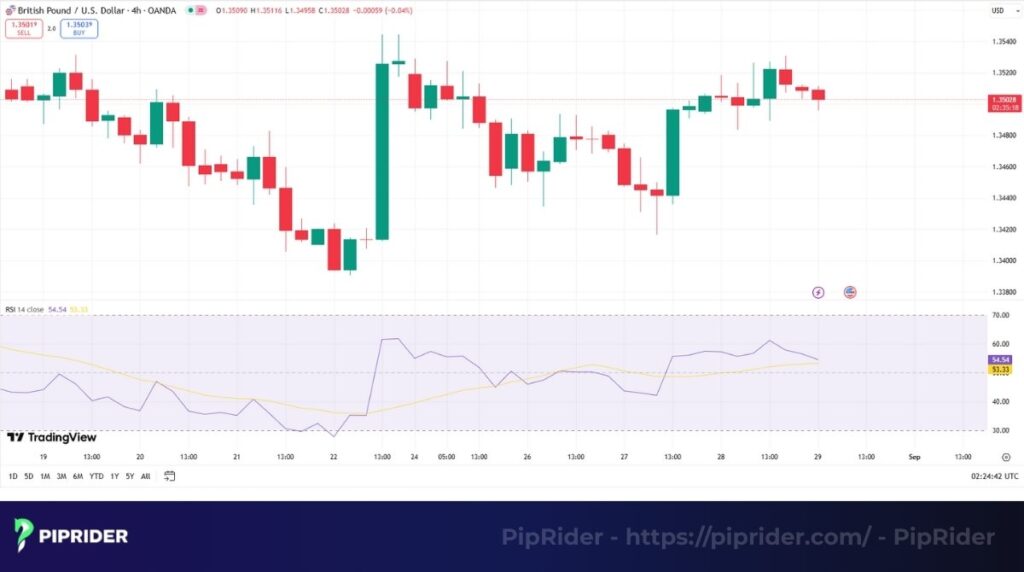
5.1. RSI (Relative Strength Index)
The RSI is perhaps the most famous momentum oscillator, measuring the magnitude of recent price changes to evaluate overbought or oversold conditions.
How to read its signals:
- The 70/30 Myth: Many beginners sell as soon as RSI hits 70. However, in a strong trend, RSI can stay “Overbought” for a long time. The real signal is the Failure Swing: RSI hits 75, drops to 60, then rises to only 68 before breaking the 60 support.
- The 50 Level Filter: Think of the 50 line as the “Speed Limit.” If RSI is above 50, only look for Buy setups. This simple rule filters out 50% of losing counter-trend trades.
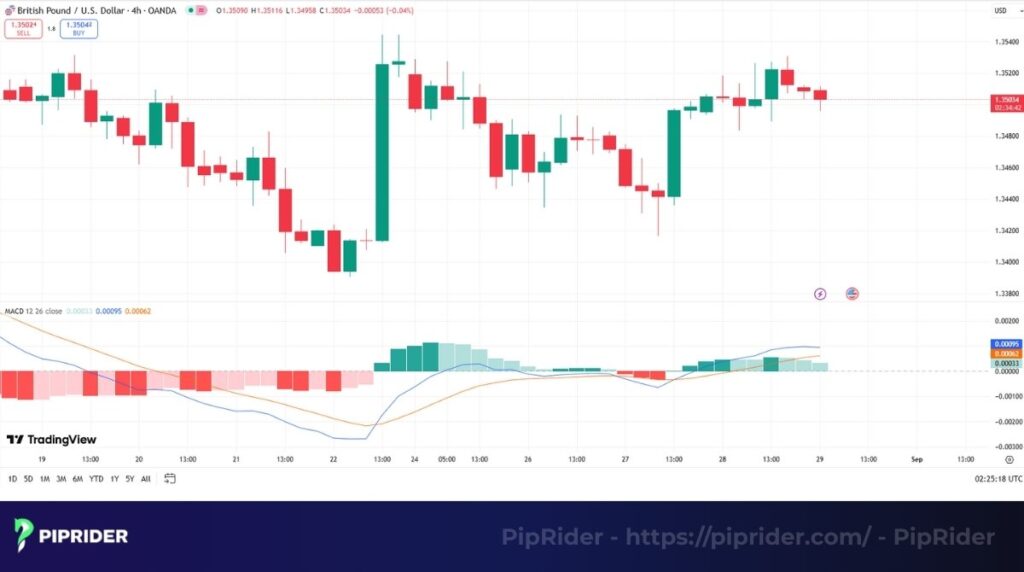
5.2. MACD (Moving Average Convergence Divergence)
MACD is a unique hybrid that combines trend-following and momentum. It uses the difference between a 12 and 26-period EMA.
How to read its signals:
- The Signal Line Cross: The “Fast” MACD line crossing the “Slow” Signal line is your trigger.
- The Histogram’s Secret: The histogram measures the distance between the two lines. When the histogram starts to shrink (Convergence) even while price is trending, it’s an early warning that the “internal” momentum is dying.
- Standard Setup: (12, 26, 9) is the industry standard for all timeframes.
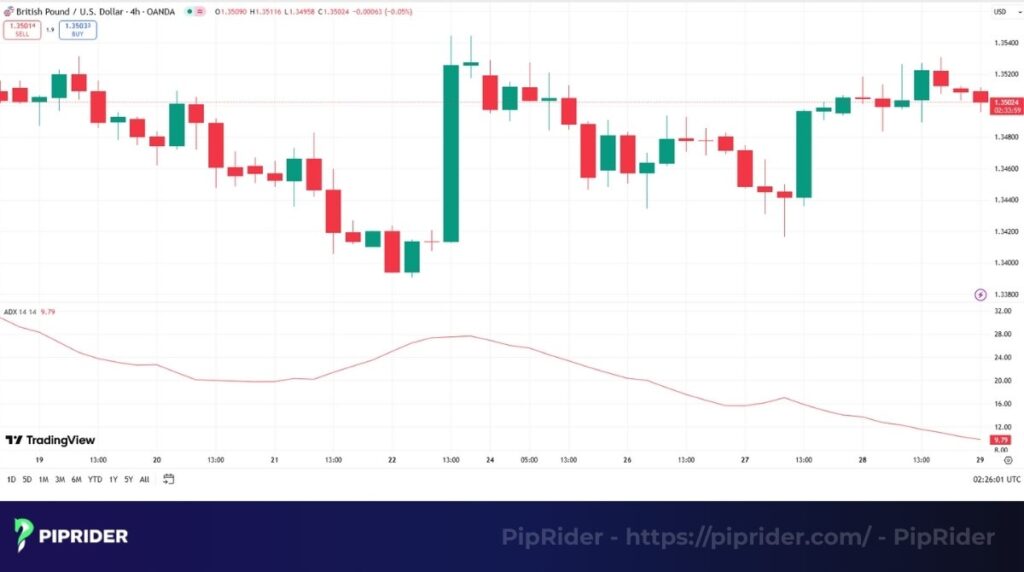
5.3. ADX (Average Directional Index)
ADX is often misunderstood because it doesn’t show direction—only Strength.
How to read its signals:
- The 25 Threshold: Below 25, the market is “choppy” or ranging. Indicators like RSI or Stochastic will work best here. Above 25, a real trend has started.
- The 40+ Zone: When ADX crosses 40, you are in a “Power Trend.” This is not the time to look for reversals; it is the time to ride the trend until the ADX line begins to slope downward.
- DMI Components: Most traders use ADX with +DI and -DI lines to identify which side (bulls or bears) is winning the strength battle.
5.4. CCI (Commodity Channel Index)
The CCI measures the current price level relative to an average price level over a given period of time.
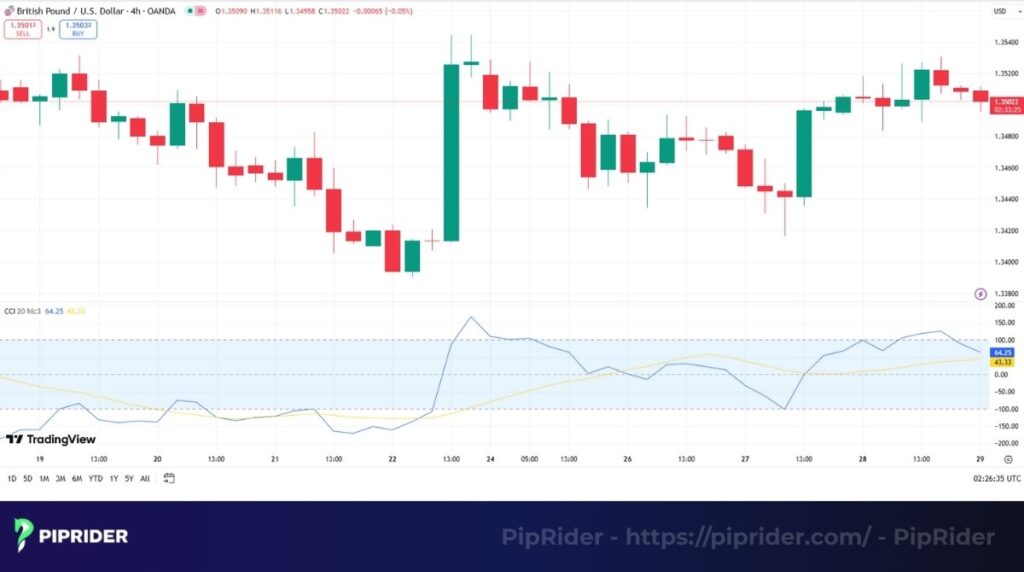
How to read its signals:
- The +100/-100 Breakout: While RSI is bounded by 0-100, CCI is unbounded. A break above +100 signals a “Momentum Burst”—a surge in buying power that often leads to a sustained move.
- The Zero Line Cross: Crossing the zero line from below is a signal that the average price is turning bullish. It’s excellent for catching new trends early.
5.5. Stochastic Oscillator
Stochastic follows the speed or the momentum of price. As a rule, momentum changes direction before price.
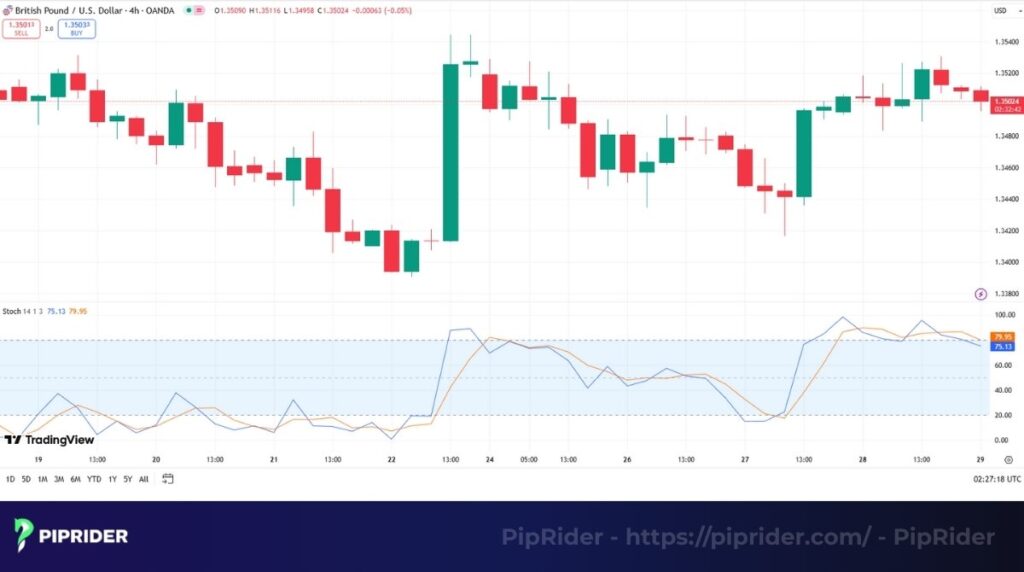
How to read its signals:
- The 80/20 Zones: It is more sensitive than RSI. In a ranging market, a “K” line crossing the “D” line above 80 is a high-probability sell signal.
- Fast vs. Slow: We recommend the Slow Stochastic (14, 3, 3) for Forex. It filters out the erratic “whipsaws” that occur on lower timeframes like M15.
5.6. TRIX (Triple Exponential Average)
TRIX is a momentum indicator that displays the percent rate of change of a triple exponentially smoothed moving average.
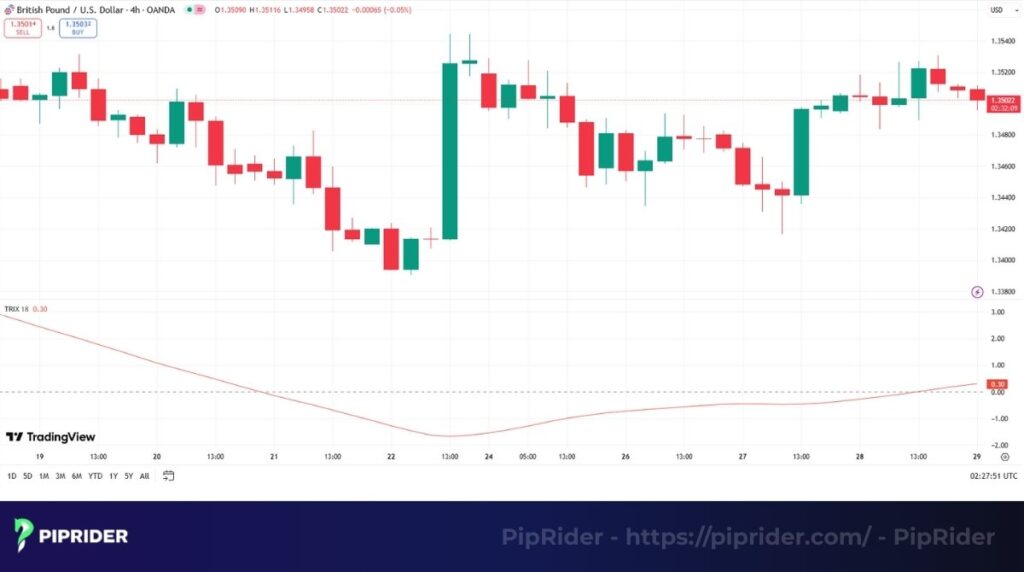
How to read its signals:
- Eliminating Market Noise: Because it is smoothed three times, it is remarkably stable. It is the “cleanest” way to see the underlying trend without being distracted by minor price spikes.
- Zero-Cross & Divergence: Like the MOM indicator, the Zero-cross is your primary signal. It is particularly effective on higher timeframes (H4 and Daily) to identify major institutional accumulation or distribution.
We realize we’ve covered a great deal of information here. To make it easier, we’ve created this simple table to help you quickly compare these six indicators and decide which one might be the right tool for the specific job you have in mind.
Summary: Choosing the right tool for the job
| Indicator | Primary Purpose | Best for |
| RSI | Gauging price strength & speed | Identifying overbought/oversold levels and divergences. |
| MACD | Revealing momentum via two moving averages | Confirming momentum & highlighting crossover signals. |
| ADX | Isolating strength, not direction | Avoiding range-bound markets; confirming powerful moves. |
| CCI | Finding price extremes vs. its average | Spotting cyclical patterns & extreme price levels. |
| Stochastic | Compares closing price to its recent range | Pinpointing short-term extremes, best in ranges. |
| TRIX | Filtering market noise with a triple-smoothed MA | Signaling major directional shifts with smooth signals. |
6. 3 Professional Trade Setups (Rules-Based)
To be successful, you must move beyond “frameworks” and use strict rules. Here are three tested setups.
Setup 1: Trend Pullback (Conservative)
- Context: Market is in a clear uptrend (Price > 200 EMA).
- Indicators: 200-period EMA + RSI (14).
- Entry Rule: Wait for the price to pull back toward the 200 EMA. Enter Long when RSI dips below 30 (Oversold) and then crosses back above 30.
- Stop Loss (SL): 5-10 pips below the recent swing low.
- Take Profit (TP): 2:1 Reward-to-Risk ratio or the previous major resistance level.
Setup 2: Trend Continuation (Aggressive)
- Context: Identifying a fresh trend break.
- Indicators: MACD (12, 26, 9) + Market Structure.
- Entry Rule: Look for a break of a local resistance/support level. Enter when the MACD Line crosses the Zero Line in the direction of the break.
- Stop Loss (SL): Above/Below the “Breakout Candle” high/low.
- Take Profit (TP): Exit when the MACD Histogram begins to shrink toward the zero line for three consecutive candles.
Setup 3: Range Reversal (Counter-Trend)
- Context: Market is bouncing between clear horizontal Support and Resistance (S/R).
- Indicators: Stochastic (14, 3, 3).
- Entry Rule: Price touches major Resistance + Stochastic is above 80. Enter Short when the %K line crosses below the %D line.
- Stop Loss (SL): 15 pips above the Resistance level.
- Take Profit (TP): At the opposite Support level.
7. How to use momentum indicators in forex trading
Knowing what these indicators are is one thing; using them effectively to make trading decisions is an entirely different skill. They are not crystal balls, but when you learn to read their signals correctly, they can dramatically improve your timing and analysis.
Let’s break down the three most important signals you can get from these tools: overbought/oversold levels, crossovers, and divergences.
7.1. Reading overbought and oversold conditions
Reading overbought conditions (or oversold ones) is the primary way traders utilize oscillating indicators like the RSI and Stochastic. Think of these states like a rubber band being stretched; at some point, it’s likely to snap back.
The signal isn’t when the indicator enters an extreme zone (e.g., above 70 on the RSI). That simply tells you the trend is very strong. The real entry or exit signal often occurs when the indicator exits the extreme zone, suggesting that momentum is returning to a more normal level.
7.2. Trading crossover signals
Crossovers are the primary signals for trend-following tools. These signals are straightforward, easy to spot, and offer clear potential action points.
There are two main types you’ll watch for.
- A crossover of the two moving averages can be an early hint of a change in momentum.
- A zero line crossover is often a more powerful, longer-term signal confirming that the overall momentum has shifted from bullish to bearish, or vice versa.
7.3. The power of divergence trading
This is a powerful signal that appears when an indicator fails to confirm the price action. There are two primary forms:
- Bearish divergence: Prices forge a higher high, yet the momentum reading creates a lower high.
- Bullish divergence: Prices form a lower low, but the oscillator prints a higher low.
In both scenarios, this disagreement is a significant clue that the underlying momentum is weakening and the current trend is losing steam, potentially signaling an upcoming reversal.
Piprider’s experience with momentum
After years of staring at these charts, if there’s one lesson we could share about these tools, it’s this: they are like looking in the rearview mirror. They tell you about the force of the very recent past, not what’s guaranteed to happen next.
Our most profitable trades have never come from blindly following an indicator. They have always come when the indicator’s signal simply confirms what we are already seeing in the price action itself, like a bounce off a key support level or a clear trendline break. Treat them as a trusted consultant, not as the one making the final decision.
8. Strategies for using momentum indicators in forex trading
A single indicator is just a tool, not a strategy. A real strategy is a complete system with rules that tells you not just when to get in, but how to confirm your ideas and manage your risk. Let’s build that framework.
8.1. Multiple timeframe analysis: Getting the big picture
Trading on one timeframe is like using a street map without seeing the highway. The framework to fix this is a simple two-step process:
- Identify the main trend: Start on a higher perspective (Daily, H4) to determine the market’s primary direction.
- Pinpoint your entry: Drop down to a lower view (H1, M15) to time your entry with a momentum signal that aligns with that larger direction.
A perfect example: if the daily chart is bullish, you’d patiently wait for an oversold signal on the H1 chart to buy into a pullback. This ensures you’re buying dips in an uptrend, not trying to fight the dominant market flow.
8.2. Combining indicators for confirmation
This is the core of a robust system. You should never, ever rely on a single indicator’s signal. Instead, you wait for multiple, non-correlated indicators to give you the same message. This is called confluence.
Here are some powerful combinations we’ve used:
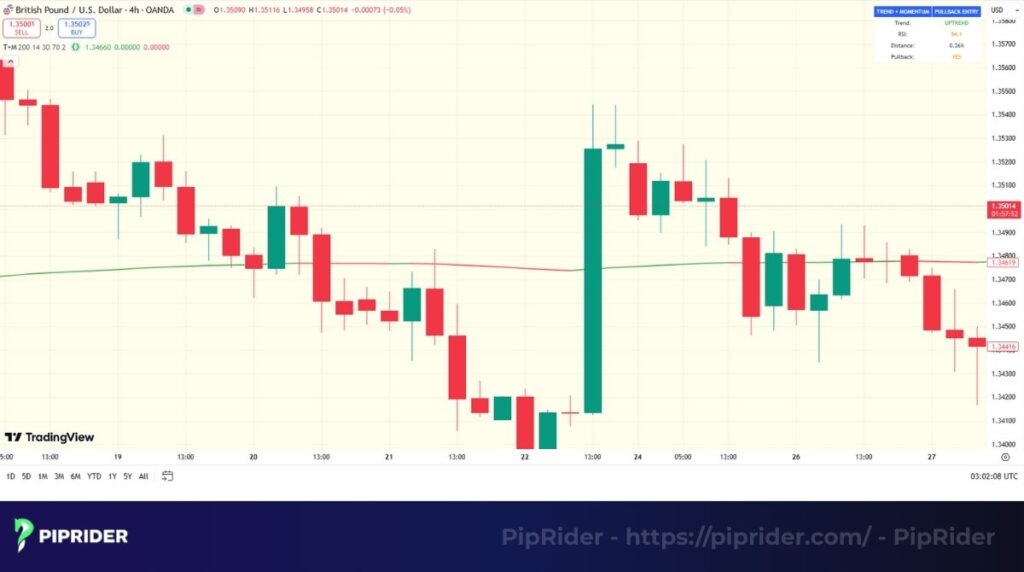
Trend + Momentum: Use a long-term moving average (like the 200 EMA) to define the trend. Then, use an oscillator like the RSI to time your entry with a pullback. The chart below will show you clearly about this combination.
Momentum + Volatility: Use an indicator like the Stochastic to find an overbought signal, but only enter the trade after a volatility indicator like Bollinger Bands confirms the price is at an extreme. Looking at the chart to understand the combination.
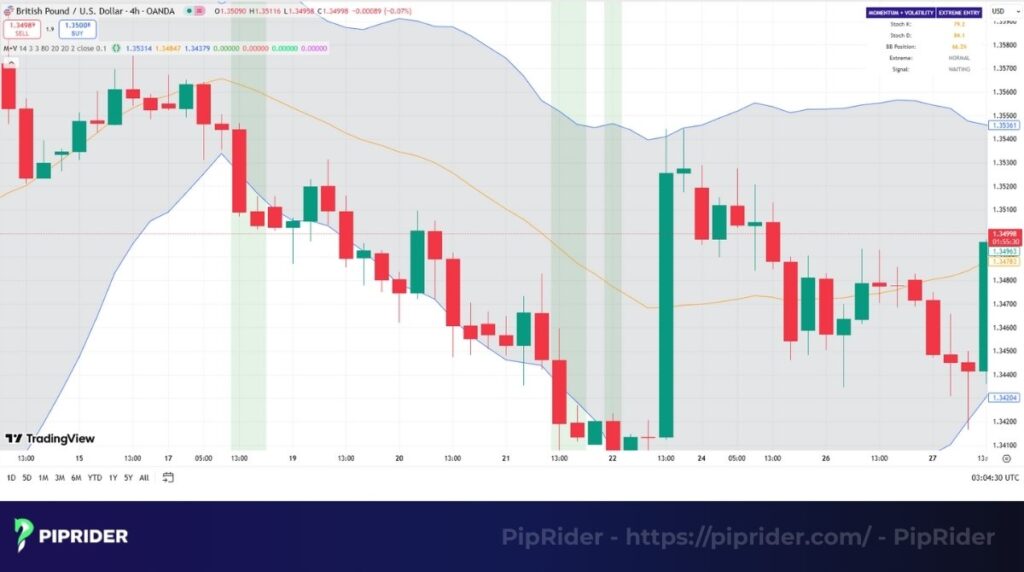
The goal is to have a checklist. You only take a trade if two or three different types of analysis all point to the same conclusion.
8.3. Essential risk management tips
No strategy in the world will save you if you have poor risk management. This is the part of trading that isn’t exciting, but it’s the only thing that will keep you in the game long-term.
- Always use a stop loss. This is non-negotiable. Before you even enter a trade, you must know the exact point at which your idea is proven wrong.
- The 1% rule. We cannot recommend this enough for new traders: never put more than 1% of your entire trading account at risk on any one trade. This means that even if you have a string of losses, you will live to trade another day.
- Know your exit plan. A complete strategy defines your exit points before you even enter. Have a clear idea of where you will take profit, whether it’s at a key resistance level or when your chosen indicator gives an opposing signal.
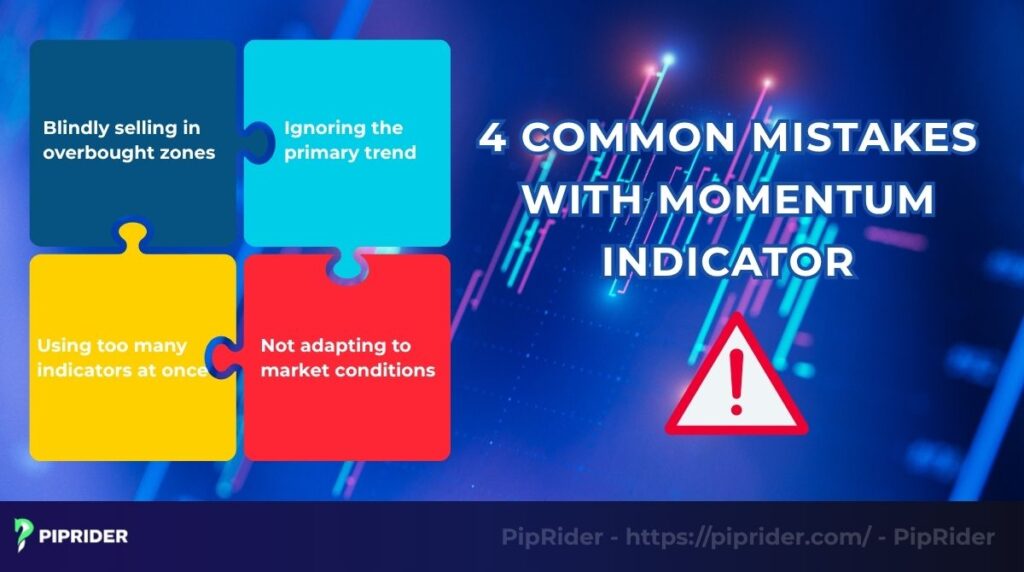
9. Common mistakes and how to avoid them
Learning what an indicator does is easy. Learning how not to use it is where the real education begins. From our own early mistakes and from mentoring other traders, we’ve found that nearly everyone falls into the same few traps.
Let’s walk through them so you can avoid the costly learning curve.
9.1. Blindly selling in overbought zones
The most common mistake is selling just because an indicator is “overbought.” In a strong trend, an indicator can remain in an extreme zone for a long time. Wait for the indicator to exit the zone and for a change in price behavior before considering a trade.
9.2. Ignoring the primary trend
A low-probability gamble is trading against the main market direction. The force of a higher timeframe’s trend will almost always overwhelm a conflicting, shorter-term signal. Always start your analysis on a higher timeframe (Daily or H4) and only take trades that align with that direction.
9.3. Using too many indicators at once
This leads to “analysis paralysis.” A cluttered chart with conflicting signals causes confusion and an inability to make a decision. Keep it simple with one indicator for trend, one for momentum, and maybe one for volatility for a cleaner, more effective approach.
9.4. Not adapting to market conditions
No single indicator works in all market conditions. Oscillators (like Stochastic) are best for ranging markets, while trend-followers (like MACD) excel in strong trends. Before you trade, determine if the market is trending or ranging and choose the right tool for the job.
10. Frequently Asked Questions (FAQ)
Here are some quick, straight-to-the-point answers to the questions I hear most often about these tools.
11. Conclusion
Mastering the flow of the market isn’t just about spotting a direction; it’s about understanding the force behind that direction. That is the fundamental power that the tools we’ve discussed today give you. They provide an essential look “under the hood” of what’s happening on the chart, helping you gauge a trend’s health and spot potential turning points before they happen.
But if there is one lesson we hope you take away from this guide, it is this: no single indicator is a complete system. They shine brightest when used to confirm what you are already seeing, not as blind entry signals on their own.
To continue developing your skills, we encourage you to follow us at Piprider and dive into our best technical indicators category. There, you’ll find more advanced strategies and learn new ways to combine tools to get the most out of your momentum indicator.


