
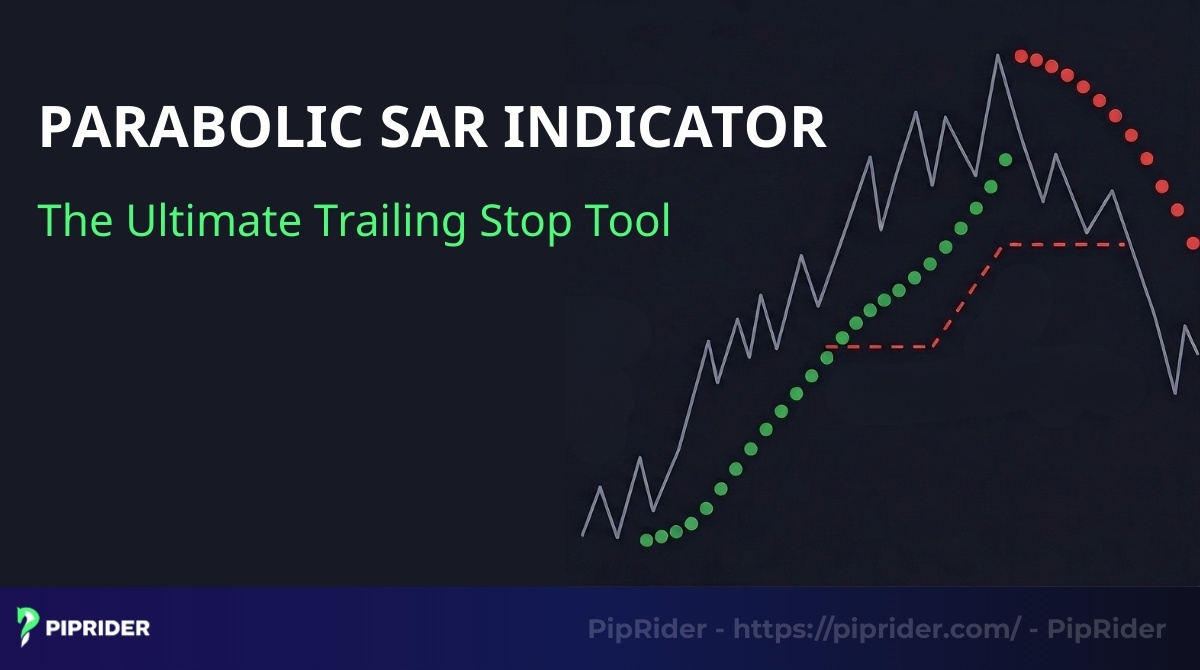
The Parabolic SAR (Stop and Reverse) is a trend-following indicator designed to solve a specific trading problem: Managing exits. Unlike static support levels, it acts as a dynamic trailing stop-loss that moves with the price, helping traders lock in profits as a trend accelerates. This guide breaks down exactly how to read its signals and use it to capture sustained market moves.
Key Takeaways
- Trend Hunter: The Parabolic SAR (Stop and Reverse) is a trend-following indicator used to identify market direction and potential reversals.
- Profit Locker: Its primary strength is the Dynamic Trailing Stop, which accelerates toward the price to lock in profits as trends mature.
- Visual Simplicity: Dots BELOW price = Uptrend (Buy); Dots ABOVE price = Downtrend (Sell).
- Critical Warning: The indicator fails in ranging markets, causing frequent losses known as “whipsaws.” Never use it in isolation; always confirm the trend with the ADX (above 25) or a 200 EMA.
1. What is the parabolic SAR indicator?
The Parabolic SAR is a technical analysis tool used to determine the direction of price momentum and pinpoint potential reversal points.
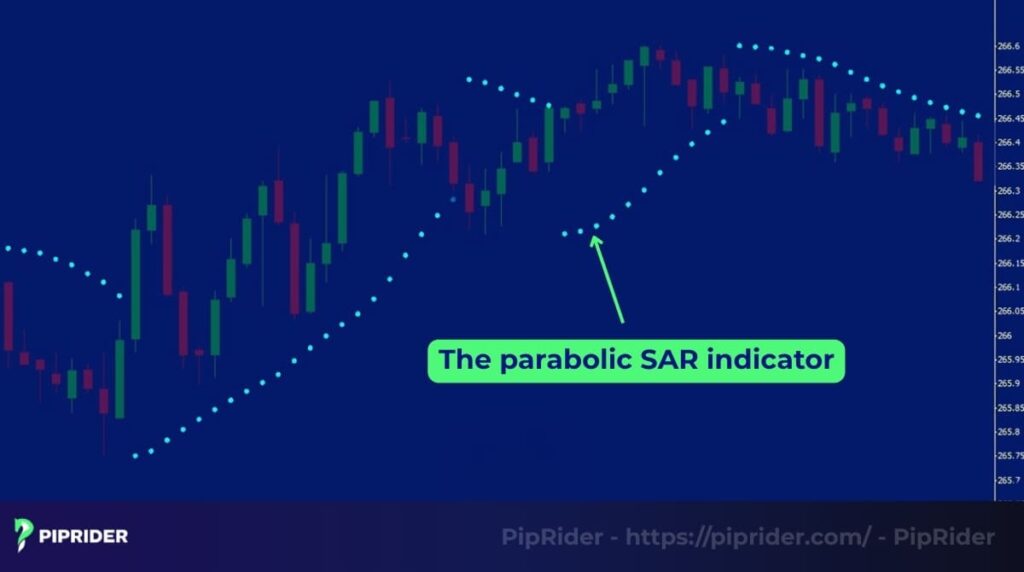
Developed by J. Welles Wilder Jr. in his seminal book New Concepts in Technical Trading Systems (Wilder, 1978), the indicator appears as a series of dots (markers) plotted above or below the price candles. Its name, “Stop and Reverse”, describes its dual function: keeping you in the trade during the trend and signaling a reversal when momentum fails.
How to read the dots:
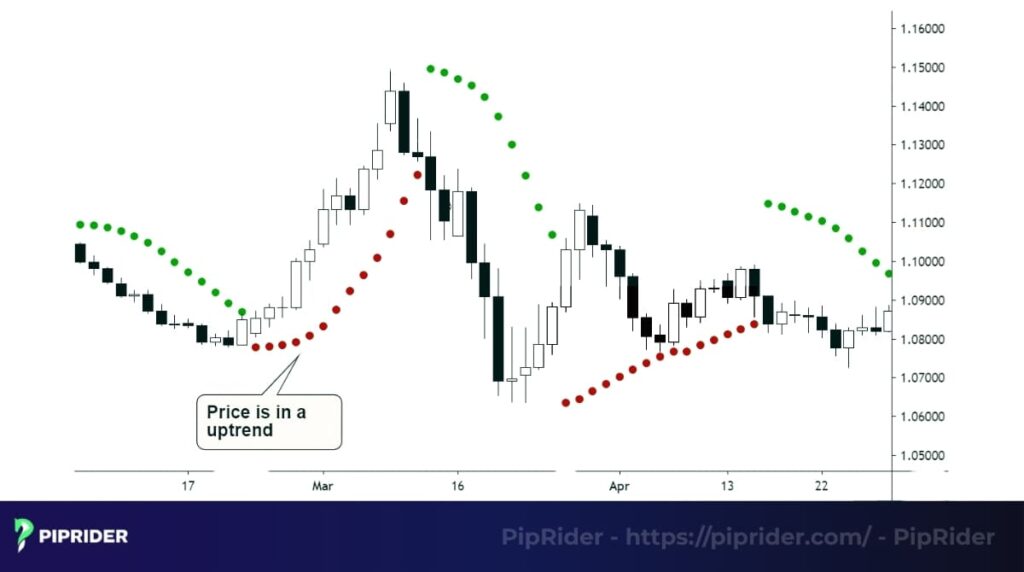
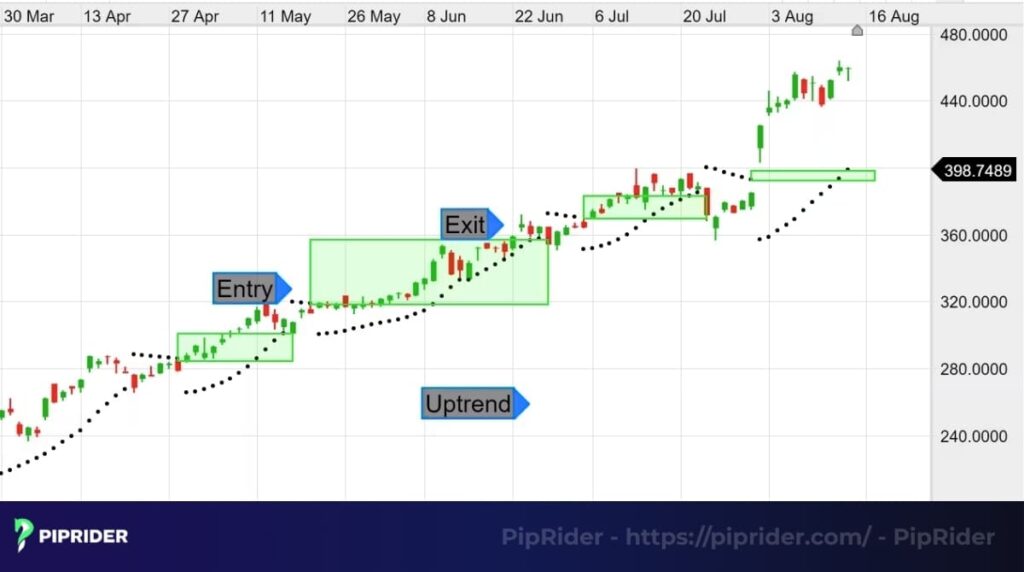
- Uptrend (Bullish): Dots are plotted BELOW the price candles. This serves as a rising floor of support.
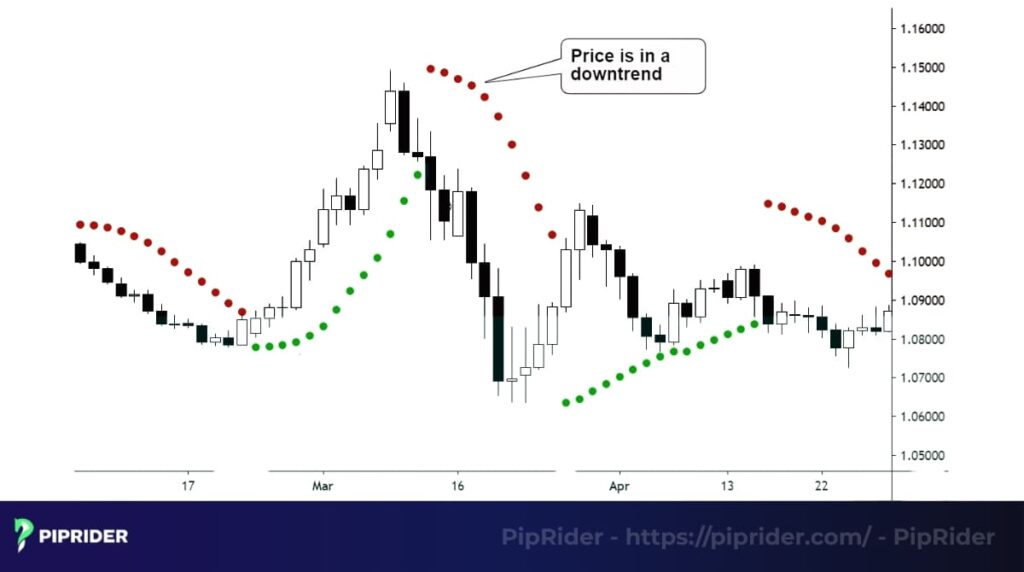
- Downtrend (Bearish): Dots are plotted ABOVE the price candles. This acts as a falling ceiling of resistance.
Functionally, the Parabolic SAR excels in trending markets by visually highlighting the prevailing direction and providing a clear, objective level for placing your stop-loss orders.
2. How does the parabolic SAR indicator work?
The Parabolic SAR functions by calculating a specific “stop” level for every price bar. As a trend develops, this stop level accelerates toward the price, creating a curved, parabolic shape.
Its primary mechanism is binary: the market is either trending Up or Down. There is no neutral state in the Parabolic SAR calculation.
2.1. The core mechanism: Markers Above vs. Below
The Parabolic SAR operates on a binary logic to identify trend direction. By positioning markers relative to the price, the indicator serves as dynamic support or resistance levels:
Bullish Mode (Uptrend): Markers appear BELOW the price. As the price makes higher highs, the markers step upward, acting as a rising floor of support.
Bearish Mode (Downtrend): Markers appear ABOVE the price. As the price makes lower lows, the markers step downward, acting as a falling ceiling of resistance.
2.2. The “Flip” and Signal Validation
The “Stop and Reverse” (SAR) event occurs when price action touches or crosses an existing marker. The indicator immediately “flips” to the opposite side, signaling a potential trend change.
However, trading every flip blindly is a common mistake. To filter out market noise and false signals, professional traders apply the “Touch vs. Close” rule:
1. For Exits (Protective Stop): React on TOUCH
- The Rule: If you are currently in a trade and the price touches the SAR dot, your stop-loss is triggered.
- Action: Exit immediately to protect capital. Do not wait for the candle to close, as a sharp spike could erode your profits further.
2. For Entries (New Trade): Wait for CANDLE CLOSE
- The Trap: During volatile sessions, price may spike to hit a dot (triggering a visual flip) but then retreat, leaving a long wick. This is a false reversal signal.
- The Fix: Never enter a new position mid-candle. Wait for the candle to close decisively on the opposite side of the SAR dot. This confirms that the reversal momentum is valid.
💡 PipRider’s Pro Tip: Avoid the “Choppy” Trap
Do not use Parabolic SAR in a ranging market. In sideways or “choppy” conditions, the price will constantly intersect with the dots, causing the indicator to flip back and forth rapidly (whipsawing). This generates multiple false signals and consecutive losses.
Key Takeaway: Only enable this indicator when a clear trend is present, or combine it with the ADX indicator to gauge trend strength before entering.
3. How is the parabolic SAR calculated?
While trading platforms automate this process, understanding the formula reveals the indicator’s unique psychological edge: it forces the stop-loss to catch up.
The calculation relies on an iterative logic, meaning today’s value is derived directly from yesterday’s data. The formula changes depending on whether the market is in an uptrend or downtrend:
The Parabolic Formulas (Strike Money, n.d.):
1. Uptrend (Rising SAR):
New SAR = Prior SAR + [AF × (EP − Prior SAR)]
2. Downtrend (Falling SAR):
New SAR = Prior SAR − [AF × (Prior SAR − EP)]
Deconstructing the Variables:
- EP (Extreme Point): The highest high (uptrend) or lowest low (downtrend) of the current trend.
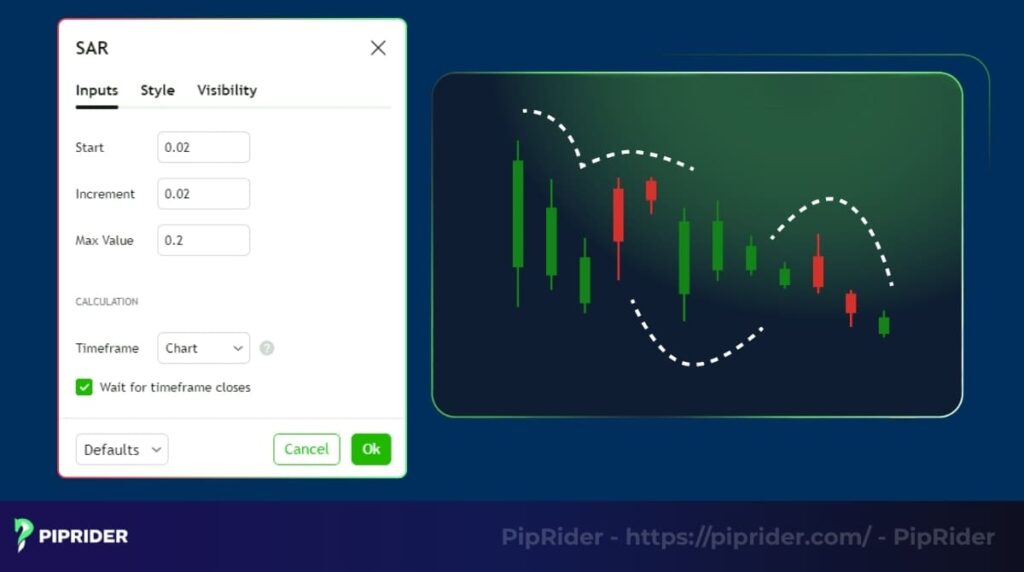
- AF (Acceleration Factor): The “speed pedal.” It starts at 0.02 and increases by 0.02 every time a new EP is reached.
The “Parabolic” Effect Explained: At the beginning of a trend, the gap between price and dots is wide, giving the trade room to “breathe” and withstand initial volatility. As the trend matures and hits new highs (updating the EP), the AF increases. This causes the dots to accelerate faster than the price, effectively tightening the stop-loss to lock in profits before the inevitable reversal.
When a reversal occurs, the indicator flips, and the calculation switches to the downtrend formula.
4. Best Parabolic SAR settings and parameters
Before tweaking the numbers, you need to add the tool to your chart. Here is the quick path for the two most popular platforms:
For MetaTrader 4 / 5 (MT4/MT5):
- Go to the top menu: Insert > Indicators.
- Hover over Trend and select Parabolic SAR.
- A settings box will pop up (Default: Step 0.02, Max 0.2). Click OK.
For TradingView:
- Select the one listed under “Technicals” (this is the standard built-in version) to add it to your chart.
- Click the “Indicators” tab on the top toolbar.
- Type “Parabolic SAR” in the search bar.
4.1. Terminology Mapping & Default Values
Trading platforms often use different names for the same variables. Use this table to standardize your configuration:
| Standard Term | Alt. Names | Default | Function |
|---|---|---|---|
| Step | Increment, Start, AF | 0.02 | Sensitivity: Controls acceleration speed. |
| Maximum | Max AF, Ceiling | 0.20 | Speed Limit: Caps the maximum acceleration. |
Why is 0.02 / 0.20 the Industry Standard? You might wonder why every platform defaults to these specific numbers. J. Welles Wilder designed this “Golden Ratio” specifically for Daily timeframes.
- The Balance: The 0.02 Step is slow enough to ignore minor daily fluctuations (wicks) but fast enough to react when the trend structure actually breaks.
- The Goal: Mathematically, this setup is designed to capture approximately 70-80% of a trend’s profit. It willingly sacrifices the first 10% (confirming the start) and the last 10% (confirming the end) to ensure safety.
4.2. Optimization by Trading Goal (Scalping vs. Swing)
There is no single “best” setting. The optimal value depends on whether you need the indicator to react quickly (Scalping) or ignore minor noise (Swing).
1. For Scalping (High Sensitivity)
- Recommended Settings: Step: 0.03 or 0.04 | Max: 0.20
- Why: On low timeframes (M5, M15), trends are short and explosive. Increasing the Step makes the dots “hug” the price tighter.
- Trade-off: You capture quick moves and exit fast, but the risk of premature stop-outs increases significantly due to market noise.
2. For Swing Trading (Low Sensitivity)
- Recommended Settings: Step: 0.01 | Max: 0.20
- Why: For Daily or Weekly trends, deep retracements are common. Decreasing the Step widens the gap between price and the stop-loss.
- Trade-off: You stay in the trend longer without being shaken out, but you will give back more open profit when the trend finally reverses.
4.3. The “Maximum” Warning (Wilder’s Rule)
While adjusting the Step is encouraged, adjusting the Maximum requires caution.
In New Concepts in Technical Trading Systems, J. Welles Wilder Jr. (1978) explicitly advised against setting the Maximum value higher than 0.20.
- The Risk: If the Max is set too high (e.g., 0.30 or 0.40), the stop-loss point catches up to the price too rapidly during a strong trend. This often forces traders out of a profitable position right before the trend resumes its primary direction.
5. Parabolic SAR trading strategies
Using the Parabolic SAR in isolation is inherently risky, as the indicator mathematically cannot distinguish between a trending market and a consolidating one. Consequently, relying solely on “flips” often leads to false signals in choppy conditions.
To mitigate this limitation, professional strategies employ a systematic approach: combining the Parabolic SAR with secondary indicators (such as Moving Averages or ADX) to filter noise. The following strategies are designed to ensure trades are executed only when momentum and trend direction align.
5.1. Strategy 1: The “Filtered” Reversal Strategy
Best for: Catching the start of a new trend leg. Risk Level: Moderate.
The biggest mistake beginners make is trading every single “flip.” In a sideways market, this leads to rapid losses. To fix this, we apply a strict 4-Step Checklist to ensure we only enter when momentum is truly present.
5.1.1. The Trading Checklist:
1. Market Condition (The Filter): Before looking at the dots, check the market energy. Do not trade if the market is flat.
- Rule: The ADX Indicator (period 14) must be above 25. This confirms that a strong trend is present.
- Alternative: If you don’t use ADX, ensure the price candles are moving aggressively away from a moving average, not hugging it.
2. The Signal (The Flip) Wait for the Parabolic SAR dot to flip to the opposite side of the price.
- Critical Rule: Do NOT enter when the price merely touches the dot. You must wait for the candle to CLOSE. A wick touching the dot is not a valid signal.
3. The Confirmation (Candlestick Pattern): The “flip” candle must show conviction. Look for one of these reversal patterns:
- Engulfing Pattern: A large candle that fully consumes the previous one (Bullish for Buy, Bearish for Sell).
- Pin Bar: A candle with a long tail rejecting the previous trend (Hammer for Buy, Shooting Star for Sell).
- Why? These patterns prove that smart money is actually stepping in to reverse the price, validating the indicator’s signal.
4. The Execution (Entry & Stop)
- Entry: Open the trade at the start of the next candle following the confirmation.
- Stop Loss (SL): Place your initial SL at the PSAR dot itself.
- Option for Volatile Markets: If the dot is too close, place the SL at the recent Swing Low (for buys) or Swing High (for sells) to give the trade more room to breathe.
5.1.2. Exit Strategy: The Trailing Stop
Once in the trade, let the Parabolic SAR manage your greed and fear.
- Pro Tip: Consider adding a small “buffer” (e.g., 5-10 pips or 1x ATR) behind the dot rather than using the exact dot value. This prevents you from being shaken out by random market noise.
- Rule: Trail your Stop Loss behind each new dot as it appears.
- Warning: In highly volatile pairs (like GBP/JPY or Gold), a sharp pullback can hit the dot and immediately resume the trend.
5.2. Strategy 2: The Trend-Following Strategy (EMA 200)
Best for: Catching sustained moves and filtering out noise. Risk Level: Low to Moderate.
This strategy improves win rates by aligning trades with the long-term trend. We use the 200-period Exponential Moving Average (EMA) as the “Master Filter.” We only trade when the Parabolic SAR agrees with the 200 EMA.
5.2.1. The Trading Checklist:
1. Market Condition (The Master Filter) Identify the dominant trend using the 200 EMA.
- Bullish Zone: Price is trading ABOVE the 200 EMA. You are looking for BUY signals only. Ignore all Sell signals.
- Bearish Zone: Price is trading BELOW the 200 EMA. You are looking for SELL signals only. Ignore all Buy signals.
2. The Setup (The Pullback) Wait for the price to correct against the trend.
- In an Uptrend: Wait for the SAR dots to move ABOVE the price (indicating a temporary pullback/correction).
- In a Downtrend: Wait for the SAR dots to move BELOW the price (indicating a temporary rally).
- Note: Do not trade at this stage. We are waiting for the correction to end.
3. The Signal (Trend Resumption) Enter when the correction ends and the main trend resumes.
- Buy Trigger: Price is above 200 EMA + SAR dots flip back BELOW the price.
- Sell Trigger: Price is below 200 EMA + SAR dots flip back ABOVE the price.
- Rule: Always wait for the signal candle to CLOSE to confirm the flip.
4. The Execution (Stop & Trailing)
- Initial Stop Loss: Place slightly beyond the recent Swing High/Swing Low or the 200 EMA dynamic line.
- Exit: Use the Parabolic SAR dots to trail your stop. This allows you to ride the massive portion of the trend until momentum officially dies.
5.2.2. Case Study: The 230-Pip EUR/USD Trade
Context: Daily Chart (Late 2020)
Let’s analyze a classic implementation of this strategy on EUR/USD:
- Trend Filter: The price was trading firmly above the 200 EMA, confirming a long-term bullish bias.
- The Signal: After a shallow pullback in mid-November, the Parabolic SAR flipped from above to below the candles on November 25, 2020. This signaled that the correction was over.
- Execution: A Buy position was opened at roughly 1.1920 (at the candle open).
- Trade Management: The position was held through December. Despite minor red days, the price never triggered the rising SAR dots (Trailing Stop).
- The Exit: On January 12, 2021, momentum faded, and the price finally crossed below a SAR dot. The trade was closed at ~1.2150.

Result: By ignoring short-term noise and using the 200 EMA to stay on the right side of the market, this single trade captured a 230-pip movement.
5.3. Strategy 3: The Momentum Strength Strategy (ADX Combination)
Best for: avoiding false signals in sideways markets. Risk Level: Low.
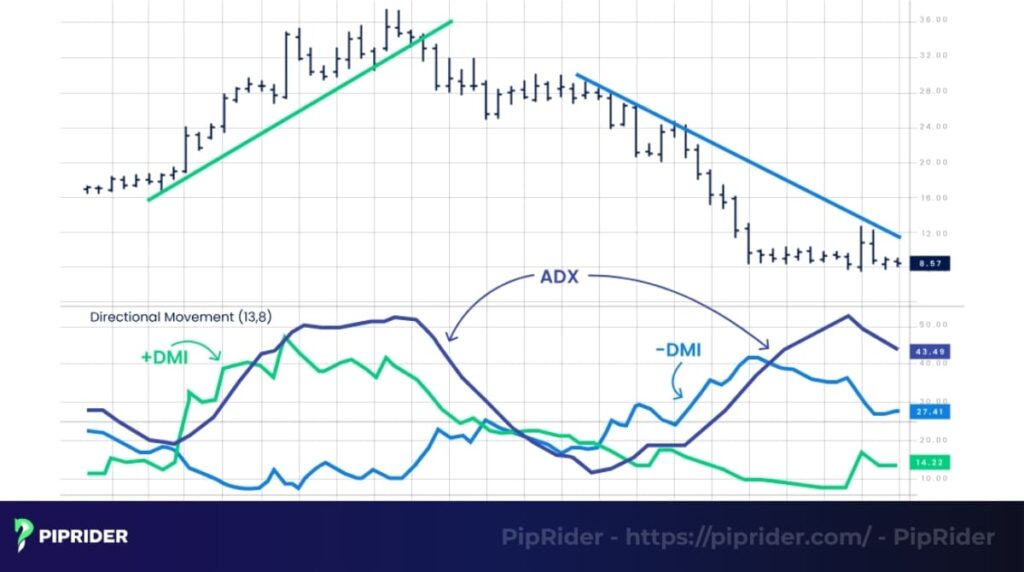
This strategy addresses the Parabolic SAR’s greatest weakness: ranging markets. By adding the Average Directional Index (ADX), we create a “Traffic Light” system that tells us exactly when to trade and when to stay out.
5.3.1. The “Traffic Light” Logic
Before looking at price, look at the ADX line (Period 14).
- 🔴 Red Light (ADX < 25): The market is weak or ranging. DO NOT TRADE. The Parabolic SAR will likely give false signals (whipsaws).
- 🟢 Green Light (ADX > 25): The market is trending strongly. Parabolic SAR signals are high-probability. PROCEED.
5.3.2. The Trading Checklist:
Step 1: Check the ADX Value
- Is the ADX line rising and currently above the 25 level?
- If NO: Stand aside. Capital preservation is the priority.
- If YES: A strong trend is active (the ADX does not tell you direction, only strength). Proceed to Step 2.
Step 2: Identify the Direction (PSAR)
Now look at the Parabolic SAR dots to determine which way the strong trend is moving.
- Uptrend: Dots are BELOW the price candles. Look for Buy setups.
- Downtrend: Dots are ABOVE the price candles. Look for Sell setups.
Step 3: Execution (The Flip)
Wait for the standard signal.
- Entry: Enter on the open of the next candle after a confirmed flip, provided the ADX remains > 25.
- Stop Loss: Place initial stop at the PSAR dot.
- Exit: Trail the stop until the trend exhausts itself or the ADX line starts to slope downward (indicating momentum is fading).
6. Advantages and Disadvantages of Parabolic SAR
No technical indicator is perfect, and this one is no exception. Understanding its pros and cons is essential for using it effectively and knowing when to trust its signals – and, more importantly, when to be skeptical.
The Parabolic SAR is highly valued by traders for its powerful and straightforward benefits:
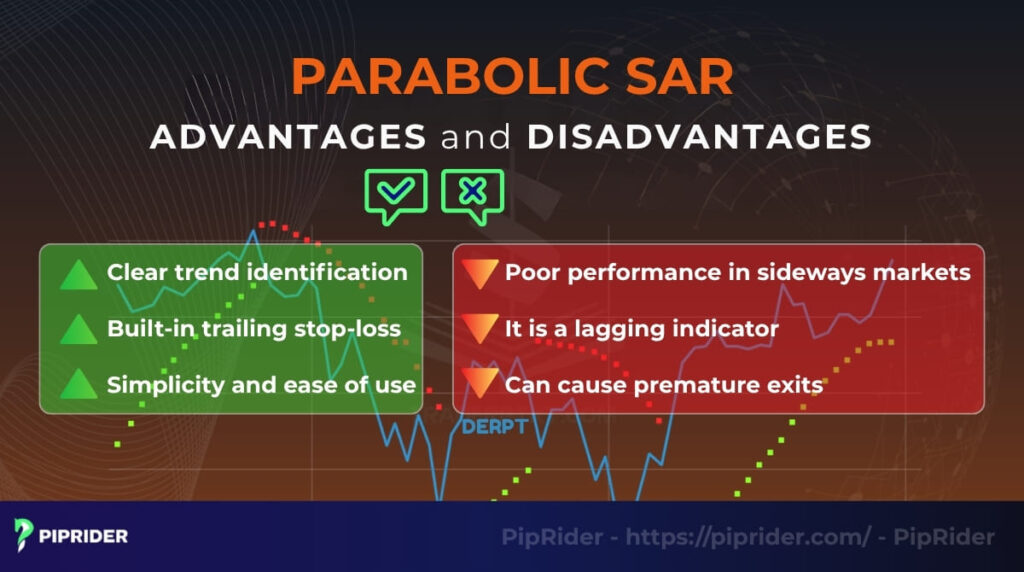
- Clear trend identification: Its visual markers provide an unambiguous, at-a-glance signal of the market’s direction. The “flip” of the markers offers an objective cue that a trend reversal may be happening.
- Built-in trailing stop: This is arguably its most valuable feature. It automatically provides a dynamic stop-loss that trails the price, helping to protect profits and enforce a disciplined exit strategy without guesswork.
- Simplicity and ease of use: Unlike more complex tools, its marker-based system is incredibly intuitive and easy for beginners to understand, reducing analysis paralysis and allowing for quicker decision-making.
However, it’s crucial to be aware of its potential drawbacks to avoid common trading traps:
- Poor performance in sideways markets: This is its main flaw. In non-trending, choppy conditions, it generates frequent incorrect signals (a whipsaw), which can lead to a series of frustrating, small losses.
- Lagging nature: The SAR is reactive; it confirms a trend only after it has already begun. This means you will not enter at the absolute bottom or exit at the absolute top of a price move.
- Risk of premature exits: The accelerating nature of the markers can sometimes cause them to move too close to the price during a sharp but temporary pullback, stopping you out of an otherwise valid trend too early.
How to Overcome These Limitations (The Fix)
Professional traders do not discard the indicator because of its flaws; they fix them using Filters.
| Common Problem | The Professional Solution |
|---|---|
| False Signals (Whipsaws) |
Apply the Trend Filter: Never use PSAR alone. 1. Add the ADX Indicator: Only trade when ADX > 25. 2. Or use the 200 EMA: Only take signals aligned with the long-term trend. |
| Premature Stop-outs |
Apply the “Buffer” Rule: Market noise often hits the dot exactly. The Fix: Place your Stop Loss 5-10 pips (or 1x ATR) behind the dot to give the trade room to breathe. |
7. FAQ about the parabolic SAR indicator
Here are some of the most common questions traders have when they first start using the Parabolic SAR.
8. Summary
The Parabolic SAR is a powerful tool designed for two specific goals: identifying trend direction and managing exits. Its greatest value lies in acting as a dynamic trailing stop, allowing traders to lock in profits systematically without emotional interference.
However, it is not a standalone “magic bullet.” Its effectiveness depends entirely on market conditions. To succeed, you must remember:
- Visual Logic: Dots BELOW = Uptrend; Dots ABOVE = Downtrend.
- Profit Protection: Use the markers to trail your stop-loss. This ensures you stay in the trend as long as possible while protecting your capital.
- The Critical Rule: Never use PSAR in a ranging (sideways) market. Always filter your signals with ADX > 25 or a 200 EMA to avoid expensive “whipsaws.”
Mastering this indicator means knowing when not to use it. Combine it with the right filters, and you will have a disciplined system for catching and riding major market moves.
Infographic Section
-
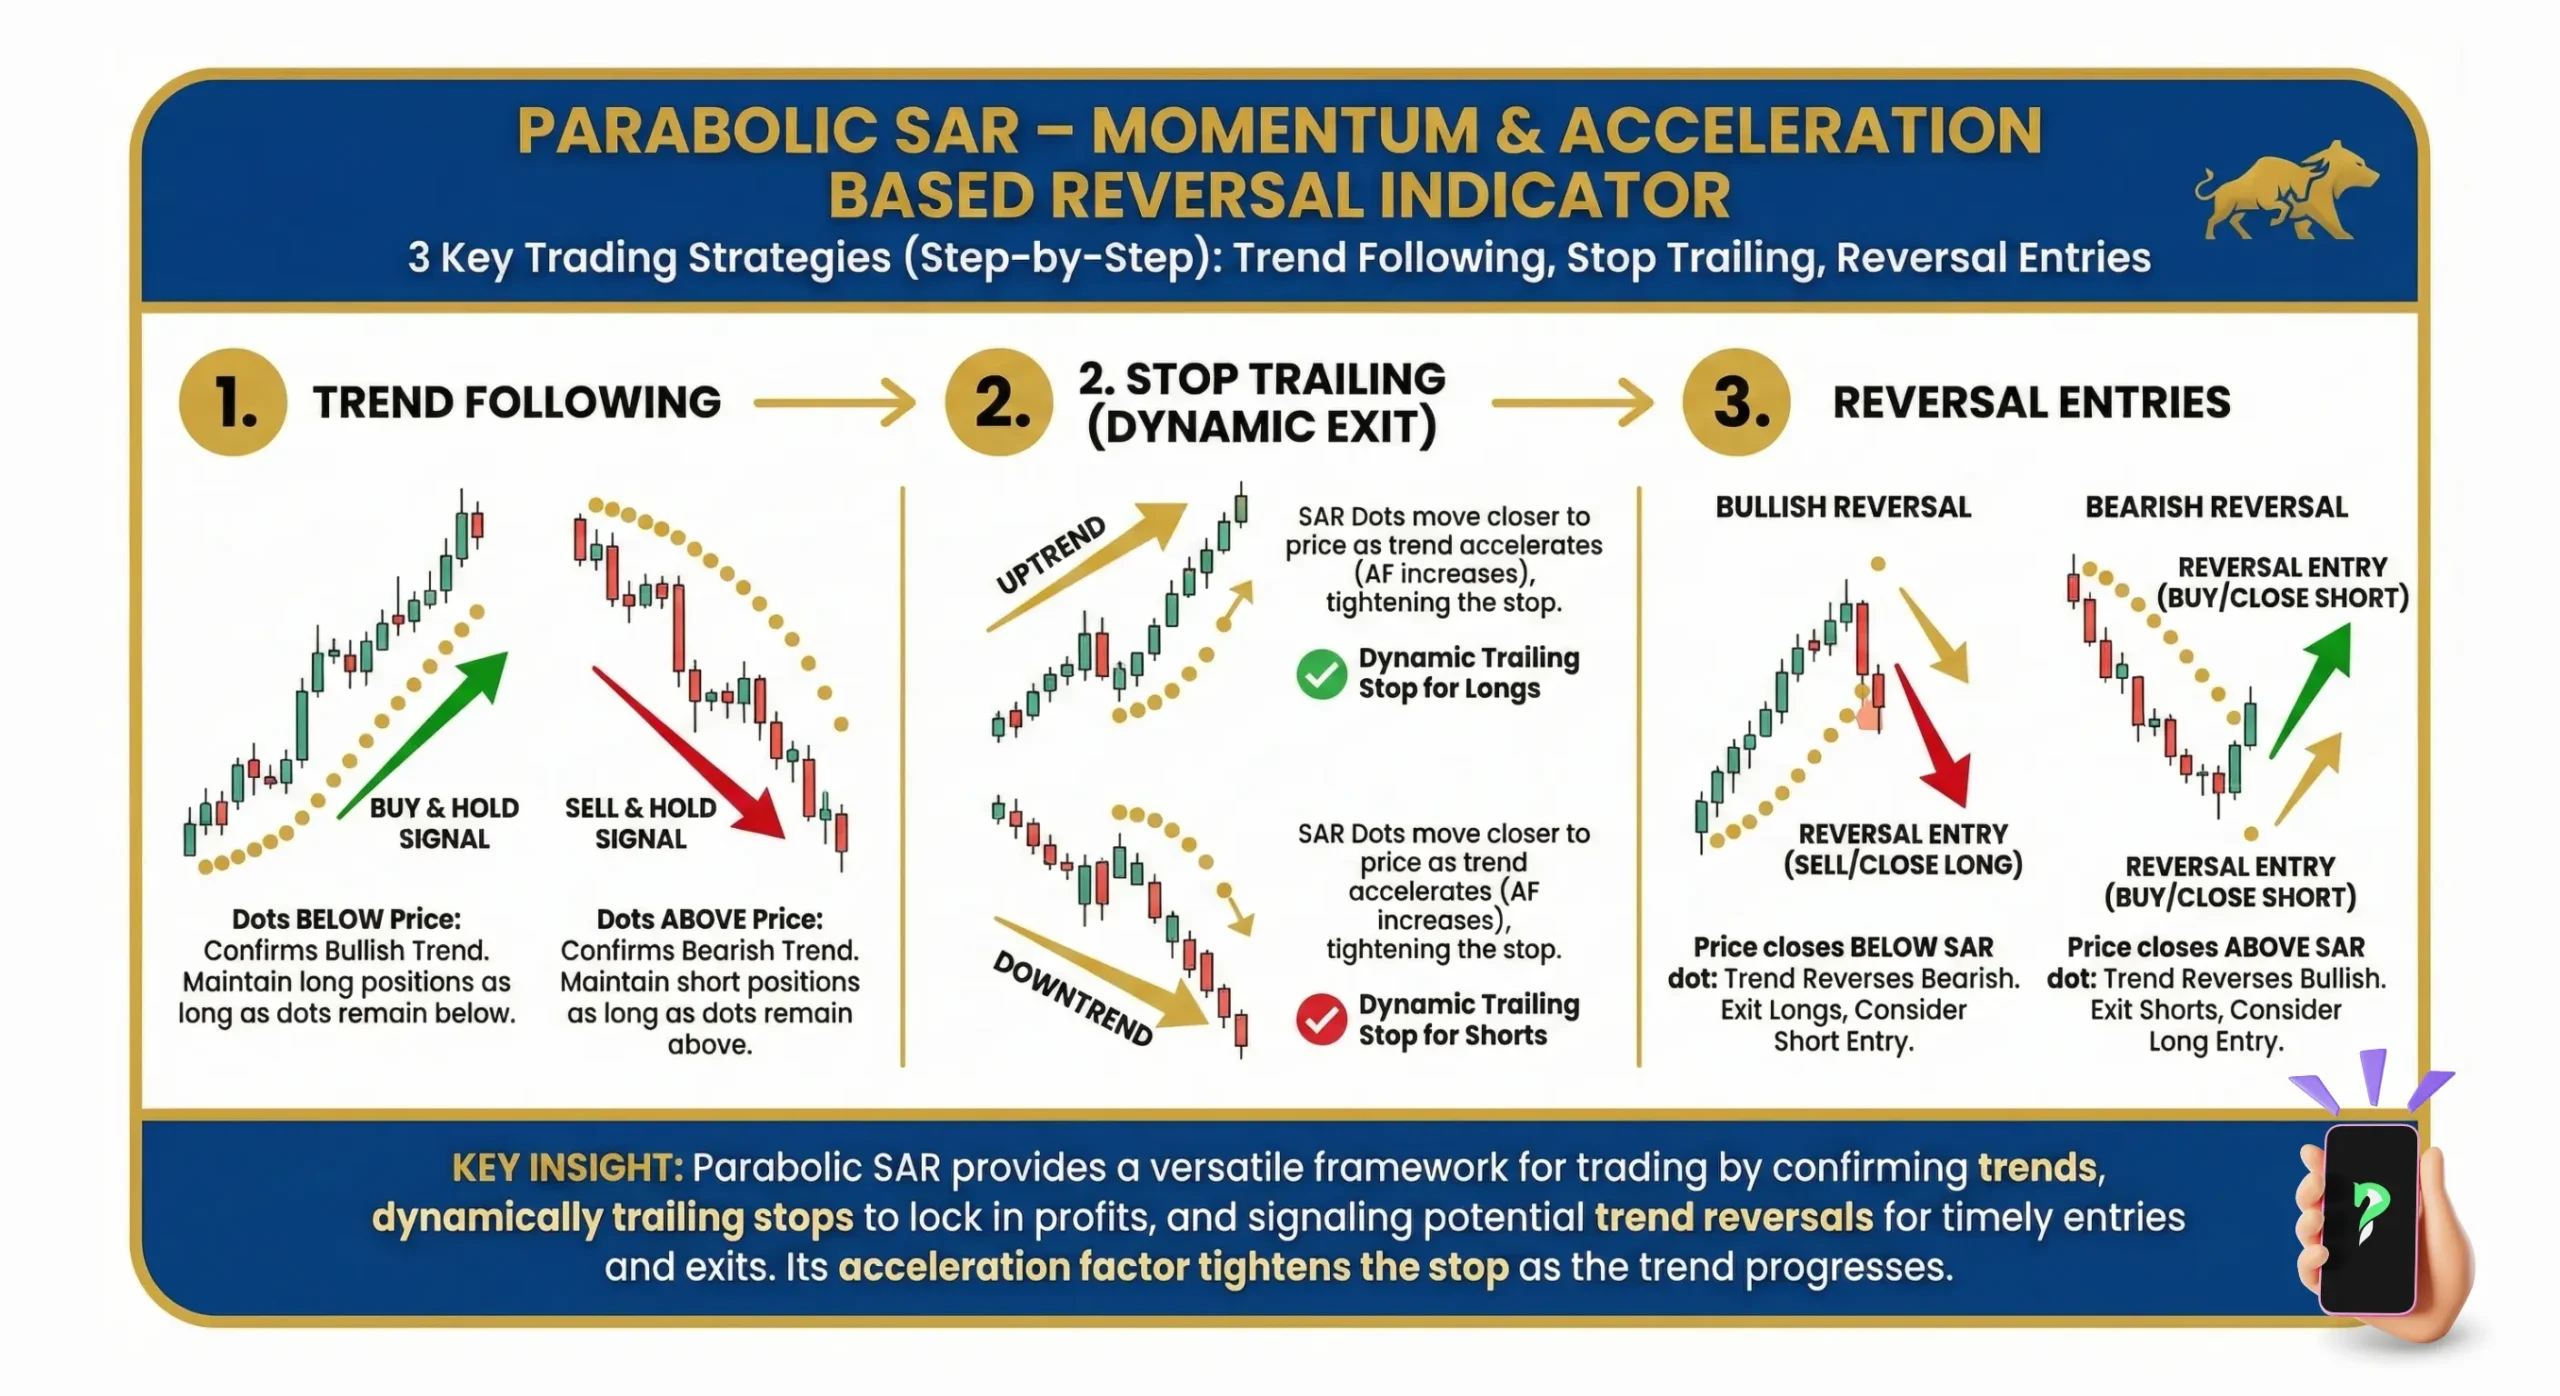
3 key trading strategies -
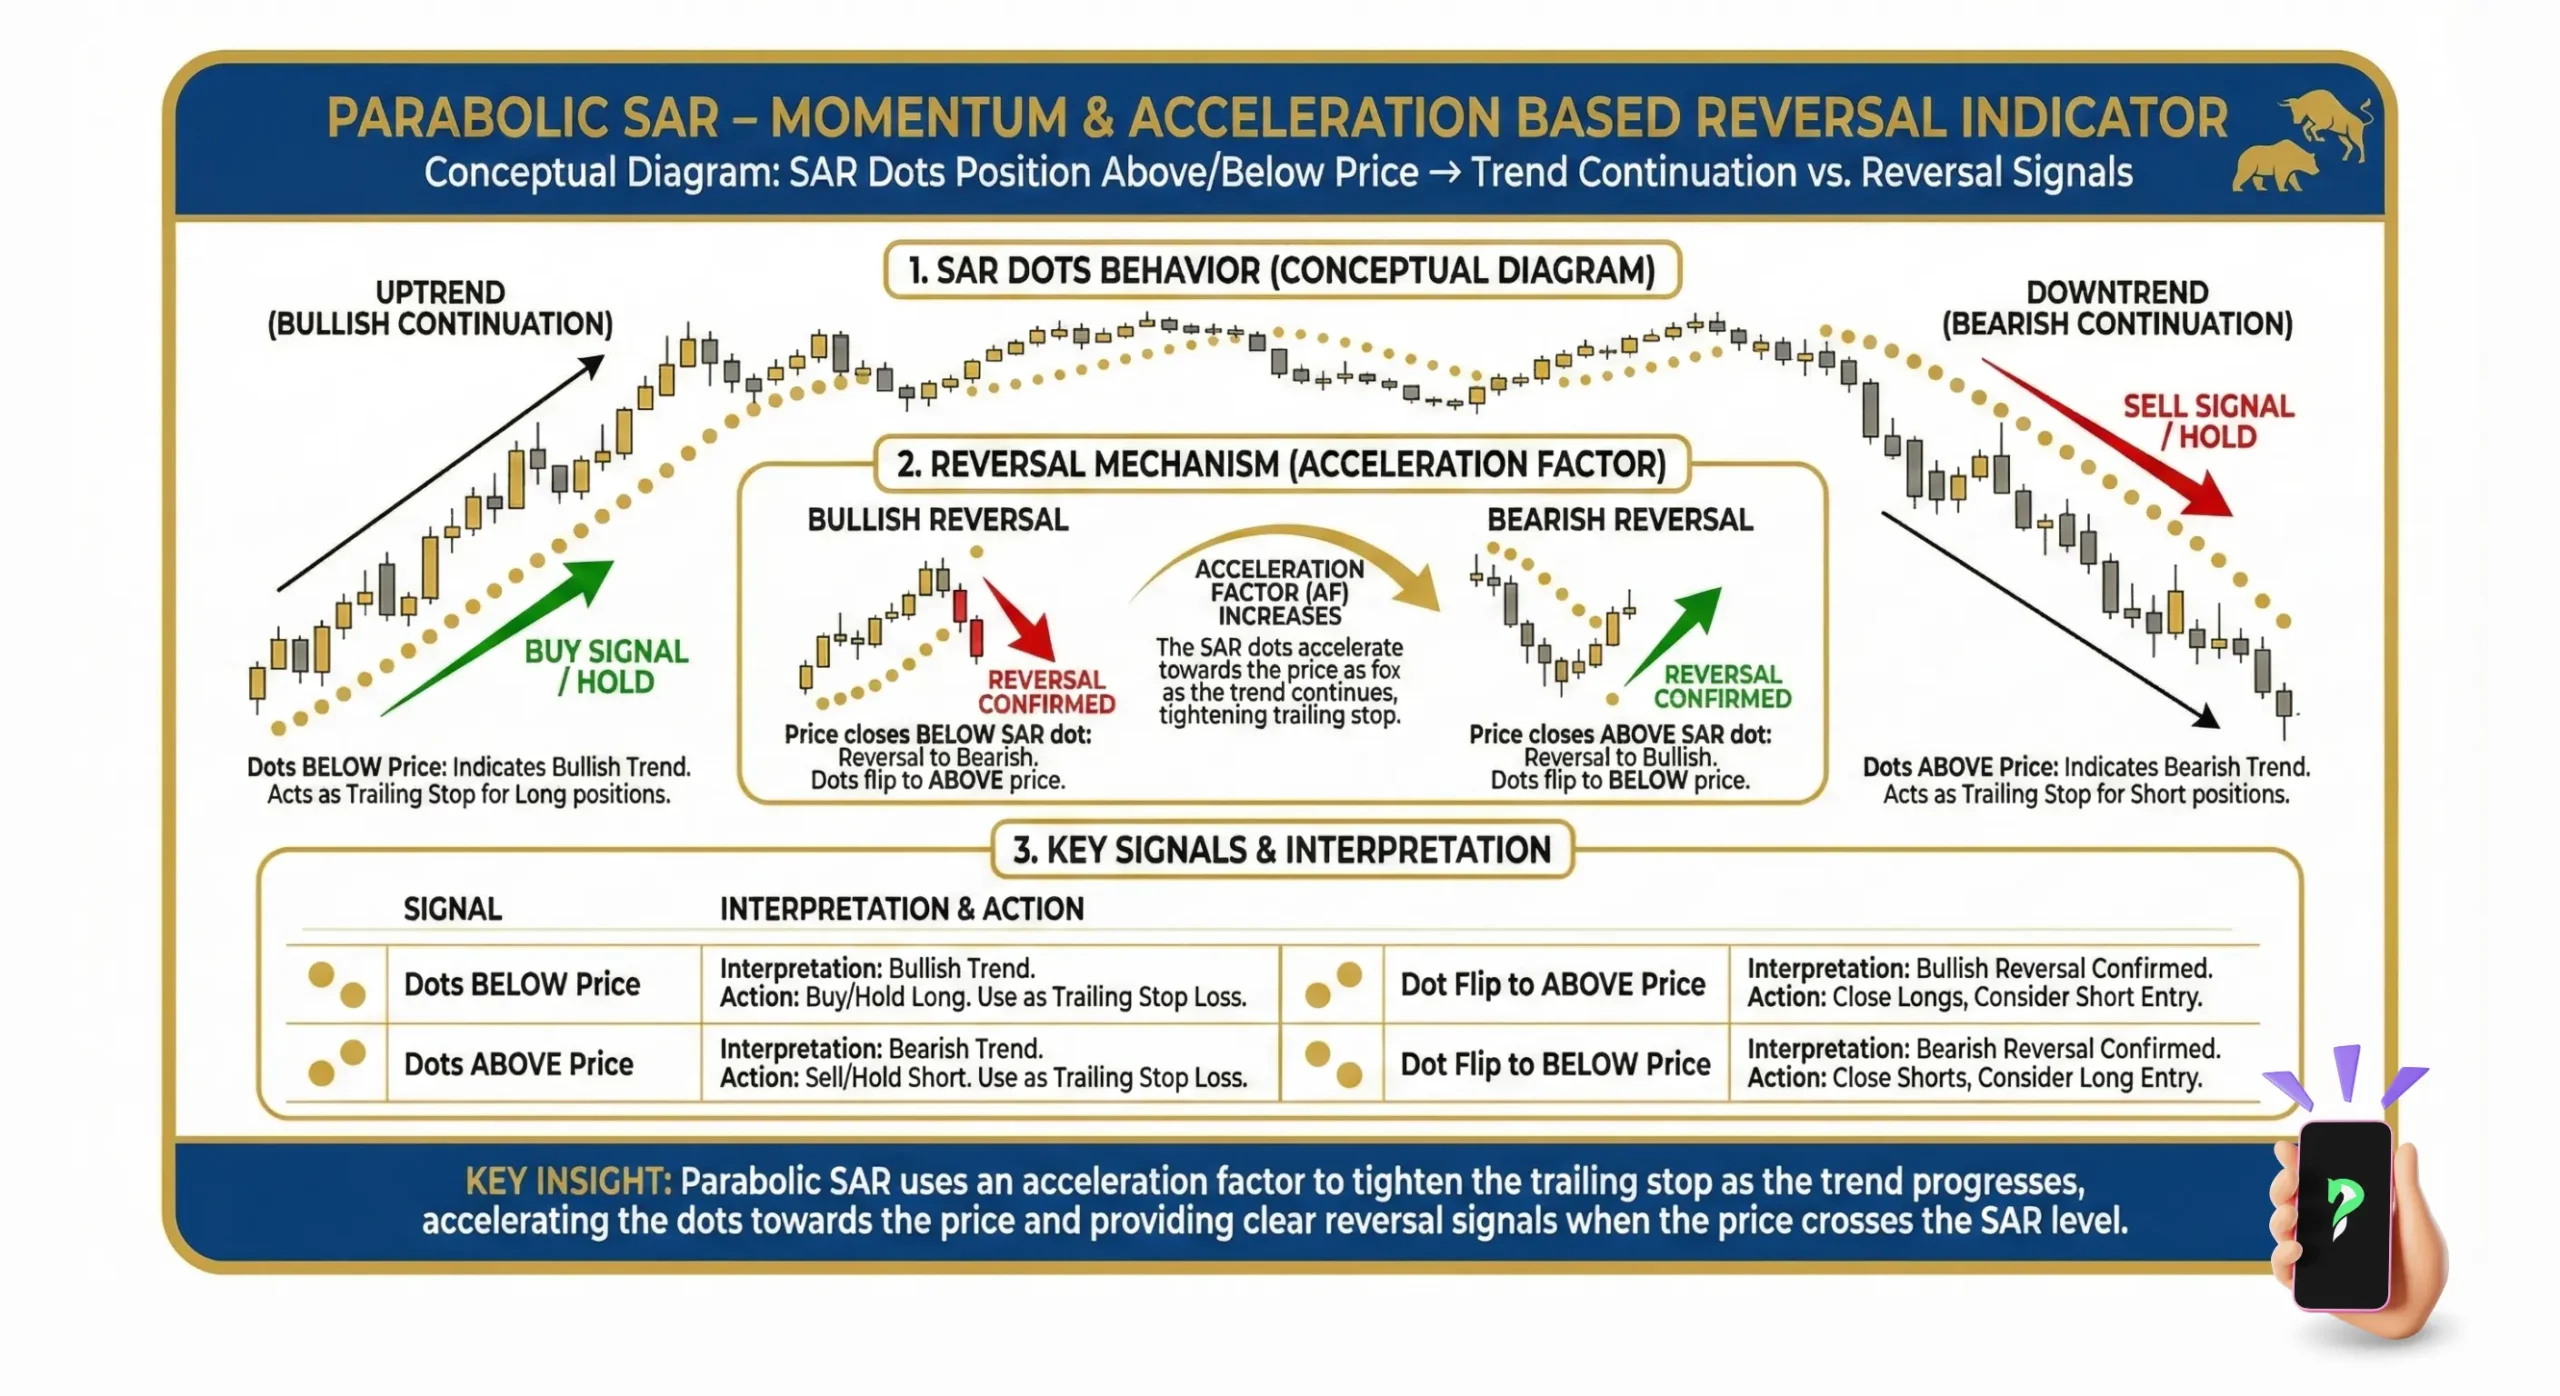
Conceptual-Diagram -
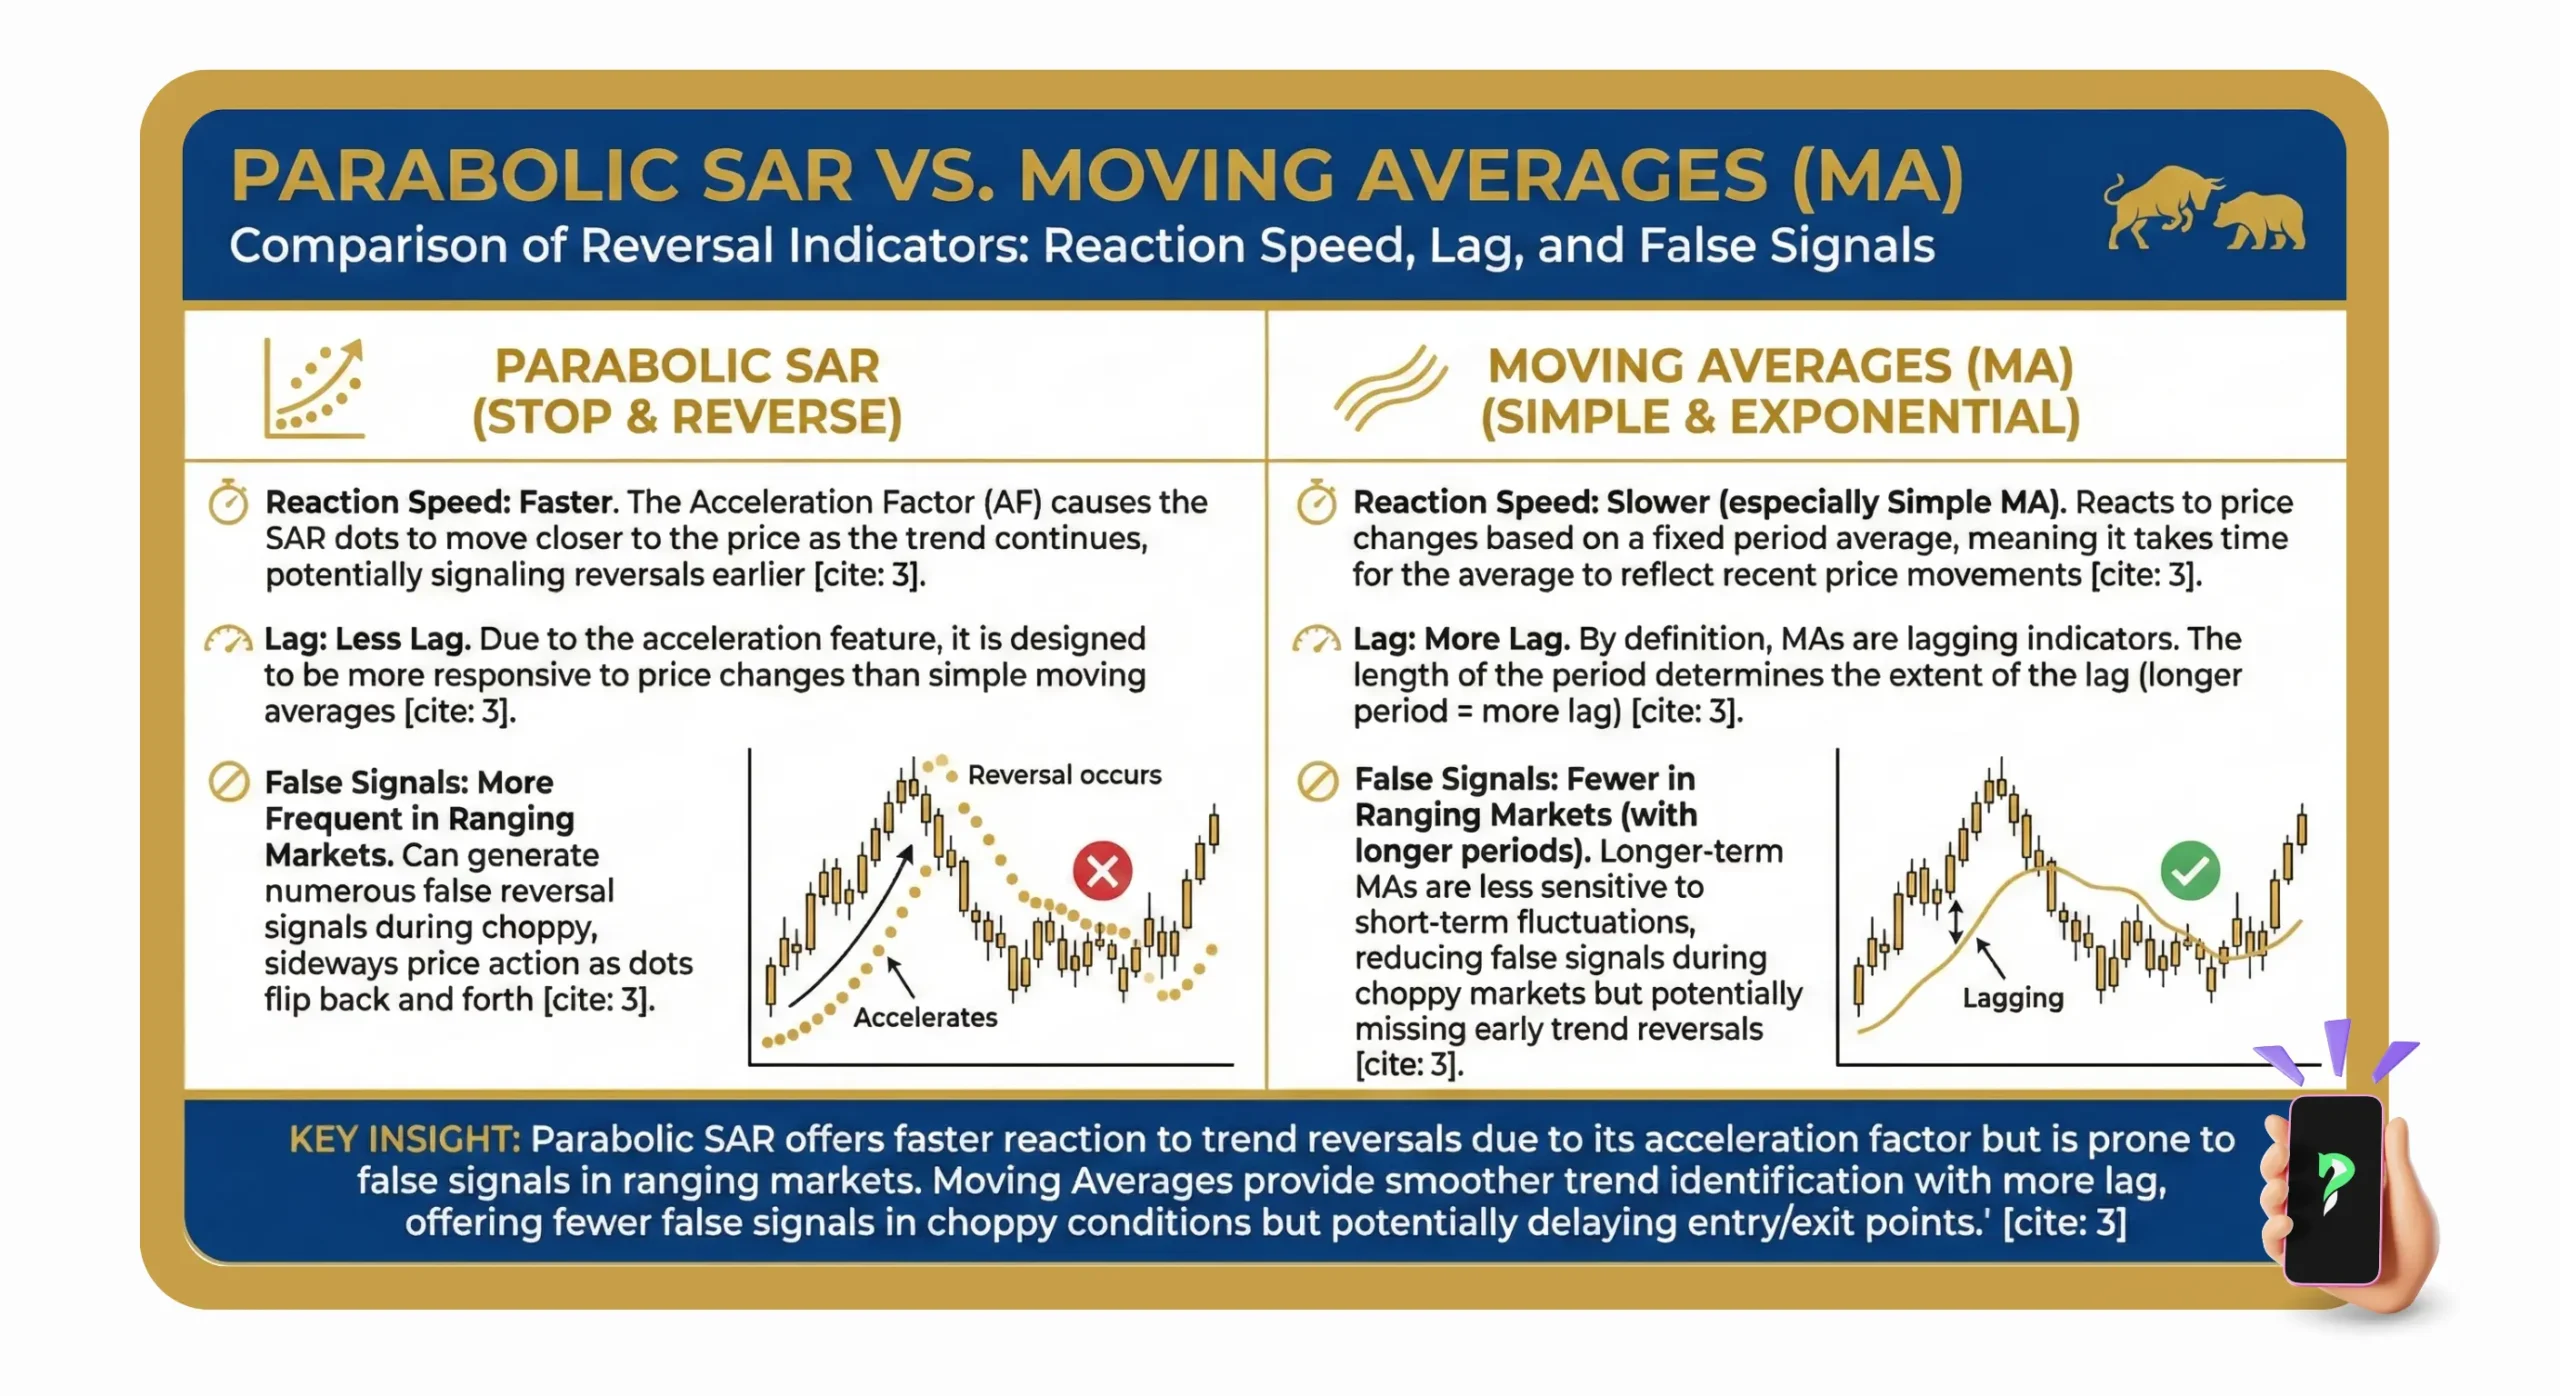
Comparison of reversal indicators


