Professional trading often shifts the focus from simple win rates to the mathematical balance between risk and return. This balance is defined by the risk-reward ratio, a critical metric used to evaluate whether a trade’s potential payout justifies the capital at risk. By utilizing the ratio risk reward concept, traders can establish a framework where successful outcomes are large enough to mathematically offset inevitable losses.
This guide provides a comprehensive breakdown of how the ratio risk reward dynamic works in live markets. You will learn how to calculate this metric by dividing potential profit by potential loss, enabling more disciplined, objective, and sustainable decision-making in any financial environment.
Key Takeaways
- What is the risk-to-reward ratio? It is a measure that compares a trade’s potential loss to its potential return.
- What does RR mean in trading? “RR” is the common shorthand for this crucial risk management metric.
- The formula divides the potential reward by the potential risk (Reward ÷ Risk).
- The Benchmark: A common benchmark is 1:2 or higher, meaning the potential return is at least twice the amount risked.
- The Core Value: Understanding this concept is the absolute foundation of professional risk management and defines a trader’s long-term profitability.
1. What Is the Risk-Reward Ratio?
1.1. Definition and Basics
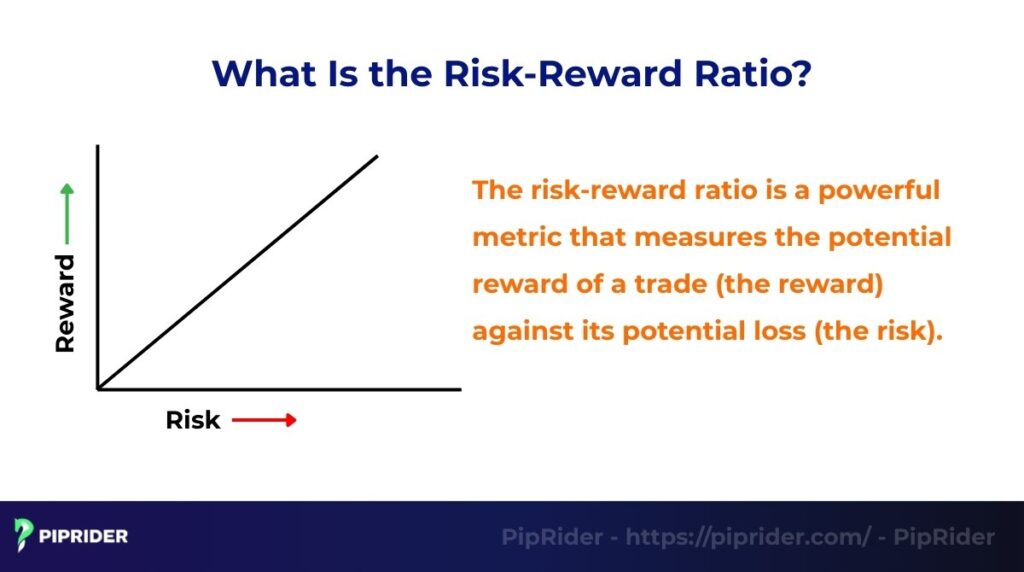
The risk-reward ratio (RRR) is a powerful metric that measures the potential reward of a trade against its potential loss (the risk). It is used by traders and investment professionals to assess the viability of a specific trade setup against their financial objectives (Hayes, 2025).
The ratio answers the fundamental question: “How much am I willing to risk to make a certain amount of gain?” It is often expressed as a comparison, such as 1:2 or 1:3. A 1:3 risk-reward ratio means a trader is risking $1 for the potential to make $3 (O’Connell, 2025).
1.2. Why the Risk-Reward Ratio Is Important
This ratio is a cornerstone of professional market activities because it is the key to long-term investment profitability. By ensuring that potential returns are consistently larger than potential risks, a trader can be profitable even if they lose more trades than they win.
It forces a trader to make disciplined, objective decisions rather than emotional ones. A trade is only taken if the return justifies the risk, turning market speculation from a gamble into a strategic business. This is the foundation of effective stock risk management.
2. How to Calculate the Risk-Reward Ratio
Calculating RRR before every trade is a non-negotiable step in professional trading. It’s a simple process that requires traders to define exit points before entering.
2.1. The Formula
The reward risk ratio formula is straightforward. First, you determine the two key values in monetary terms or in pips:
- Risk: The distance from entry price to stop loss price.
- Reward: The distance from entry price to take-profit price.
The ratio is then calculated by dividing potential return by potential risk (SmartAsset, 2025).
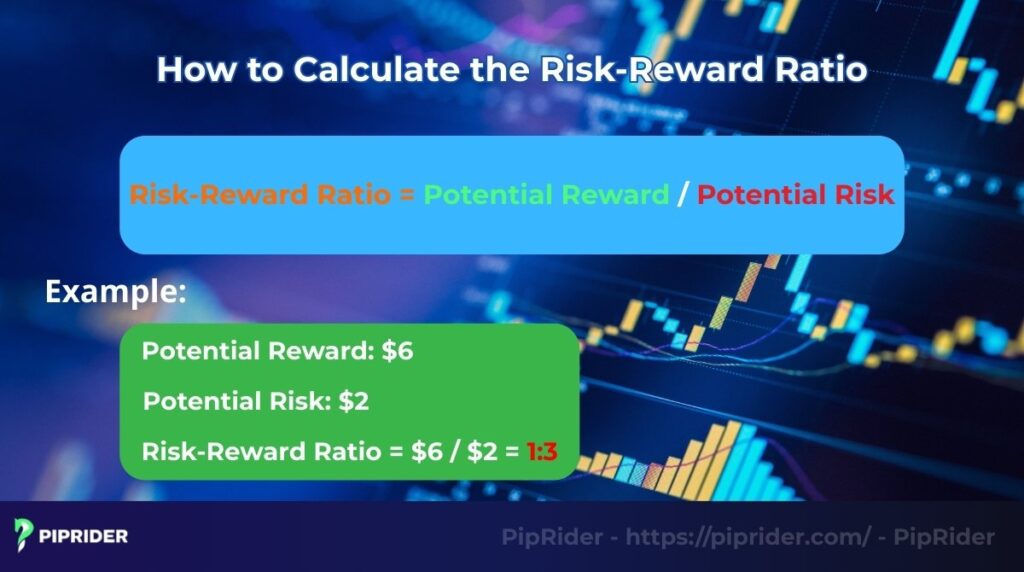
Risk-Reward Ratio = Potential Reward / Potential Risk
2.2. Practical Example of Calculation
Let’s apply how to calculate risk to reward ratio to a real trade. Imagine you want to buy a stock at $50.
- Define Risk: You place stop loss at $48.
Potential Loss = $50 – $48 = $2 per share.
- Define Reward: You set a price target at $56.
Potential Return = $56 – $50 = $6 per share.
- Calculate the Ratio: Potential return ($6) is three times potential risk ($2). Therefore, your risk-to-reward ratio for this trade is 1:3.
3. Interpreting the Ratio
Calculating the ratio is the first step; understanding what it means for strategy is the next. Interpreting the RRR is how a trader decides if a setup is worth taking.
3.1. What Is a Good Risk-Reward Ratio?
The answer to this question is not just a number; it’s a core part of a trader’s entire investment approach. A “good” ratio is one that allows an approach to generate a profitable return over the long term, even with a realistic win rate. Generally, professional traders seek setups where the reward is significantly greater than the risk (a ratio greater than 1:1).
Focusing on trades with a favorable ratio shifts a trader’s mindset from “needing to be right on every trade” to “managing risk effectively,” which is the key to sustainable trading. It ensures that the gains from winning trades are large enough to cover the losses from the inevitable losing trades.
3.2. Common Benchmarks and the Break-Even Win Rate
While the ideal ratio is strategy-dependent, understanding the mathematical relationship between your RRR and your required win rate is crucial. This metric is known as the Break-Even Win Rate, the exact percentage of trades you need to win just to avoid losing money.
The Break-Even Win Rate Formula:
Break-Even Win Rate % = 1 / [1 + (Reward / Risk)]
Here is how common benchmarks illustrate the power of this metric:
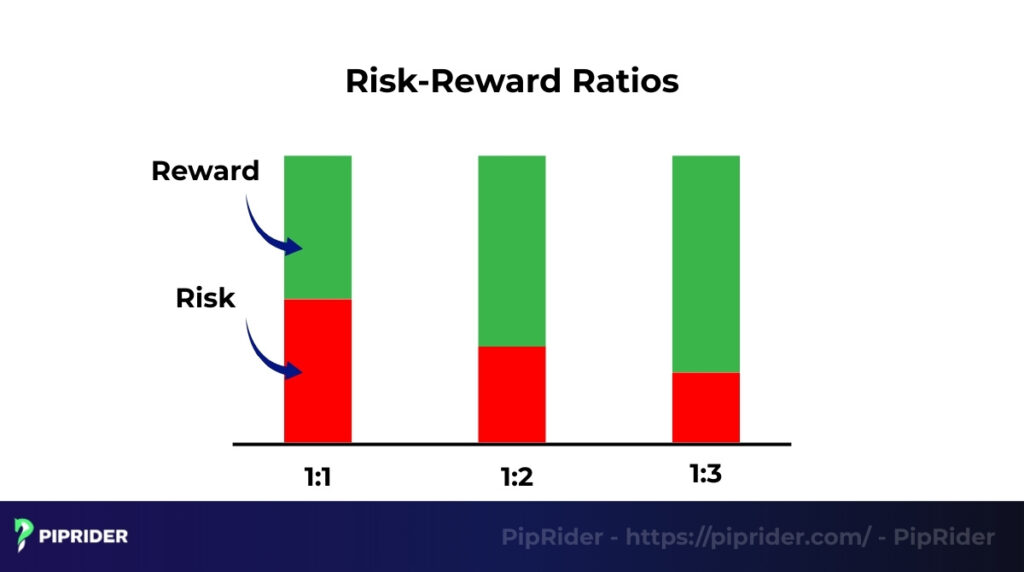
- 1:1 Ratio: The potential reward equals the risk. You need a win rate of exactly 50% just to break even.
- 1:2 Ratio: The potential reward is double the risk. You only need a win rate of 33.3% to break even.
- 1:3 Ratio: Risking $1 to potentially make $3. You achieve break-even with a win rate of just 25%, highlighting the immense power of effective risk management.
Quick Reference: Risk-Reward vs. Break-Even Win Rate
To be a profitable trader, your actual win rate must be higher than the percentages shown below for your chosen ratio:
| Risk:Reward Ratio | Reward Multiple | Minimum Win Rate to Break Even |
|---|---|---|
| 1:0.5 | 0.5x | 66.6% |
| 1:1 | 1.0x | 50.0% |
| 1:1.5 | 1.5x | 40.0% |
| 1:2 | 2.0x | 33.3% |
| 1:3 | 3.0x | 25.0% |
| 1:4 | 4.0x | 20.0% |
3.3. Expectancy: The Ultimate Profitability Formula
While the Risk-Reward Ratio dictates your potential payout, it must be combined with your historical win rate to determine if your strategy is mathematically sound. Professional traders measure this using expectancy, expressing risk and reward in “R-multiples” (where a standard loss equals 1R, and a win yields a multiple of R).
The Expectancy Formula:
Expectancy (in R) = (Win Rate × Reward Multiple) – (Loss Rate × 1R)
(Note: Your Loss Rate is simply 100% minus your Win Rate).
For example, imagine a strategy with a 40% win rate and an average Risk-Reward Ratio of 1:2 (meaning your winning trades yield a 2R reward):
- Winning trades contribute: 40% × 2R = +0.8R
- Losing trades cost: 60% × 1R = -0.6R
- Total Expectancy: +0.8R – 0.6R = +0.2R
A positive expectancy (+0.2R) means that over a large sample size, you can expect to profit 0.2 times your initial risk on every single trade you execute. This metric is the ultimate proof that your trading system possesses a real statistical edge.
4. Risk and Reward in Financial Markets
To calculate the ratio accurately, a trader must have an objective definition of both risk and return for every single trade. These factors are essential for making informed trading decisions.
4.1. What Is ‘Risk’?
Risk is the one variable a trader can completely control. It is the specific, pre-calculated monetary amount that will be lost if a trade fails. This is not an arbitrary number; it is determined by placing a stop-loss order at a logical invalidation point on the chart (such as below a key support level). By defining the risk before entering a trade, a trader transforms an unknown outcome into a calculated business expense.
4.2. What Is ‘Reward’?
Return represents the potential, estimated gain from a trade. It is calculated as the monetary difference between the entry price and a predefined price target. This target is not based on hope but on objective evaluation, such as the next major resistance level or a measured move from a chart pattern. Defining the return beforehand provides a clear goal and helps a trader overcome greed by exiting according to their plan.
5. Managing Risk with the Risk-Reward Ratio
Understanding the math behind the ratio is only the first step; the true value lies in execution. In a live trading environment, the RRR transitions from a theoretical calculation into a practical framework for strict capital preservation. It bridges the gap between your chart analysis and actual account protection through two specific applications: precise order placement and dynamic trade sizing.
5.1. Stop-Loss and Take-Profit Placement
The Risk-Reward Ratio is fundamentally dictated by where a trader places their stop-loss and take-profit orders relative to their entry price. A professional rule of thumb is to never enter a trade without pre-defining these exact exit points.
To do this correctly, the analysis must follow a strict, chronological order:
- Step 1 (Define the Risk): First, identify a logical stop-loss level based on technical analysis (e.g., placing it safely below a major support zone). The exact distance from your entry price to this stop-loss becomes your baseline risk.
- Step 2 (Define the Reward): Next, identify a realistic take-profit target based on objective market structure (e.g., the next major resistance level). The distance from your entry to this target is your potential reward.
- Step 3 (Calculate the Ratio): Finally, divide the reward distance by the risk distance to find your profit multiple.
By mathematically comparing these distances before executing the order, a trader can instantly filter out subpar setups. If the calculation does not meet their minimum benchmark (such as 1:2), the trade is simply abandoned, protecting capital from mathematically disadvantageous situations.
5.2. Position Sizing: The Missing Link
The Risk-Reward Ratio tells you the quality of the trade, but position sizing tells you how much to trade. These two concepts are inseparable. An excellent 1:3 ratio is useless if a trader risks 50% of their account on a single setup and it happens to hit the stop-loss.
Professional traders use their predefined risk (the distance from the entry to the stop-loss) to calculate their exact position size. This ensures they never lose more than a fixed percentage of their total capital—typically 1% to 2%—on any given trade, regardless of how wide or tight the stop-loss is.
The Position Sizing Formula:
Position Size = Account Risk Amount / Stop-Loss Distance
For example, if you have a $10,000 account and strictly risk 1% ($100) per trade, and your stop-loss distance is $2, you can safely buy exactly 50 shares ($100 / $2).
Note for Forex traders: This exact same logic applies when dividing your dollar risk by your stop-loss in pips to calculate your specific lot size.
By keeping your monetary risk constant, you allow the mathematical edge of a favorable RRR to play out over a large sample size of trades without the danger of ruining your account.
5.3. Real-World Execution Costs
The theoretical RRR on your chart is rarely what you get in your live account. In Forex and CFDs, you must factor in these 5 execution costs to calculate your true net RRR:
- Bid/Ask Spread Mechanics: When you Buy, you enter at the higher Ask price, but your Stop-Loss and Take-Profit trigger at the lower Bid price. You start at a slight mathematical disadvantage the millisecond you enter.
- The Spread Penalty: Spreads artificially increase your risk and shrink your reward. Example: With a 10-pip SL and 20-pip TP (theoretical 1:2 RRR), a 2-pip spread changes your reality to a 12-pip risk and 18-pip reward. Your actual ratio drops to 1:1.5.
- Commissions and Swaps: Flat-rate broker commissions and negative overnight swap rates eat directly into your net payout, reducing the numerator (Reward) in your calculation.
- Slippage During Volatility: Stop-losses are market orders. During major news events, slippage can fill your stop at a much worse price, unexpectedly expanding your actual risk.
- The “Timeframe Trap”: Fixed costs like spreads and commissions consume a massive percentage of your profit on lower timeframes (e.g., 1-minute scalping). Ensure your target is large enough to absorb these fees.
6. Pros and Cons of Using the Risk-Reward Ratio
Like any tool, the RRR is most effective when a trader understands both its powerful advantages and its limitations.
6.1. Advantages for Traders
Incorporating this ratio into your strategy offers several key advantages based on objective mathematics:
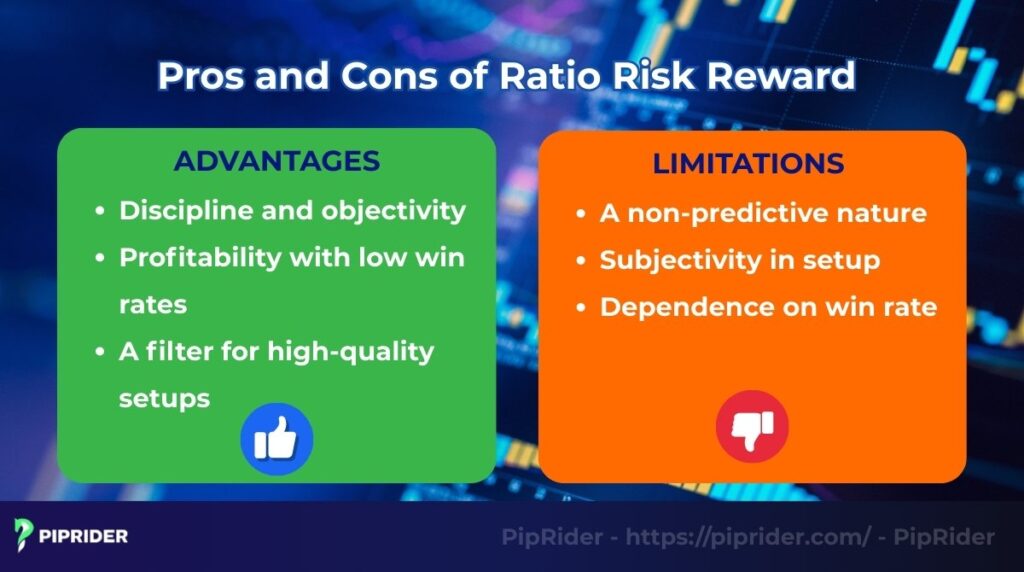
- Discipline and objectivity: It forces you to think logically, preventing emotional trades based on hope or fear.
- Profitability with low win rates: A favorable ratio allows you to generate long-term profits, even if you lose more trades than you win.
- A quality control mechanism: It provides a strict mathematical filter to instantly weed out trades where the potential payout does not justify the capital at risk.
6.2. Limitations to Be Aware Of
However, a trader must also be aware of its inherent limitations:
- A non-predictive nature: The RRR is a risk management tool, not a predictive one. A trader must have tolerance for the fact that it does not increase the chance of a single trade being a winner.
- Subjectivity in setup: The scale is only as objective as the stop-loss and price target levels it is based on, which can be subjectively chosen by the trader.
- Dependence on win rate: A high RRR is meaningless if an approach has a near-zero win rate. The two metrics must always be considered together.
7. Illustrative Examples (How the Math Works)
To move beyond theory, let’s apply these risk management principles to two practical market scenarios. While these are illustrative examples, they demonstrate the exact mathematical process professional traders use to evaluate setups every single day.
7.1. Forex Scenario: A 1:3 Setup on GBP/USD
The Context: Imagine the GBP/USD pair is in a strong short-term uptrend but experiences a corrective pullback down to a major psychological support level at 1.2500. A clear bullish engulfing candlestick forms on the 4-hour chart, signaling that buyers are stepping back in.
- Entry: You wait for the candle to close and enter a long (buy) position at 1.2510.
- Stop-Loss (The Risk): To avoid being stopped out by random market noise, you place the stop-loss safely below the 1.2500 support level at 1.2480. Your total risk is 30 pips.
- Take-Profit (The Reward): You identify the next major structural resistance level on the daily chart at 1.2600. Your potential reward is 90 pips.
- The Calculation: 90 pips (Reward) / 30 pips (Risk) = 3.
- The Result: Your RRR is 1:3. Because this ratio is excellent and comfortably exceeds the professional 1:2 minimum, the trade is mathematically justified.
7.2. Stock Market Scenario: A 1:2.5 Breakout on AAPL
The Context: Consider a stock like Apple Inc. (AAPL) forming a classic bullish consolidation pattern (such as a cup and handle) just below a key resistance zone of $170. As volume increases, the stock begins to break out above this resistance.
- Entry: You decide to buy the stock upon confirmation of the breakout at $171.
- Stop-Loss (The Risk): The stop-loss is placed just below the recent swing low of the consolidation pattern at $167. If the price drops here, the breakout is invalidated. Your total risk is $4 per share.
- Take-Profit (The Reward): Using a measured move technique from the chart pattern, you project a logical price target at $181. Your potential return is $10 per share.
- The Calculation: $10 (Reward) / $4 (Risk) = 2.5.
- The Result: Your RRR is 1:2.5. Since this is better than the 1:2 minimum threshold, it represents a high-quality setup to execute.
8. Common Mistakes to Avoid
The Risk-Reward Ratio is a powerful mathematical tool, but its effectiveness is easily destroyed by emotional execution. To protect your capital, absolutely avoid these five critical behavioral mistakes:
- Focusing Solely on the Payout (Ignoring the Win Rate): A high RRR is not a magic bullet. Chasing a 1:5 ratio strategy is financially destructive if your stop-loss gets hit 90% of the time. You must balance your desired reward multiple with a realistic win rate to maintain a positive expectancy.
- Forcing the Setup (Unrealistic Targets): A frequent amateur error is placing a take-profit target arbitrarily far away just to manually “create” a 1:2 or 1:3 ratio on a chart. Your price targets must be dictated by objective market structure (like the next major resistance zone), not your personal financial goals.
- Choking the Trade (Micro Stop-Losses): In an attempt to mathematically maximize the reward multiple, traders often place their stop-loss extremely close to the entry point. While this makes the theoretical ratio look amazing (e.g., 1:10), normal market noise will repeatedly trigger the stop, completely destroying the trader’s win rate.
- Moving the Stop-Loss Mid-Trade: Widening a stop-loss to give a losing position “more room to breathe” is mathematically disastrous. If you increase your risk distance while the trade is active, you alter the denominator of the equation, turning a carefully planned 1:2 setup into a mathematically flawed 1:0.5 risk-reward nightmare.
- Trading the “Chart” Instead of the “Price” (Ignoring Spreads): Especially on lower timeframes (like 1-minute or 5-minute charts), drawing a perfect 1:2 tool ignores the reality of the bid/ask spread and broker commissions. The mistake is executing the trade without ensuring the target is large enough to absorb these hidden execution costs.
9. Frequently Asked Questions About the Risk-Reward Ratio
10. Conclusion
In conclusion, mastering the ratio risk reward concept is more than just a calculation; it is the cornerstone of a professional investment mindset. By focusing on setups where the potential return outweighs the risk, traders can build a sustainable and profitable investment career.
To continue developing a complete trading system, we encourage you to explore our in-depth guides in the Trading Strategies category on Piprider. If you have any questions or comments, please leave them below!