Ever wondered if large institutional players leave footprints on the chart? The Wyckoff methodology is a century-old, time-tested approach designed to do exactly that: read their intentions. It offers a complete framework for understanding market cycles, from accumulation to distribution, by analyzing the interplay between price, trading activity, and time.
This in-depth guide will break down the core principles, the four market phases, and the practical trading strategies that make the Wyckoff method an enduring and powerful tool for serious traders.
Key Takeaways
- A Market Logic Framework: Decodes institutional intent by analyzing the structural interplay between price, volume, and time.
- Institutional Behavior Model: Operates on the “Composite Man” concept, viewing market movements as planned institutional campaigns rather than random noise.
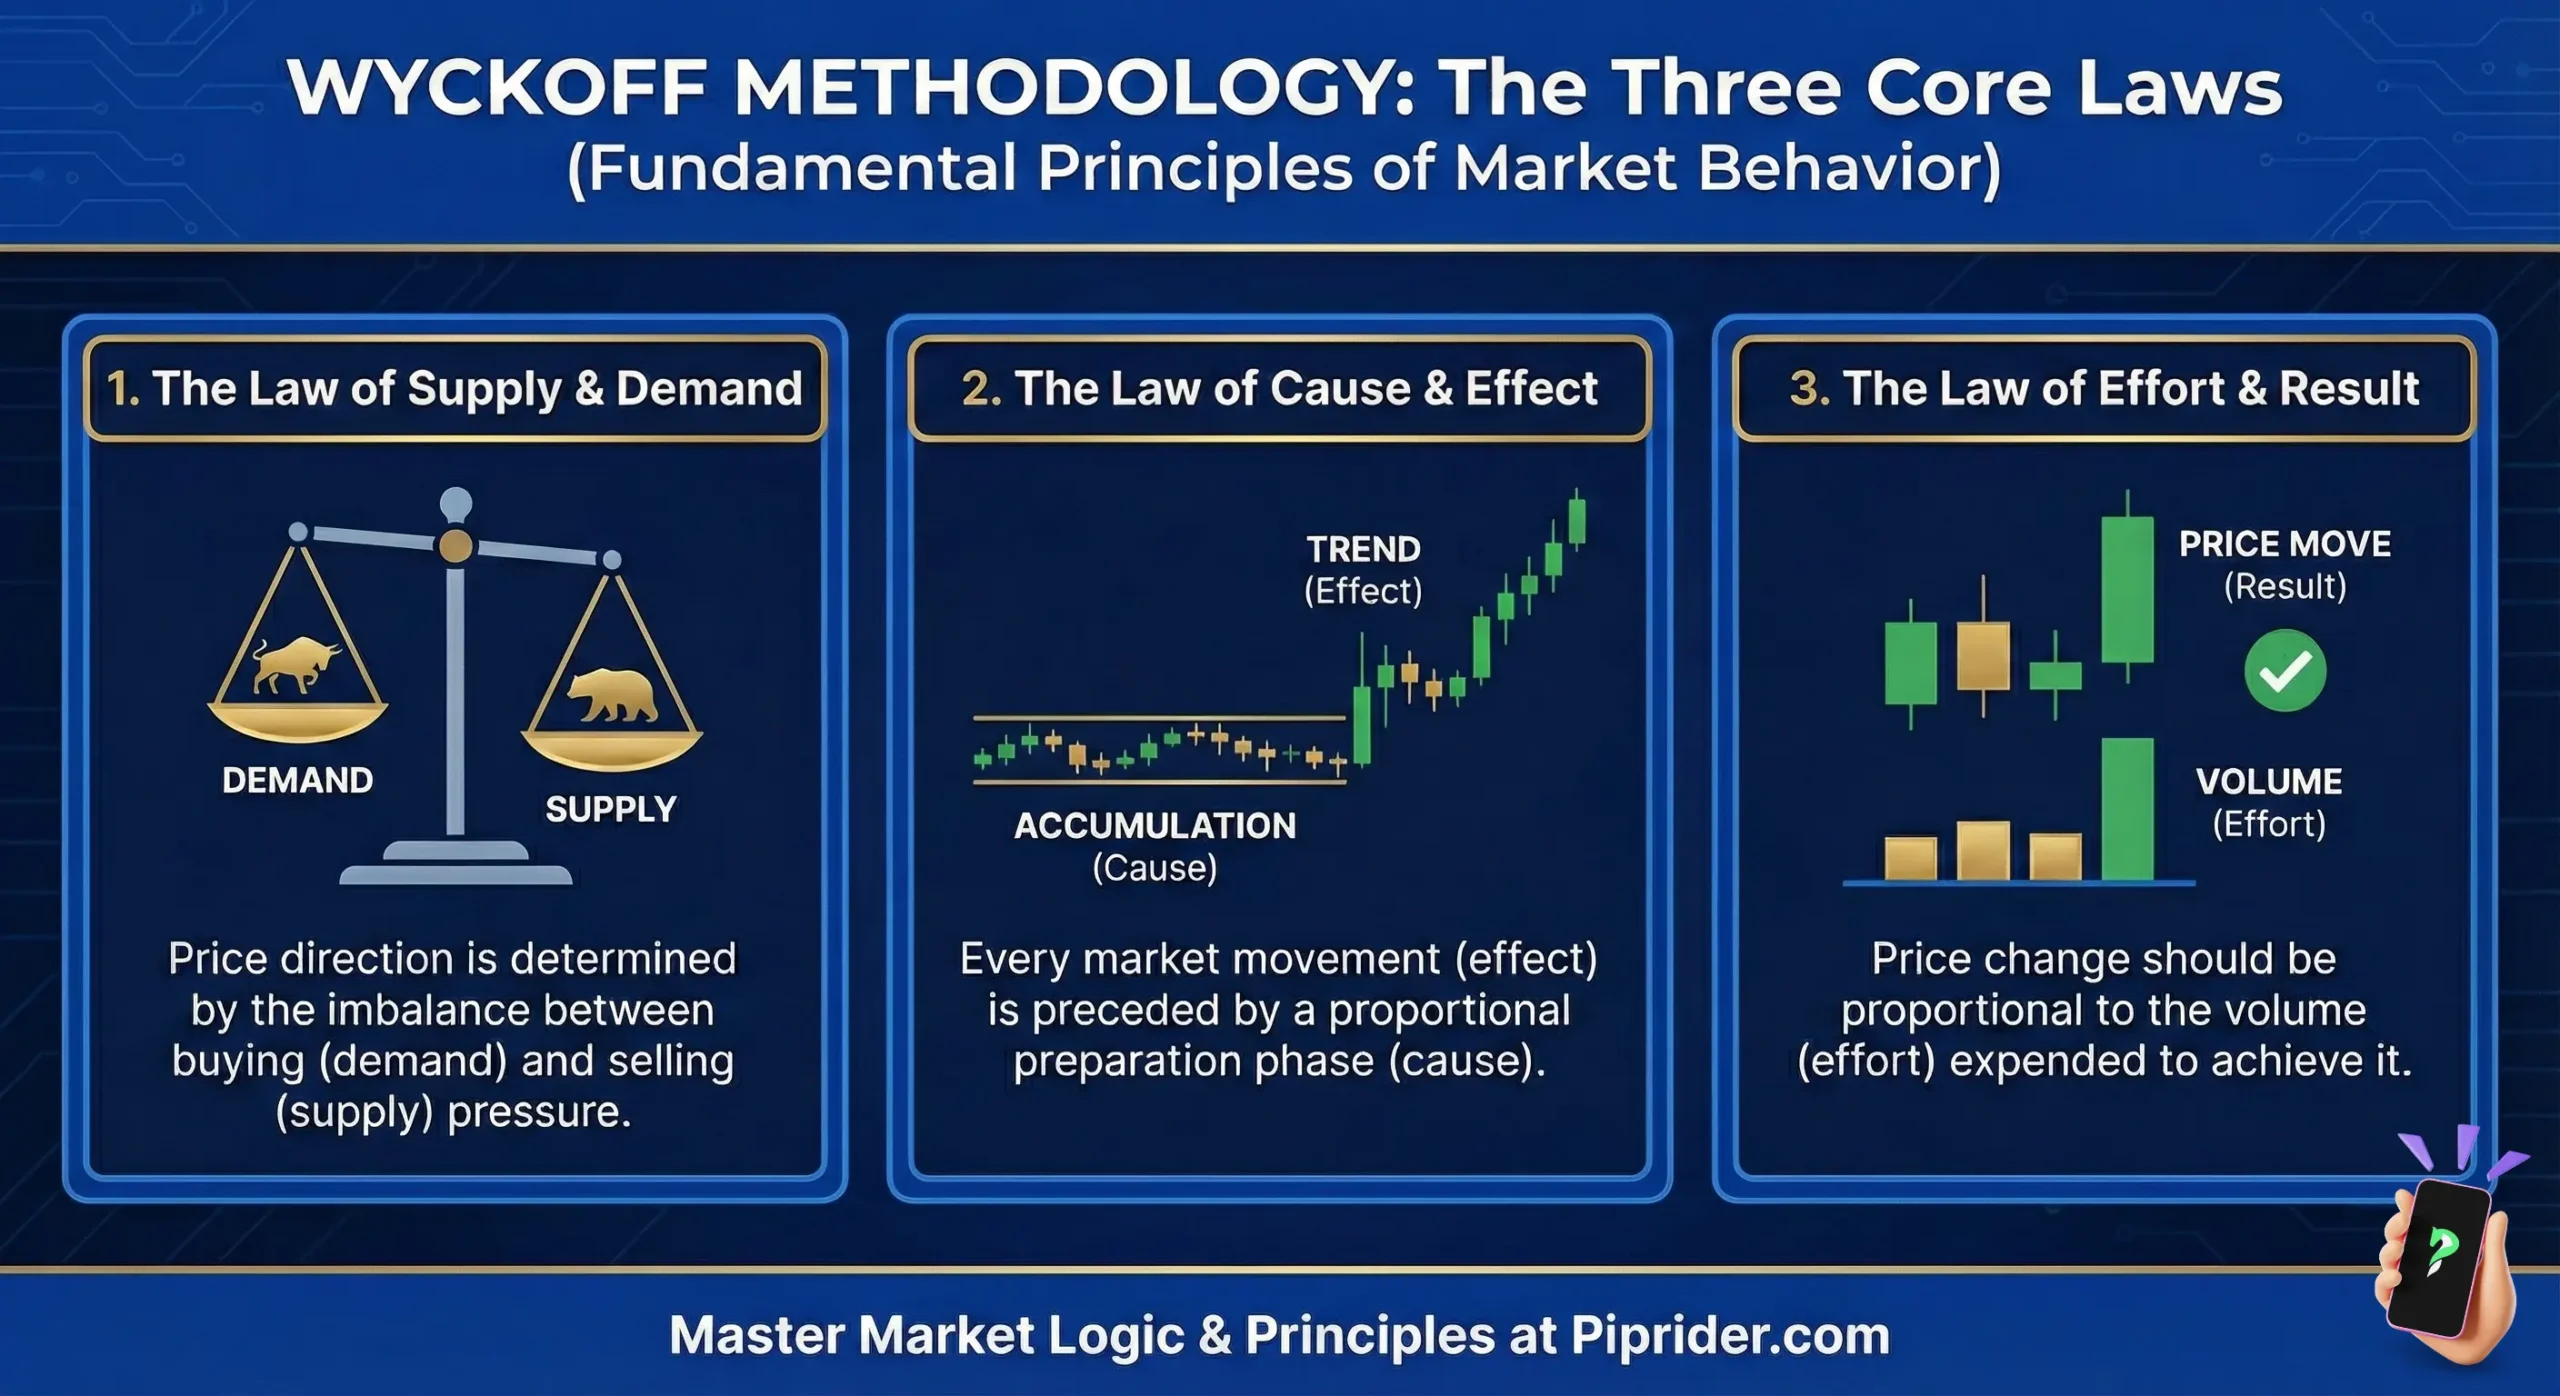
- Governed by Market Physics: Driven by three immutable laws: Supply and Demand, Cause and Effect, and Effort vs. Result.
- Structural Market Phases: Identifies an asset’s position within the four-stage cycle: Accumulation, Markup, Distribution, and Markdown.
- Strategic Alignment: Focuses on synchronizing entries with “Smart Money” only after a sufficient “Cause” has been established to produce a significant “Effect”.
1. What Is the Wyckoff Method?
The Wyckoff Method represents a comprehensive macroeconomic framework developed by Richard Wyckoff in the early 20th century. Professional practitioners utilize this system to decode the hidden intentions of large, institutional investors, often referred to as the “Smart Money”, by analyzing the real-time footprint of price, volume, and time.
Why does the Wyckoff Model Work?
Endurance of the model stems directly from its foundation in the immutable laws of market physics rather than lagging mathematical indicators. Wyckoff theorized that a single entity, the “Composite Man,” orchestrates all market cycles (Wyckoff, 1931). Deciphering the subtle signs of institutional absorption (accumulation) or liquidation (distribution) allows agile traders to align their capital with the market’s most dominant forces.
Modern Application in Technical Analysis
Contemporary financial markets maintain the exact same behavioral dynamics as they did a century ago. Applying the Wyckoff methodology provides a contextual layer to standard price action, shifting the focus from reacting to random candlestick patterns to anticipating high-probability structural shifts.
2. Wyckoff Market Logic: The Foundational Pillars
The Wyckoff Methodology rests upon three immutable laws and a psychological framework designed to decode institutional behavior. Professional analysis treats these principles as “Market Physics”, a system where price action is never random but is the result of structural intent (Pruden, 2007).
2.1. The “Composite Man” (Institutional Mindset)
The Composite Man serves as a strategic mental model for interpreting complex market movements. Rather than viewing price action as chaotic retail noise, practitioners assume that all fluctuations result from a single, intelligent entity representing the collective force of major institutional players.
- Strategic Campaigns: Informed professionals carefully plan and execute long-term campaigns to accumulate assets at wholesale prices and distribute them at retail prices.
- Goal of the Logic: Analyzing price and volume allows a trader to determine whether “Smart Money” is currently in a phase of absorption or liquidation, ensuring trades remain in harmony with the dominant institutional trend.
2.2. The Law of Supply and Demand
The Law of Supply and Demand dictates that price direction results solely from the shifting balance between buyers and sellers.
- The Imbalance Principle: Price appreciation occurs only when Demand exceeds Supply, while price depreciation follows when Supply overwhelms Demand.
- Numerical Illustration: Imagine an asset has 10,000 units available for sale at a specific resistance level, but institutional buyers place orders for 50,000 units. This 5:1 imbalance creates an immediate supply vacuum, forcing price to surge aggressively until new sellers are attracted to reach equilibrium.
2.3. The Law of Cause and Effect
The Law of Cause and Effect functions as the primary predictive engine of the framework, stating that the magnitude of a trend is proportional to the energy built during preparation.
- Energy Accumulation: Horizontal trading ranges represent the Cause (energy storage), while the subsequent trend represents the Effect (energy release).
- Numerical Case Study: A two-month accumulation range builds a significantly larger “Cause” than a two-week range. Logic dictates that a 2-month Cause may mathematically project a 15%–20% breakout potential, whereas a shorter 2-week preparation might exhaust its energy after a mere 3% move.
2.4. The Law of Effort vs. Results
The Law of Effort vs. Results acts as an internal diagnostic tool to evaluate the quality and sustainability of a move. Effort is represented by volume (institutional participation), while the Result is the price spread.
Trend Exhaustion (Divergence): A 300% surge in volume (Extreme Effort) that fails to move the price more than 0.2% (Minimal Result) signals a massive divergence. Such an imbalance proves that the “Composite Man” is stepping in to absorb the move, indicating that the current trend has exhausted its “fuel” and a reversal is imminent.
Trend Confirmation (Harmony): Alignment between high effort and a wide price spread confirms that dominant players are successfully driving the market.
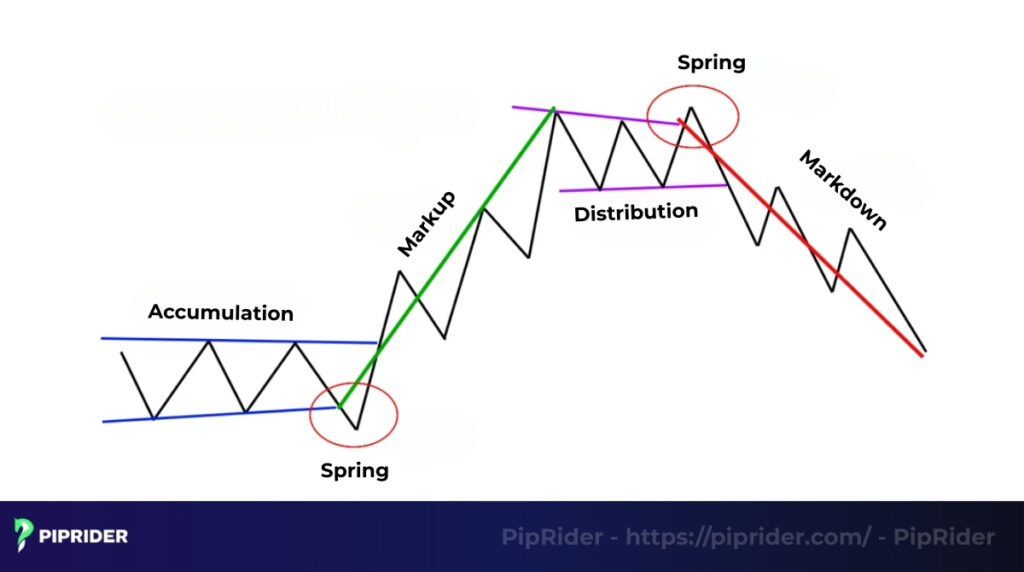
3. The Wyckoff Market Cycle
The Wyckoff methodology is built around four-phase market cycles. Understanding these phases helps a trader identify where the market is in its overall cycle and what to expect next.
| Market Phase | Institutional Objective | Price & Volume Signature | Retail Psychology |
|---|---|---|---|
| Accumulation | Absorption of public supply at wholesale prices. | Narrow spreads; low volume on dips; volume surge on rallies. | Discouragement & Boredom |
| Markup | Trend Progression to capitalize on the “Cause.” | Wide bullish spreads; high volume on breakouts. | Growing Confidence & FOMO |
| Distribution | Liquidation into peak retail demand. | High volatility; extreme volume spikes with no price gain. | Euphoria & Greed |
| Markdown | Asset Abandonment as supply overwhelms demand. | Sharp declines; wide bearish spreads; panic volume. | Fear & Desperation |
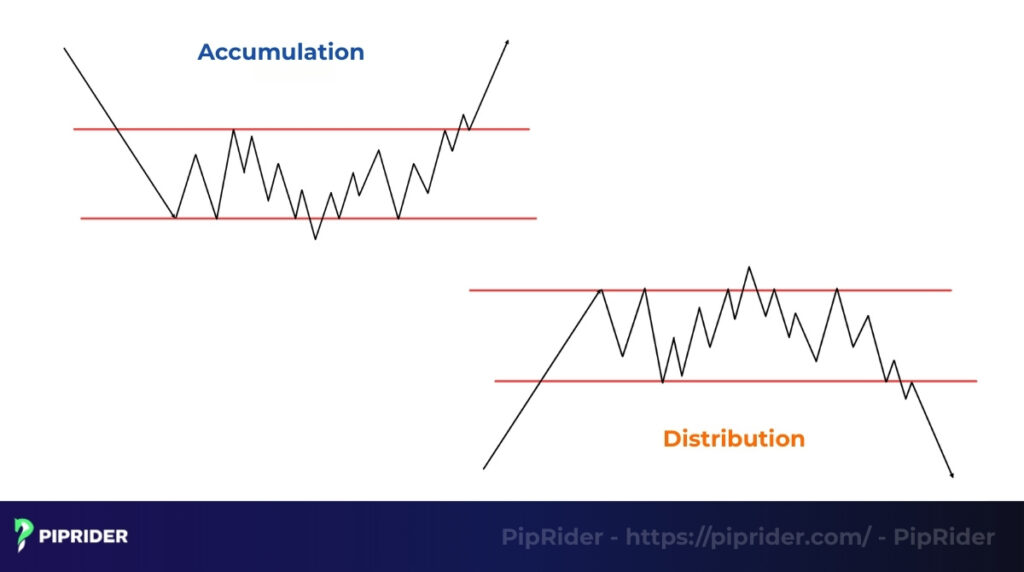
Accumulation: The Institutional Loading Zone
Professional operators quietly absorb assets from exhausted retail sellers during this preparatory stage. Horizontal price action prevents premature rallies while the “Composite Man” finalizes large positions at wholesale prices.
Markup: Trend Validation and Execution
Completion of institutional absorption creates a “supply vacuum,” allowing prices to surge with minimal resistance. Dominant demand drives the market upward, validated by wide price spreads and increasing volume on the breakout.
Distribution: Creating Exit Liquidity
Large players systematically liquidate holdings to an uninformed public at retail prices during this topping phase. High volatility and optimistic news headlines generate the exit liquidity required for institutions to sell massive positions without crashing the market immediately.
Markdown: The Final Liquidation Trend
Complete withdrawal of institutional support marks the beginning of the Markdown phase. Heavy supply overwhelms the remaining weak demand, leading to rapid declines that trigger retail stop-losses and initiate a new cycle of panic.
4. Wyckoff Behavioral Roadmaps
Wyckoff schematics function as strategic blueprints rather than static price patterns, providing a visual framework to track the footprint of institutional campaigns. These diagrams serve as behavioral roadmaps where individual price events gain significance only when analyzed within the broader structural context of the market cycle (StockCharts, n.d.).
4.1. The Accumulation Behavioral Roadmap (Phases A–E)
Accumulation represents the systematic process of institutional asset absorption, mapping the transition of ownership from the public to professional demand. Practitioners utilize these five phases to determine when the “Composite Man” has completed their buying campaign.
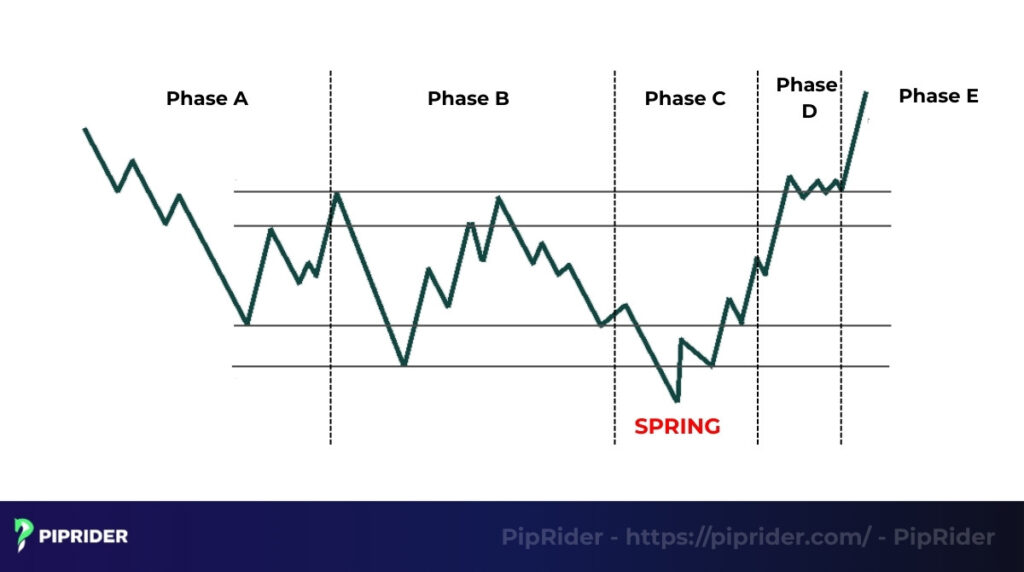
- Phase A: Halting the Prior Trend. Structural milestones like Preliminary Support (PS) and the Selling Climax (SC) stop downward momentum by providing the massive liquidity required for institutional entry. An Automatic Rally (AR) and a Secondary Test (ST) follow to define the initial boundaries of the trading range.
- Phase B: Building the Cause. Strategic absorption occurs as smart money quietly builds the “Cause” for the future uptrend. Market dynamics in Phase B involve constant testing of supply and demand, making it the longest duration of the cycle as institutional players exhaust public supply.
- Phase C: The Final Liquidity Trap. A decisive test of remaining supply often results in a “Spring”, a deliberate move below support designed to purge final sellers and trigger retail stop-losses. Logic dictates that a Spring serves as the ultimate Liquidity Trap to finalize institutional absorption immediately before the trend begins.
- Phase D: Confirmation of Dominant Demand. Evidence of institutional control emerges as price moves toward the upper boundary of the range. Consistent strength appears through Signs of Strength (SOS) and Last Points of Support (LPS), proving that demand has officially overwhelmed supply.
- Phase E: Execution of the Markup. Full trend progression marks the final stage where the asset leaves the accumulation area. Demand maintains complete control as the new markup phase commences in earnest.
4.2. The Distribution Behavioral Roadmap (Phases A–E)
Distribution acts as the mirror image of accumulation, mapping the systematic liquidation of institutional holdings to an uninformed public.
- Phase A: Halting the Uptrend. Institutional selling begins to stop the upward momentum through Preliminary Supply (PSY) and the Buying Climax (BC). An Automatic Reaction (AR) and Secondary Test (ST) of the highs establish the distribution range.
- Phase B: Distributing Assets. Market consolidation allows large players to sell their positions into public buying demand without prematurely crashing the price, building the “Cause” for the upcoming markdown.
- Phase C: The Final Bull Trap. A final test of demand often features an Upthrust After Distribution (UTAD). Pushing prices briefly above resistance creates a Liquidity Trap for bullish traders, providing the necessary exit liquidity for institutions to complete their selling campaign.
- Phase D: Confirmation of Dominant Supply. Weakness emerges as price breaks through the bottom of the range. Signs of Weakness (SOW) and Last Points of Supply (LPSY) confirm that institutional support has vanished.
- Phase E: Execution of the Markdown. Supply takes full control as the asset leaves the distribution area, initiating the markdown phase.
4.3. Type 2 Variations: Institutional Urgency
Type 2 Schematics identify structural variations where the market lacks a final “Shakeout” or “Liquidity Trap” in Phase C. These scenarios reflect extreme institutional urgency, where the dominant force initiates a trend without re-testing the boundaries of the trading range.
- Aggressive Accumulation: Price forms a higher low instead of a Spring, signaling that buyers are so aggressive they refuse to allow a final dip below support.
- Urgent Distribution: Formation of a lower high instead of an Upthrust proves that institutional supply is already overwhelming the market, leading to an early markdown.
4.4. The Framework Mindset: Thinking in Frameworks, Not Patterns
Treating Wyckoff schematics as fixed shapes to be memorized remains the primary error of retail traders. Professional analysis recognizes Wyckoff as a dynamic market logic framework rather than a static chart pattern.
- Static Patterns: Traditional analysis looks for “Shape A” to predict “Move B,” often ignoring the underlying “Why”.
- Dynamic Frameworks: A Wyckoff practitioner constantly evaluates the internal market state by asking: “Is supply exhausted? Is the Cause built during consolidation large enough to produce a significant Effect? Is the Composite Man still absorbing liquidity?”.
5. Wyckoff Trading in Practice: Strategic Execution Protocols
Translating theoretical Wyckoff frameworks into actionable trading strategies requires precise execution rules. Professional practitioners utilize this section to transition from macroeconomic analysis to precise capital deployment.
5.1. The Five-Step Institutional Execution Protocol
Richard Wyckoff’s original top-down approach remains the definitive blueprint for professional trade selection. Executing this five-step protocol ensures that capital deployment aligns perfectly with the broader macroeconomic footprint of the “Composite Man” (StockCharts, n.d.).
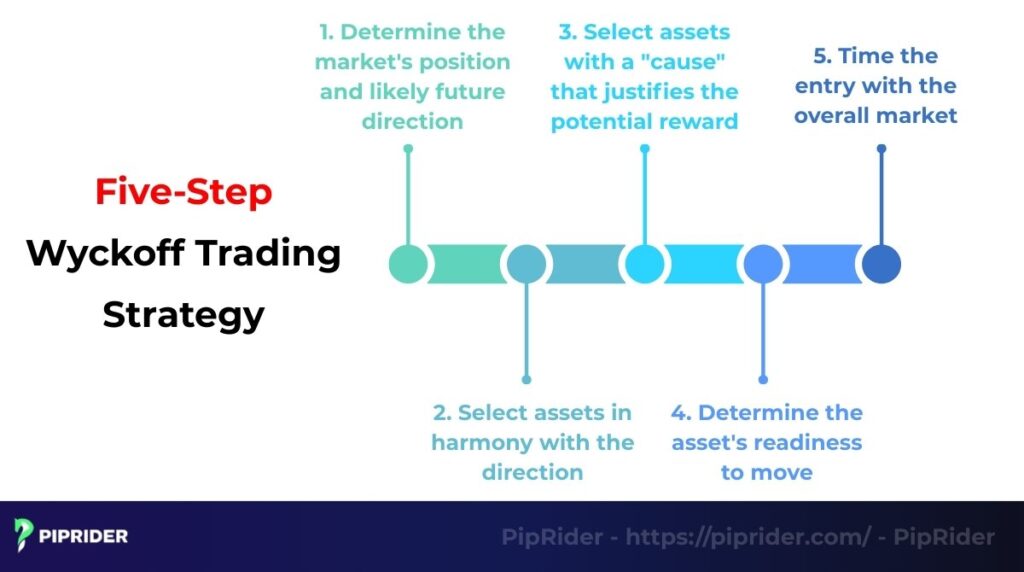
- Step 1: Determine Macro Market Bias. Analyzing the broader market index dictates the overarching strategic posture, establishing whether practitioners should hunt for accumulation structures (long setups) or distribution profiles (short setups).
- Step 2: Filter for Relative Strength. Professional operators isolate assets demonstrating clear relative strength against the benchmark index. Identifying equities or tokens that refuse to drop during market-wide pullbacks highlights aggressive underlying institutional absorption.
- Step 3: Quantify the “Cause” (Reward-to-Risk). The Law of Cause and Effect serves as the ultimate trade filter. Practitioners measure the horizontal width of the consolidation phase to project the potential “Effect,” bypassing setups with a narrow “Cause” to protect capital.
- Step 4: Confirm Structural Readiness. Execution requires definitive proof that the asset is prepared to transition out of the trading range. Pinpointing specific structural milestones—such as a Phase C Liquidity Trap or Phase D Signs of Strength (SOS)—ensures the trader avoids trapping capital in Phase B.
- Step 5: Synchronize Macro Timing. Precision execution involves timing the individual asset’s breakout with a corresponding turning point in the broader market index, maximizing the probability of immediate trend continuation.
5.2. Phase C Entry Execution: Capitalizing on the Liquidity Trap
Executing a trade during a Spring (Accumulation) or UTAD (Distribution) offers the most asymmetric risk-to-reward ratio within the entire market cycle. Capitalizing on these Phase C events requires capitalizing on the exact moment the market traps retail liquidity.
- The Setup (The Trap): Price must explicitly pierce the established Phase A and Phase B support/resistance boundaries. Penetrating these historical levels triggers retail stop-loss orders, providing the massive liquidity required for final institutional execution.
- The Volume Signature (Confirmation): Volume analysis provides the critical filter. A high-volume plunge that immediately reverses and closes back inside the range confirms aggressive institutional participation.
- The Execution Trigger: Initiation of a position occurs explicitly upon the designated timeframe candle closing back inside the established trading range. Entering prematurely invites the fatal risk of catching a genuine breakout trend.
- Risk Management (Invalidation): Strict capital preservation mandates that stop-loss orders must reside firmly beyond the absolute extreme of the Phase C wick. Violation of that ultimate extreme proves that the institutional “Cause” has failed.
5.3. Real-World Case Study: Institutional Absorption in Bitcoin
Analyzing the Bitcoin (BTC/USD) macroeconomic bottom of 2022-2023 provides a textbook demonstration of institutional asset absorption. Translating theoretical schematics into live market data reveals the exact footprint of the “Composite Man” during a period of extreme retail capitulation.
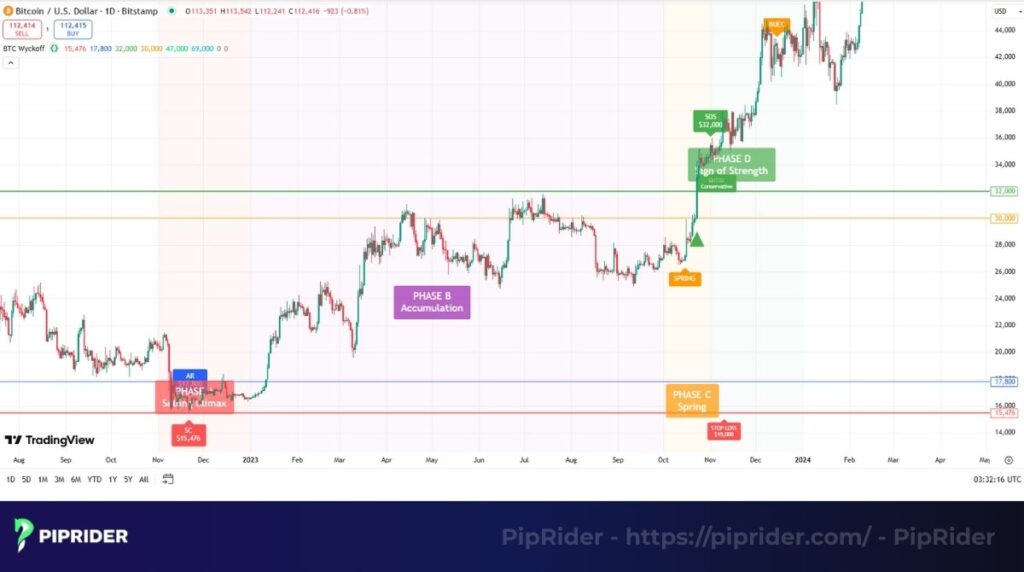
- Phase A & B: Massive public panic generated unprecedented trading volume, culminating in a definitive Selling Climax (SC). Prolonged sideways consolidation dominated the chart for the following months, allowing smart money to systematically build the macro “Cause.”
- Phase C & D: Market makers engineered a devastating Spring by driving the price momentarily below the Phase A support levels, purging weak hands. Dominant demand subsequently overwhelmed supply, generating powerful Signs of Strength (SOS) and allowing professional operators to execute precise, low-risk entries before the Phase E markup.
5.4. The Strategic Trade-Offs: Advantages and Inherent Friction
Evaluating the Wyckoff framework requires acknowledging both its profound strategic advantages and the inherent analytical friction required to master it.
- The Institutional Edge: Mastery of the three fundamental laws provides a complete behavioral model rather than a collection of isolated signals. Decoding volume and price spread grants practitioners the ability to anticipate and exploit retail liquidity traps before they fully materialize.
- The Cognitive Barrier: Internalizing the intricacies of institutional logic demands hundreds of hours of dedicated chart study. Live market data rarely mimics textbook schematics with perfect symmetry, meaning identifying structural milestones requires significant discretionary experience to filter out random market noise.
5.5. Common Misinterpretations: Avoiding the Retail Trap
Professional practitioners recognize that misreading the institutional footprint often leads to significant capital loss. Distinguishing between institutional intent and market noise is the hallmark of a Wyckoff expert.
- Confusing Accumulation with Random Volatility: Retail traders frequently commit the strategic error of labeling every sideways range as “Accumulation.” Genuine accumulation requires evidence of institutional absorption, whereas random sideways noise often results in a continuation of the prior trend.
- Mislabeling Springs vs. Generic False Breakouts: A true Spring is a high-conviction Liquidity Trap occurring specifically after a significant “Cause” has been established. Generic false breakouts occurring without the context of supply exhaustion are often just a sign of continued weakness.
- The Fallacy of Rigid Schematic Matching: Attempting to force real-world market data into the “perfect” shapes of idealized schematics remains a primary cause of analysis paralysis. Successful Wyckoff analysis prioritizes the logic of the phase over the exact visual symmetry of the chart.
6. Institutional Risk Management: Strategic Stop-Loss Placement
Protecting capital within the Wyckoff framework relies entirely on structural invalidation rather than arbitrary percentage declines. Professional operators place stop-loss orders exclusively at price levels where the institutional thesis is definitively proven wrong, ensuring they only exit when the “Composite Man” has clearly abandoned the campaign.
6.1. Phase C Invalidation: The Trap Failure
Executing a trade during the Spring or Upthrust After Distribution (UTAD) requires absolute precision in defensive positioning.
- The Accumulation Stop: Placement of the defensive stop must reside strictly below the extreme wick of the Phase C Spring. Violation of the Spring’s lowest point mathematically proves that institutional demand has failed to absorb the floating supply, instantly invalidating the entire accumulation hypothesis.
- The Distribution Stop: Shorting a UTAD mandates placing the stop-loss slightly above the absolute peak of the false breakout. Breaking above that high confirms a genuine markup, requiring an immediate capital exit.
6.2. Phase D Invalidation: Protecting the Markup Preparation
Entering the market during a Last Point of Support (LPS) or Last Point of Supply (LPSY) offers higher confirmation but requires a distinctly different defensive posture.
- The Creek Defense (LPS): Stop-loss orders for LPS long entries belong immediately below the preceding localized support or the newly conquered Phase B resistance line (often referred to as “Jumping the Creek”). Breaking back heavily below the Creek signifies a catastrophic failure of institutional demand, warning of a potential transition back into a prolonged, choppy Phase B.
- The Ice Defense (LPSY): Short entries during an LPSY require protection just above the recently broken support level (the “Ice”). Reclaiming the Ice suggests the breakdown was merely a shakeout rather than a genuine Phase D markdown.
6.3. Phase E Trailing Logic: Securing the Trend Energy
Capitalizing on the final Phase E Markup or Markdown necessitates dynamic risk adjustment to protect accumulated profits while giving the trend room to breathe.
- Structural Trailing: Practitioners utilize trailing stops based on the Law of Cause and Effect, moving protective orders below each newly established higher low (in an uptrend) or above each lower high (in a downtrend).
- Energy Exhaustion Signal: Surrendering a major structural pivot point during Phase E acts as the ultimate warning system. Breaking a prior low alerts the professional trader that the released “Effect” has likely exhausted its stored energy, signaling the imminent beginning of a new distribution cycle.
7. Wyckoff in Crypto Markets: The Modern Liquidity Proving Ground
Cryptocurrency markets represent the purest modern manifestation of Wyckoff’s original theories. Unfiltered volatility and a highly leveraged retail base create the exact psychological extremes necessary for the “Composite Man” to execute textbook accumulation and distribution campaigns.
- Unrestricted Liquidity Sweeps: Absence of traditional market circuit breakers allows institutional whales to engineer violent Phase C “Springs.” Triggering cascading liquidations in the retail derivatives market secures massive “exit liquidity” within seconds.
- On-Chain Verification: Blockchain transparency provides an unprecedented analytical advantage over legacy equities. Combining classical price action with real-time on-chain order flow allows advanced practitioners to mathematically verify institutional absorption.
- Accelerated Timeframes: Continuous 24/7 trading environments compress traditional market cycles. Macro structures requiring years to formulate in traditional finance often unfold over mere months in digital assets, rapidly accelerating the Law of Cause and Effect.
8. Strategic Onboarding Protocol: The Beginner’s Checklist
Applying Wyckoff discipline to live markets requires a strict evaluation protocol to avoid retail psychology traps. Novice practitioners must verify the following structural checklist before deploying capital.
Step 1: Macro Context Verification
- Market Synchronization: Identify the current phase of the broader benchmark index (Accumulation, Markup, Distribution, or Markdown).
- Relative Strength Filtering: Isolate assets that maintain higher lows or resist dropping during market-wide panics.
Step 2: Boundary Isolation
- Identify Stopping Action: Pinpoint the exact locations of the Climax (SC/BC) and the Automatic reaction (AR) to establish the Phase A boundaries.
- Quantify the Cause: Measure the duration of the Phase B sideways consolidation to ensure sufficient energy exists for a viable trade.
Step 3: Liquidity Trap Confirmation
- Wait for Phase C: Refuse to place blind limit orders at support/resistance. Wait for the deliberate violation of these levels (Spring/UTAD).
- Volume Signature Verification: Confirm that the false breakout occurred with either total volume exhaustion or an immediate, high-volume rejection back into the range. “
Step 4: Capital Preservation
- Set Structural Invalidation: Place the stop-loss order strictly beyond the extreme wick of the Phase C event.
- Project Take-Profit: Target the opposite boundary of the trading range for partial profit-taking before expecting a macro trend breakout.
9. Frequently Asked Questions (FAQs)
10. Conclusion: Mastering Institutional Logic
Navigating modern financial markets demands more than surface-level pattern recognition. The Wyckoff Methodology endures as the ultimate analytical framework precisely because it forces practitioners to view the market through the lens of institutional liquidity, supply, and demand.
Transitioning from a reactive retail trader to a proactive market operator requires abandoning the search for “holy grail” indicators. Embracing the concepts of the “Composite Man,” waiting patiently for structural validation at Phase C, and strictly managing risk through invalidation points will permanently elevate your trading edge.
To continue building your institutional analytical skills, explore our advanced guides in the Trading Strategies & Risk Management category on Piprider.
Infographic Section
-

Wyckoff Methodology Phases -
Wyckoff methodology: Three core laws