

The ABCD harmonic pattern is the fundamental building block of many harmonic formations. It is a widely used technical tool based on Fibonacci ratios and market symmetry. When properly identified, this price pattern provides a structured framework for defining potential entry and exit zones. Mastering this structure is valuable for trading ABCD pattern strategies across forex, crypto, and stocks.
This guide explains the core principles of the ABCD pattern, details how its legs (AB, BC, CD) shape the trade, and provides practical strategies. Importantly, while it is a powerful structural tool, it works best when its strict ratios are met and combined with clear price action confirmation.
Key Takeaways
- The ABCD harmonic pattern is the most basic structure, defined by symmetry where the AB leg must equal the CD leg.
- Confirmed by strict Fibonacci ratios: BC retraces AB, and CD projects from those retracements.
- Trade execution occurs only at point D (the Potential Reversal Zone), signaling the sharp reversal.
- Accuracy is boosted when point D is validated by RSI divergence or major support/resistance levels.
- Anticipate potential reversals at point D, but always wait for price action confirmation before executing trades to manage risk effectively.
1. What Is the ABCD Harmonic Pattern?
The ABCD harmonic pattern is a specific price pattern consisting of three consecutive, symmetrical price swings (Definedge Securities, n.d.).
It signals a potential trend reversal after the completion of the final swing, offering traders a defined area to look for entry opportunities.
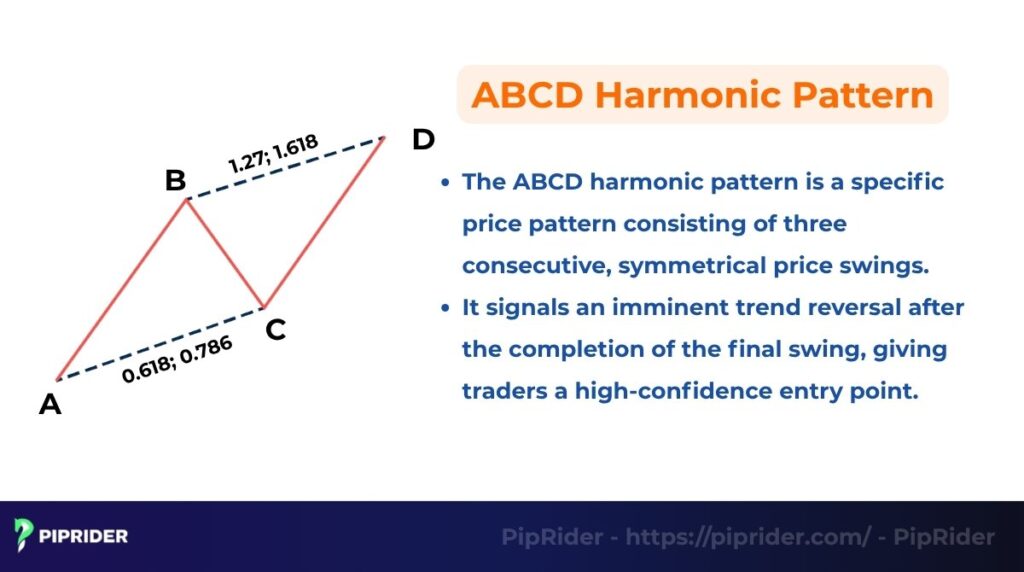
It’s composed of three segments: two impulse “legs” (AB and CD) and one correctional “retracement” leg (BC). The legs AB and CD tend to be approximately the same size, aiming for symmetry (FXOpen UK, n.d.).
Other harmonic patterns (like the Gartley, Bat, or Butterfly patterns) are fundamentally derived from the principles of the ABCD pattern. Its core principle is market symmetry, governed by Fibonacci ratios, making it the essential foundation for complex harmonic analysis.
Recognizing the ABCD pattern is vital because it establishes a Potential Reversal Zone (PRZ) at point D. This clarity helps minimize subjective interpretation, allowing traders to set clear and calculated risk parameters for trading the ABCD pattern, a significant advantage in technical analysis.
2. How the ABCD Pattern Forms
The formation of the ABCD harmonic pattern relies heavily on symmetry and specific Fibonacci ratios. Understanding the geometric relationship between the four pivot points (A-B-C-D) is essential for trading this setup effectively.
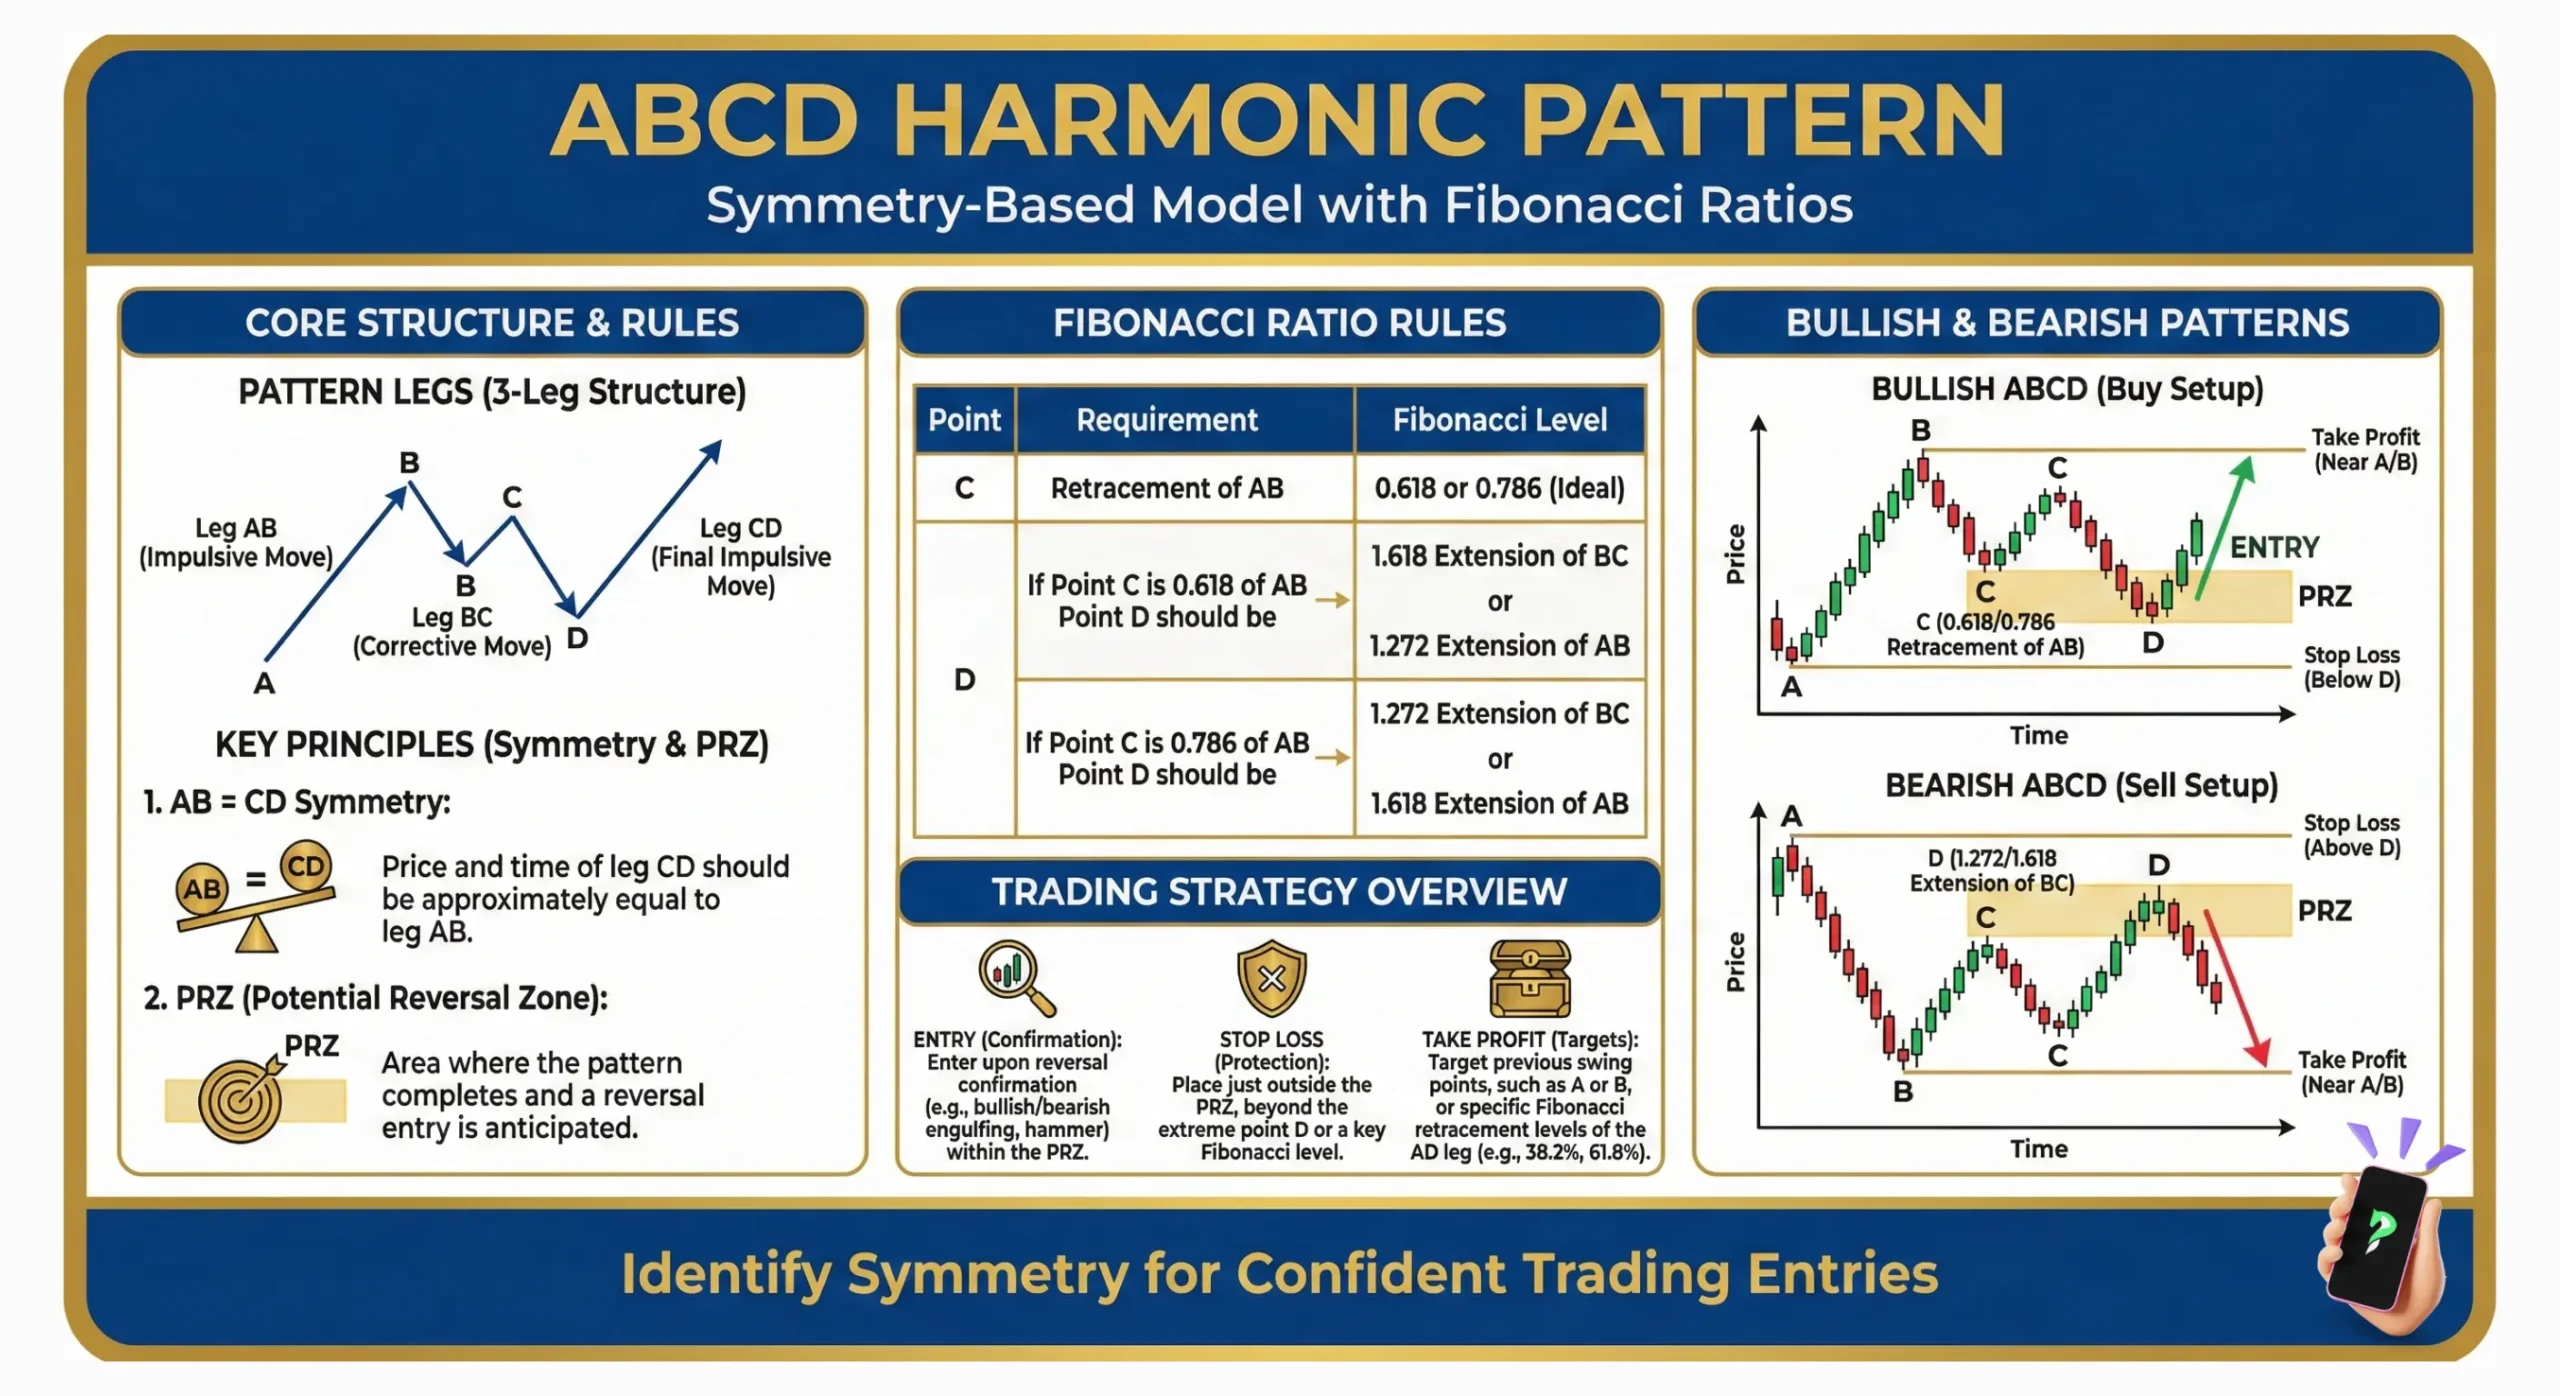
2.1. Structure with Points A–B–C–D
The ABCD pattern is built from three distinct, alternating price swings:
- Leg AB (The Initial Impulse): This move establishes the initial trend direction, whether bullish (move up) or bearish (move down).
- Leg BC (The Retracement): The correction phase moves against the direction of Leg AB. Point C is the first critical validation point, determined by a Fibonacci retracement of the AB leg.
- Leg CD (The Final Impulse): The final, price-action move completes the pattern. It moves in the same direction as AB and leads to Point D, the target Potential Reversal Zone (PRZ) where the trade is executed.
2.2. Fibonacci Ratios for Validation
The integrity of the ABCD harmonic pattern relies entirely on the precise alignment of Fibonacci ratios. Failure to meet these internal rules invalidates the setup, regardless of how the pattern “looks” visually.
| Relationship | Ratio Requirement | Purpose |
|---|---|---|
| BC Retracement of AB | Classic: 0.618 – 0.786 Wider Practice: 0.382 – 0.886 |
Validates that Point C is a healthy correction, not the start of a new trend. |
| CD Projection | Classic: BC extension of 1.272 or 1.618 Wider Practice: BC extension from 1.13 to 2.618 |
Converges with the AB=CD symmetry to establish the exact location of Point D (PRZ). |
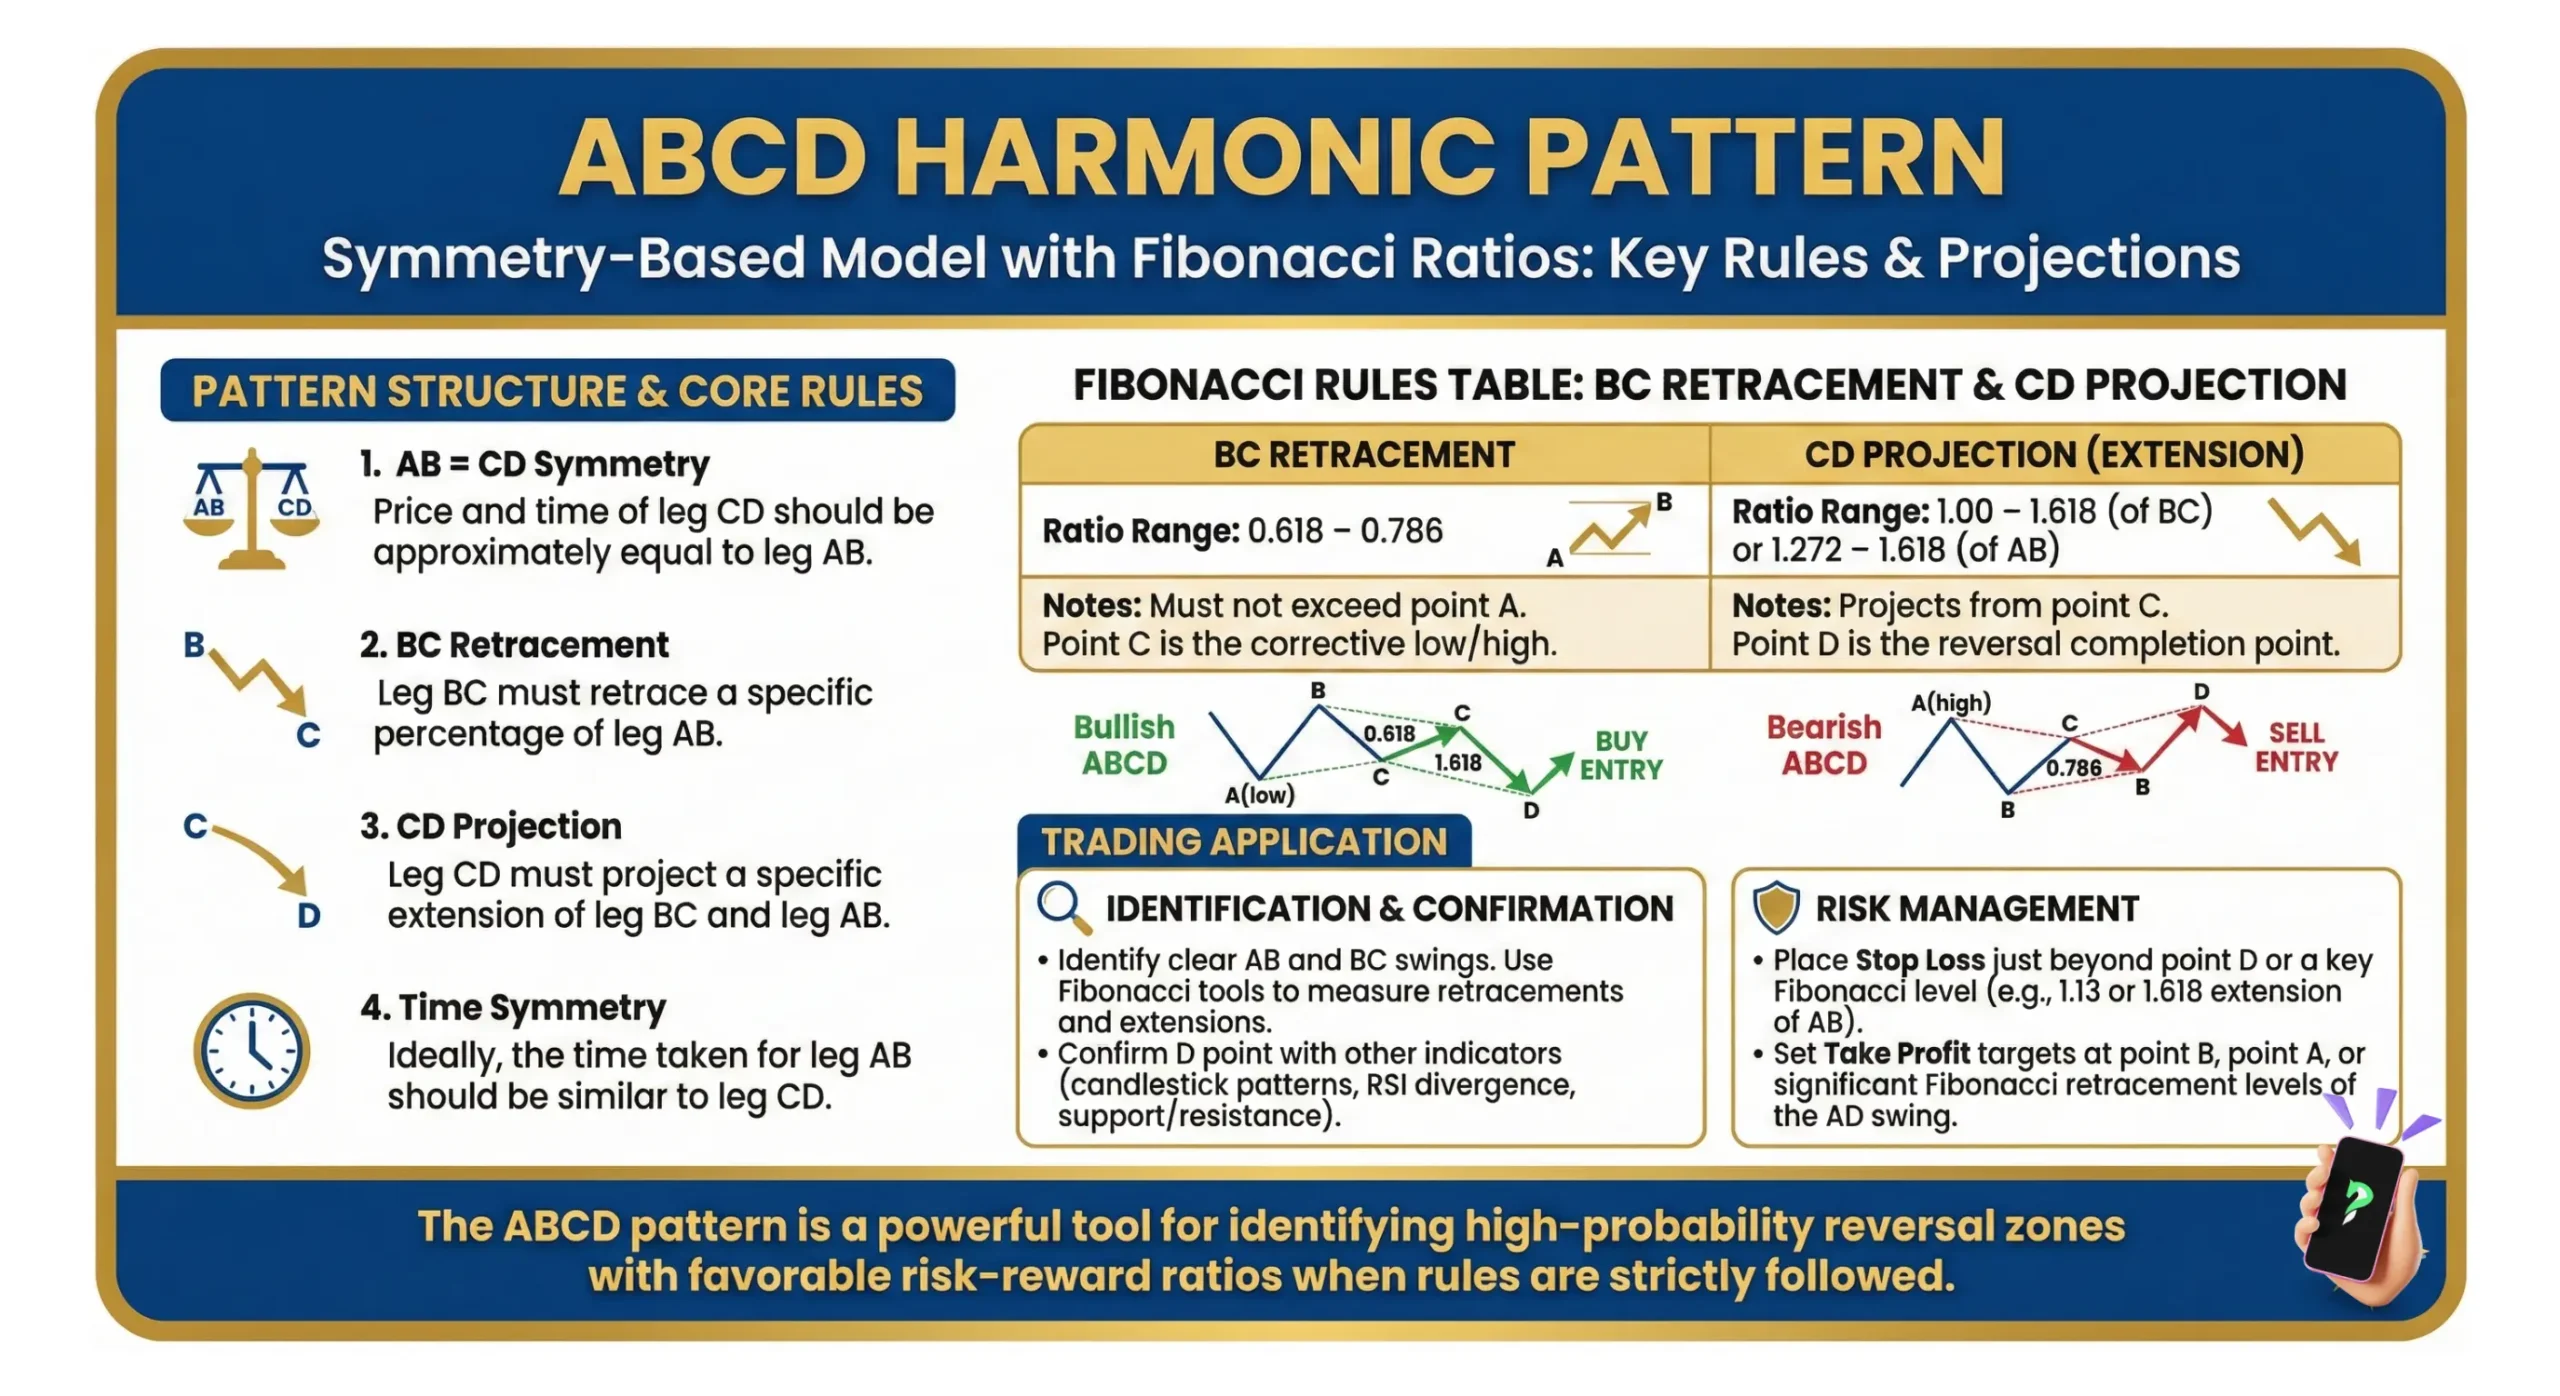
| Price Symmetry | The price length of Leg AB must be equal (1.00) to the price length of Leg CD. | This is the hallmark of the ABCD pattern, confirming symmetrical momentum. |
2.3. Time Symmetry (AB ≈ CD in Duration)
Advanced traders look beyond just price for confirmation, incorporating time analysis. True symmetry is achieved when the time it takes for price to move from A to B is approximately equal to the time it takes for price to move from C to D (AB in time ≈ CD in time). This time alignment further boosts the validity of Point D as a significant reversal zone.
Pro Tip: Time symmetry is considered an optional, advanced confirmation. Because perfect market symmetry is rare, traders should always prioritize price and Fibonacci ratio confluence first before worrying about exact time duration.
3. ABCD Pattern Rules
The ABCD harmonic pattern is traditionally defined by a set of specific Fibonacci ratios. To increase the reliability of a setup, traders look to confirm that the pattern aligns with these geometric guidelines (Investopedia, 2024).
3.1. Minimum and Maximum Retracement Levels
The structural integrity of the ABCD pattern starts with Leg BC, which must meet specific retracement requirements relative to Leg AB. Instead of a single rigid rule, professional traders categorize this into two tiers (Harmonic Trader, n.d.):
- Classic/Strict ABCD: Leg BC retraces Leg AB strictly between the 0.618 and 0.786 Fibonacci levels. This is the textbook ideal for high-symmetry setups.
- Valid/Wider (Market Practice): In real-world market conditions, a valid BC retracement can range anywhere from 0.382 to 0.886.
- Invalidation: If Point C exceeds the price of Point A (retracing more than 1.00), the pattern is completely invalidated.
3.2. Extension Ratios for CD Leg
The final leg, CD, is projected using Fibonacci extension tools to pinpoint the Potential Reversal Zone (PRZ) at Point D.
- Symmetry Rule (AB = CD): The core foundation requires the price distance of Leg CD to equal 1.00 times the distance of Leg AB.
- The Reciprocal Rule (Classic Projection): In strict harmonic theory, the CD extension is directly paired with the BC retracement. For the most reliable signals:
- A shallow 0.618 BC retracement typically results in a deep 1.618 BC extension.
- A deeper 0.786 BC retracement usually results in a shorter 1.272 BC extension.
- Wider Variations: Depending on the depth of the BC retracement in broader market practice, valid BC extensions can range from 1.13 up to 2.618 to form the PRZ.
- PRZ Strength: The tighter the convergence between the AB=CD completion point and the BC extension, the stronger the anticipated reversal area.
Mini-box: The 3 Primary ABCD Variations
While the standard 1.00 symmetry is the foundation, financial markets frequently produce extended variations during strong trends. Recognizing these is crucial for accurately identifying the PRZ:
- Equal AB=CD (1.00): The classic textbook structure. The price distance of Leg CD is exactly 100% of Leg AB.
- 1.272 Extended AB=CD: A very common variation in strong trends. Leg CD extends to 1.272 times the length of Leg AB.
- 1.618 Extended AB=CD: A deeper, more extreme extension, often marking a point of severe price exhaustion.
The Convergence Rule: A Potential Reversal Zone (PRZ) is structurally strong only when the AB=CD completion point (whether Equal or Extended) tightly coincides with a specific BC Extension (e.g., 1.272, 1.618, or 2.618). If these two measurements do not overlap, the PRZ is considered weak.
3.3. Entry and Exit Confirmation Signals
Never trade the PRZ at Point D in isolation. Confirmation is vital to filter out false signals and manage risk.
- Momentum/Divergence: Look for RSI or MACD divergence at Point D. This confirms seller/buyer exhaustion and strengthens the reversal thesis.
- Price Action: Wait for a clear reversal candlestick pattern (e.g., Engulfing pattern or Pin Bar) to form at Point D, confirming aggressive counter-directional entry.
- Volume/Activity: In the Spot FX market, volume is typically tick volume (a proxy for activity) rather than actual traded contracts. Use a surge in tick volume or a volatility expansion (ATR) at Point D as confirmation of strong market participation, but prioritize price confirmation (candle close) and S/R confluence (OANDA, n.d.).
4. Bullish ABCD Pattern
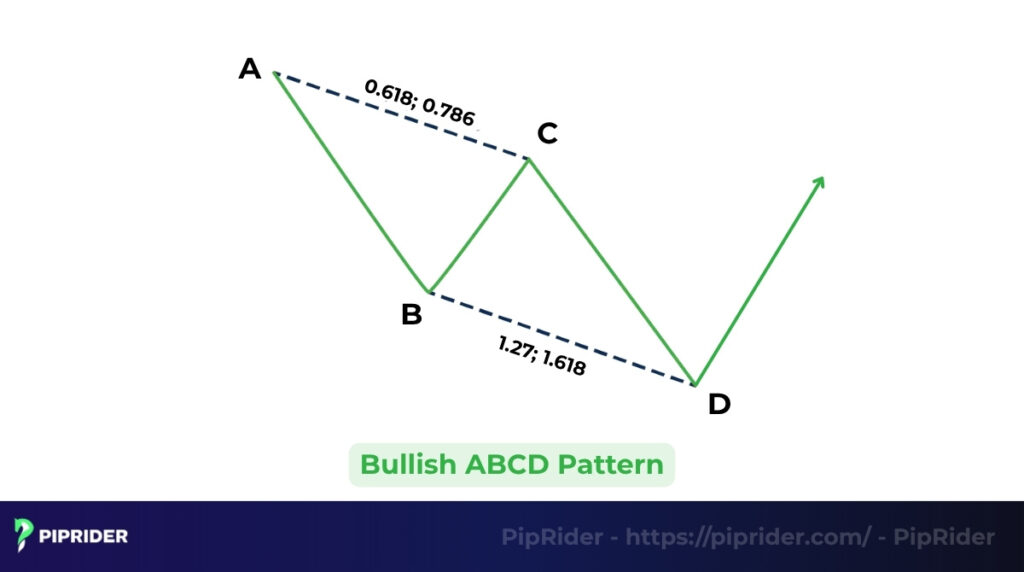
This pattern signals a strong potential reversal from a downtrend to an uptrend, providing a low-risk opportunity to initiate a Long (Buy) position at Point D.
The Bullish setup is completed by a price move that moves downward overall, but finishes its symmetrical structure at a low point (D). Traders prepare to Buy (Go Long) at Point D (the PRZ), anticipating a sharp reversal upward.
The setup is valid only if Point C retraces AB between 0.618 and 0.786. The Long entry is executed where the final leg CD converges with the 1.00 extension of AB (classic symmetry) and the 1.272 or 1.618 extension of BC.
Trading Example (USD/JPY): If a forex pair drops 100 pips (A to B) and retraces upward to the 0.618 level (Point C), the trader projects the final 100-pip drop to identify Point D.
Pro Note: Mathematically, this 100-pip CD leg perfectly aligns with the 1.618 extension of the BC leg (61.8 pips x 1.618), confirming the Reciprocal Rule. Once a reversal candlestick pattern confirms the PRZ at D, the Long position is executed.
5. Bearish ABCD Pattern
This pattern signals a potential reversal from an uptrend to a downtrend, providing a structured opportunity to initiate a Short (Sell) position at Point D.
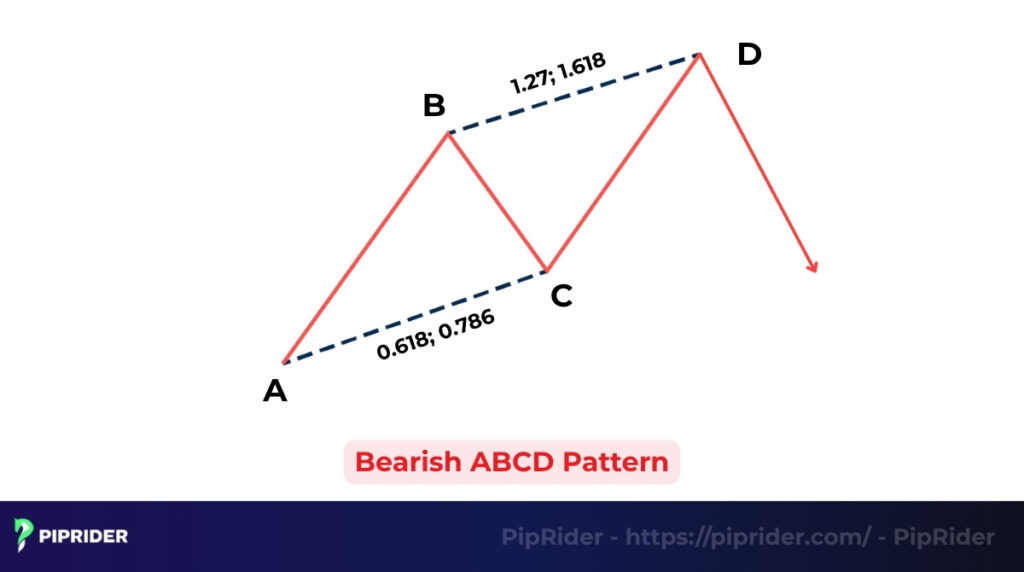
The Bearish setup is completed by a price move that moves upward overall, but finishes its symmetrical structure at a high point (D). Traders prepare to Sell (Go Short) at Point D (the PRZ), anticipating a reversal downward at a level that often coincides with major resistance.
The setup is typically validated when Point C retraces AB between 0.618 and 0.786 (Classic), or within the broader 0.382 to 0.886 range (Wider Practice). The Short entry is considered where the final leg CD converges with the 1.00 extension of AB and the corresponding extension of BC.
Trading Example (GBP/USD): If a forex pair rallies 100 pips (Leg AB) and retraces downward to the 0.786 level (Point C), the trader projects the final 100-pip rally to identify Point D.
Pro Note: Mathematically, this 100-pip CD leg perfectly aligns with the 1.272 extension of the BC leg (78.6 pips x 1.272), creating a highly precise Potential Reversal Zone (PRZ). Once a reversal candlestick pattern (e.g., a Shooting Star) confirms this PRZ, the Short position is executed.
6. Example of ABCD Pattern on a Chart
This is a practical, step-by-step walkthrough of identifying and trading a validated ABCD harmonic pattern (suitable for forex, crypto, or stocks).
Step-by-Step Walkthrough (Setup):
- Identify AB & Validate C: On a USD/JPY (Forex) chart, the price drops from A (145.00) to B (144.00) (Leg AB = 100 pips). The price then corrects upward to C (144.382). Point C is valid as it’s a 0.618 retracement of AB (Chen, 2024).
- Confirm D (PRZ): Use the Fibonacci Extension tool. Point D is projected at the 1.00 extension of AB from C, resulting in a target price of 143.382. This tight zone is the PRZ.
Trading Outcome (Scenario):
- Execution: Price hits the PRZ at Point D (143.382). The trader observes strong RSI divergence (momentum confirmation) and a large Hammer candlestick pattern forms. A Long (Buy) position is executed once the hammer closes, supported by a notable spike in tick volume (activity), validating the reversal zone.
- Risk: The Stop Loss is placed tightly just below the hammer’s low, at 143.300.
- Result: The price reverses sharply from Point D, climbing back toward Point C (Take Profit 1) and Point A (Take Profit 2), validating the pattern symmetry and resulting in a high-probability trade.
7. Trading with the ABCD Pattern
Successful execution of the ABCD harmonic pattern requires discipline at the Potential Reversal Zone (PRZ), Point D. By defining quantitative rules for entry, stop-loss, and profit targets, traders can convert the pattern’s geometric structure into a calculated trading plan.
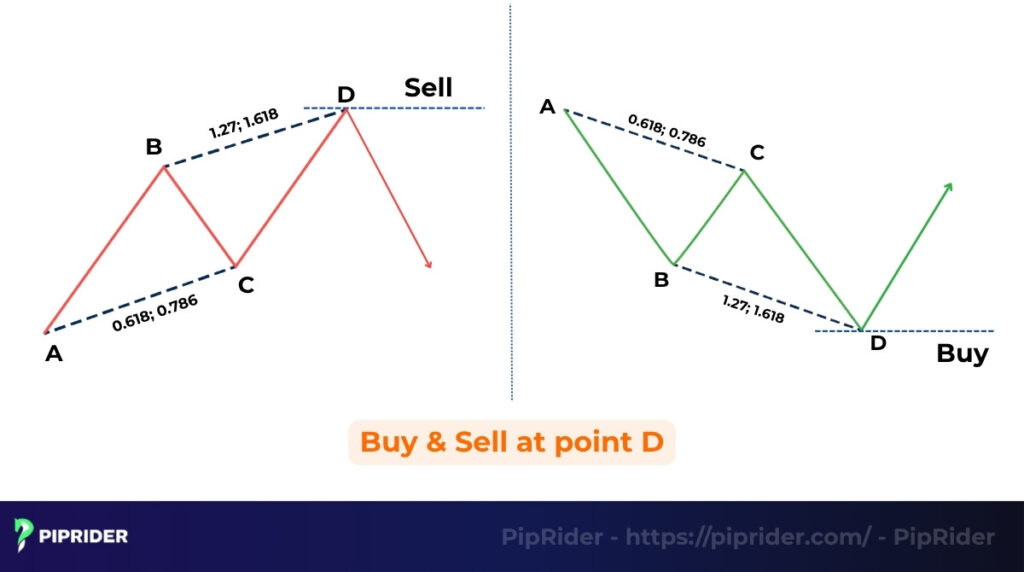
7.1. Entry Rules at Point D
Effective entry management is crucial. Rather than a rigid “one-size-fits-all” approach, professional traders generally choose between two entry modes based on market context and risk appetite:
- Conservative Entry (Confirmation-Based): Wait for the price to hit Point D and form a definitive reversal candlestick pattern (e.g., Bullish Engulfing or Pin Bar). Execute the trade only after the candle closes and the price breaks its high/low. This sacrifices some risk-reward for higher certainty.
- Advanced Entry (Limit Order at PRZ): Place a limit order directly at the projected Point D. This approach offers the best entry price but carries a higher risk of the CD leg overextending. Pro Rule: Only use this method if Point D perfectly aligns with strong confluence (like a major daily support level), and strictly use a smaller position size and a wider stop-loss.
7.2. Stop-Loss (SL) Placement: The Quantitative Buffer
Placing a stop-loss “just below/above” Point D is too vague and often leads to premature stop-outs due to market noise or spread widening, especially in Forex. Instead, use a structured buffer:
- The Placement Rule: Place the SL beyond the extreme of Point D, plus a calculated volatility buffer.
- The Formula:
SL = Point D Extreme + Max(Spread × 2, 0.2 to 0.3 ATR) - The Invalidation Rule: The stop-loss is your hard line. If a full candlestick closes significantly beyond the PRZ/Point D, the geometric structure of the harmonic pattern has officially failed. The setup is invalidated, and the loss must be accepted.
7.3. Take-Profit Targets: The Scale-Out Strategy
Setting logical Take-Profit (TP) targets is essential for locking in profits and managing the position dynamically. Harmonic traders frequently use a “scale-out” approach:
- TP 0.5 (Risk Reduction Target): Target the 38.2% or 61.8% Fibonacci retracement of the CD leg (Harmonic Trader, n.d.). This is a crucial intermediate step. Once price hits this level, take partial profits and move your Stop-Loss to break-even to ensure a risk-free trade.
- TP 1 (Primary Target): Set the next target at the level of Point C. Price often quickly revisits this prior correction level, making it a high-probability objective.
- TP 2 (Extended Target): For the remaining position, target the level of Point A or a Fibonacci extension (1.272 or 1.618) of the CD leg to capture the full trend reversal.
7.4. Evaluating the Risk-to-Reward (R:R) Ratio
Because the ABCD pattern provides highly specific invalidation points, it naturally supports a structured risk management profile.
- Favorable Asymmetry: By placing a tight, mathematically calculated Stop-Loss just beyond Point D and targeting structural levels like Point C or Fibonacci extensions, the setup often yields a favorable Risk-to-Reward Ratio (RRR), typically aiming for 1:2 or higher.
- The Professional Edge: It is this asymmetric risk profile, risking a small, defined amount to potentially capture a larger trend reversal, rather than a guarantee of a “winning trade,” that makes the ABCD harmonic pattern a staple methodology for professional traders.
8. Advantages and Limitations of the ABCD Pattern
Understanding the strengths and weaknesses of the ABCD pattern is essential for effective risk management in harmonic trading. The decision to execute a trade must weigh its predictive clarity against its inherent risks.
8.1. Advantages (Strengths)
The ABCD pattern is highly valued by traders as the foundation of harmonic analysis due to its mechanical clarity and superior risk management characteristics:
- Objective rules: Defined by strict Fibonacci ratios (0.618, 1.00), offering clear and objective rules and minimizing subjective interpretation.
- Ease of use: The symmetrical AB=CD structure is simple to spot, making it easy to learn and identify for new harmonic traders.
- Universal application: Based on universal market symmetry, the pattern works across all markets (forex, stocks, crypto) and time frames.
- Superior Risk/Reward: Allows for an extremely tight Stop Loss placement at Point D, creating a highly favorable Risk/Reward Profile.
8.2. Limitations (Weaknesses)
Despite its clarity, the strict geometric requirements of the pattern introduce certain limitations that traders must actively manage:
- Rarity: The perfect alignment of all required time and price Fibonacci ratios means the ideal ABCD pattern can be rare.
- False signals: The pattern is prone to false signals if traders ignore confirmation. Entry at Point D without supporting evidence (like RSI divergence or a reversal candlestick pattern) leads to high failure rates.
- Discipline required: Requires high patience to wait for the full completion of the CD leg and the final reversal confirmation before trading.
9. Common Mistakes When Trading the ABCD Pattern
While the ABCD harmonic pattern provides a structured framework, human error and poor execution are the biggest threats to profitability. Traders must actively avoid these common practical pitfalls (Harmonic Trader, n.d.):
- Entering too early (Front-running Point D): Anticipating the move and entering before the CD leg fully completes is a fatal error. Entering a trade before a definitive reversal candlestick pattern forms at the Potential Reversal Zone (PRZ) inevitably leads to being stopped out if the final leg extends further than expected.
- Ignoring Fibonacci ratio alignment: Blindly identifying four swing points (A-B-C-D) without verifying the geometric structure is a trap. The pattern is invalid if the BC leg does not meet the necessary retracement rules, or if the AB=CD completion lacks tight convergence with a BC extension.
- Overtrading in sideways markets: The ABCD pattern is a reversal signal that performs best when it forms after a clear, sustained directional move. Attempting to trade the pattern during prolonged, choppy consolidation often generates market noise and unreliable signals.
- Blindly trusting automated indicators: Relying solely on auto-drawing harmonic tools or ZigZag indicators without manual verification is dangerous. These tools often “repaint” as live price action unfolds or select incorrect minor pivot points. Always manually verify the structural logic and the major swing highs/lows.
- Placing the Stop-Loss too tight (Ignoring slippage): Setting a Stop-Loss at the exact price of Point D fails to account for market noise, slippage, and spread widening (especially crucial in Forex and Crypto). A calculated buffer (e.g., Spread × 2 + a fraction of ATR) is essential to survive typical stop-hunts.
- Counter-trend trading without HTF confluence: Trading an ABCD pattern directly against a strong Higher Timeframe (HTF) trend is highly risky. If you are taking a counter-trend setup, Point D must perfectly align with a major HTF support/resistance level and show clear momentum exhaustion (like RSI divergence) to be valid.
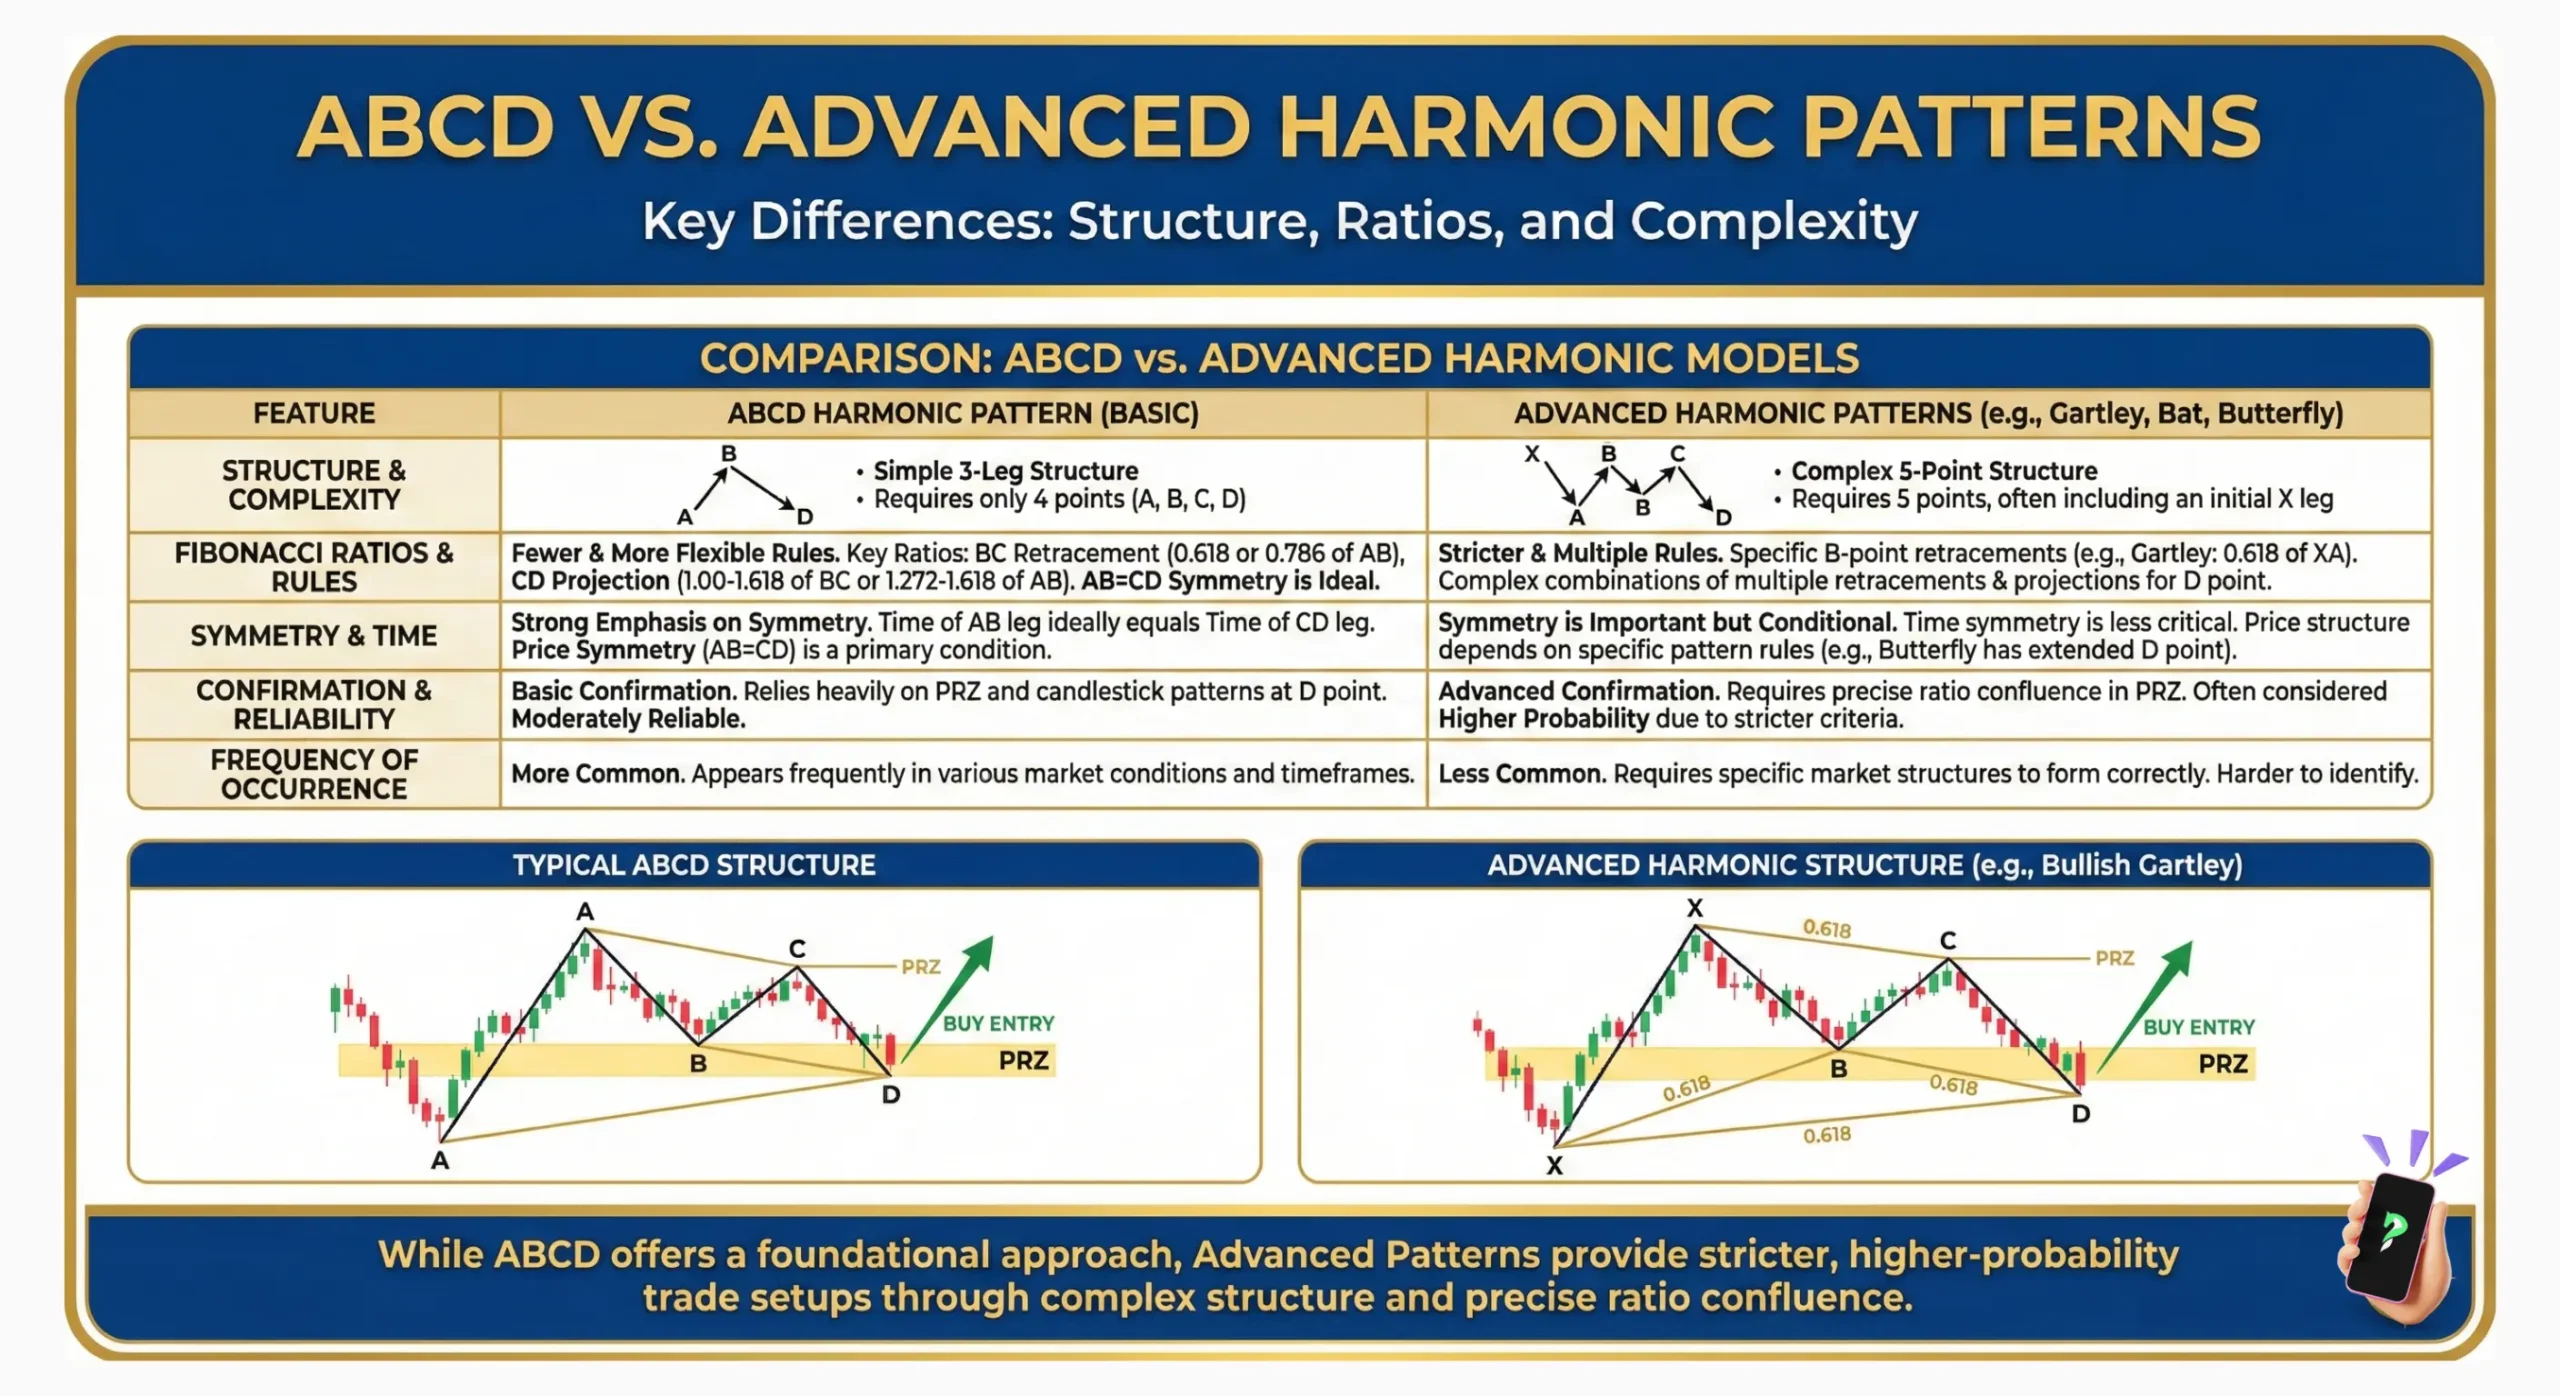
10. ABCD Pattern vs Other Harmonic Patterns
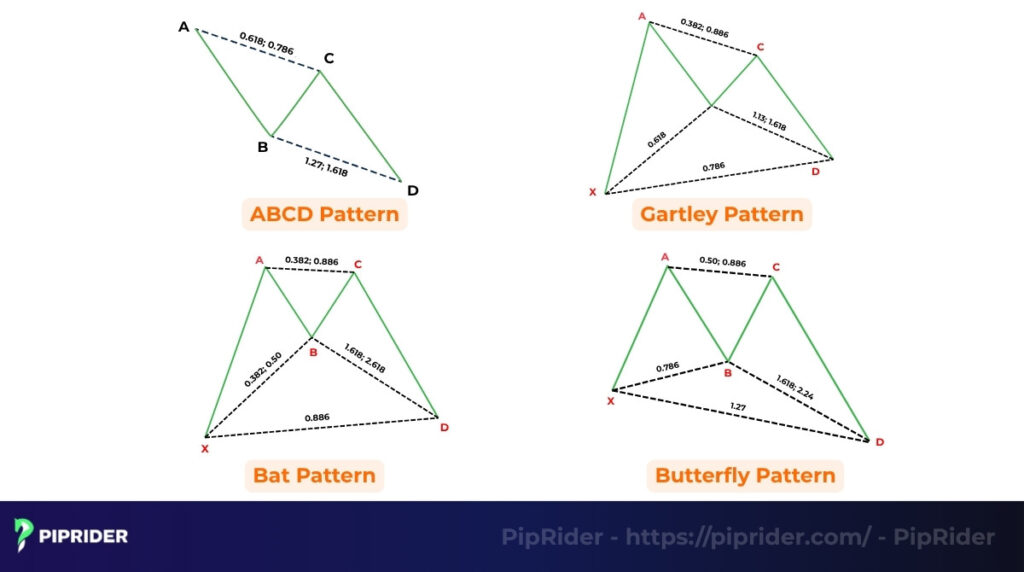
While the ABCD Pattern is the foundation, the Gartley, Bat, and Butterfly patterns all expand this concept by adding an initial leg (XA leg) and imposing stricter Fibonacci ratios (Definedge Securities, n.d.).
| Feature | ABCD Pattern (Foundation) | Gartley Pattern | Bat & Butterfly Patterns |
|---|---|---|---|
| Number of Points | 4 points: A-B-C-D | 5 points: X-A-B-C-D | 5 points: X-A-B-C-D |
| Core Relationship | AB wave must equal CD wave. | The ABCD wave must be integrated within the larger XA wave. | Similar to Gartley, but utilizing shallower (Bat) or deeper (Butterfly) extension/retracement ratios. |
| B Ratio (of XA) | Not applicable (No XA leg) | Point B must be a 0.618 retracement of XA. | Bat: B < 0.618 (typically 0.382 or 0.50). Butterfly: B < 0.786. |
| D Ratio (PRZ) | Point D is determined by AB=CD and the 1.272/1.618 extension of BC. | Point D must be a 0.786 retracement of XA. | Bat: D is 0.886 retracement of XA. Butterfly: D is 1.272 or 1.618 extension of XA. |
| Complexity | Easiest to identify and trade; based only on symmetry. | More complex, requiring two sets of Fibonacci rules to converge at D simultaneously. | Most complex, usually signaling reversals at extreme zones (Bat close to X, Butterfly beyond X). |
11. Frequently asked questions about ABCD Harmonic Pattern
12. Conclusion
The ABCD harmonic pattern is the fundamental framework for all advanced harmonic trading. Its power lies in its geometric symmetry and strict Fibonacci ratios (Investopedia, 2024).
The success of the ABCD pattern is intrinsically linked to Fibonacci ratios. These precise ratios (0.618, 0.786, 1.00) convert a visual guess into a mathematical probability. Strict adherence to these levels ensures you are trading high-quality structures, filtering out noise.
Once you’ve mastered the foundational ABCD pattern and its entry rules, advance your expertise by exploring its derivatives: the Gartley, Bat, and Butterfly patterns. These structures embed the core AB=CD principle within a larger context, offering even higher-probability setups for experienced traders.
Ready to find your next setup? Explore more high-probability trading strategies at Piprider’s comprehensive Analysis section today!
Infographic Section
-
ABCD Harmonic Pattern -
ABCD vs. Advanced Harmonic Patterns -
Symmetry-Based Model with Fibonacci Ratios


