
Have you ever jumped into a trade only to watch it stall in a flat market? I’ve been there too, and that’s precisely why the tool I trust to gauge trend strength is the ADX indicator Average Directional Index. Understanding this powerful indicator helps forex traders spot strong trends and avoid choppy markets, ultimately saving time and reducing risk.
In this guide, we’ll explore how the Average Directional Index ADX indicator works, why it’s a must-have for traders, and how to use it effectively in your forex strategies. Whether you’re trading EUR/USD or eyeing a breakout, this article will give you practical tips to trade smarter. Ready to dive in? Let’s get started with what makes ADX so special.
Key Takeaways
- Understand ADX: The Average Directional Index ADX Indicator measures trend strength, not direction, helping you focus on powerful market moves.
- Learn its mechanics: Discover how ADX uses +DMI and -DMI to signal trend strength and direction for better trading decisions.
- Apply trading strategies: Use ADX for breakout confirmation, trend continuation, and timely exits to boost your forex trading success.
- Optimize settings: Find the best ADX settings for scalping or swing trading, tailored to platforms like MT4 and TradingView.
- Avoid common mistakes: Steer clear of pitfalls like trading in flat markets or misreading high ADX values to trade smarter.
1. What is the Average Directional Index (ADX)?
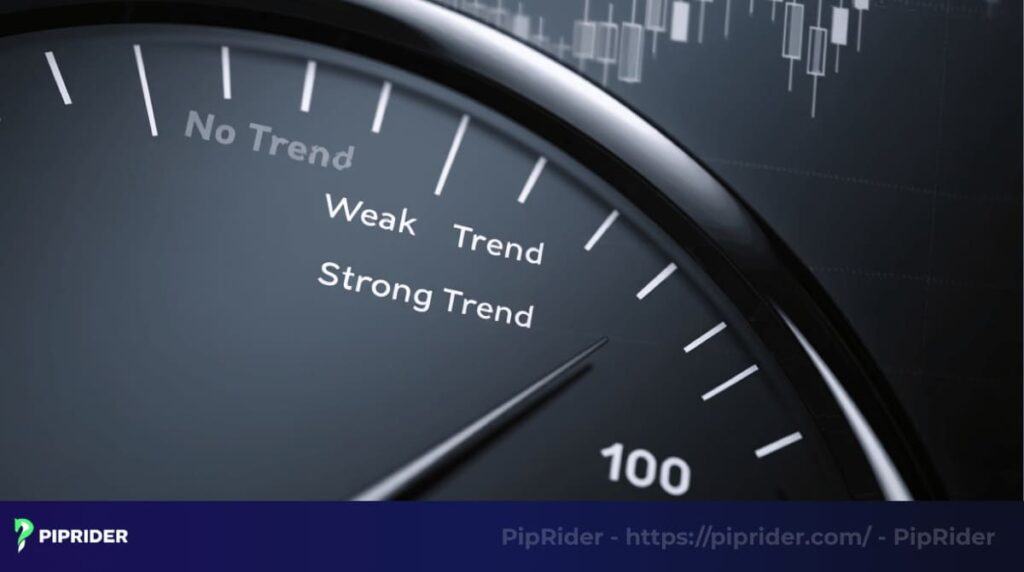
The Average Directional Index ADX Indicator, developed by J. Welles Wilder, shows trend strength on a scale from 0 to 100. It doesn’t tell you if prices are going up or down, just how powerful the move is. This helps you decide if a trend is worth trading or if the market is stuck in a range.
- Values below 20 suggest a weak or sideways market, often a no-trade zone.
- Readings between 20 and 40 signal a strengthening trend, ideal for trend-following strategies.
- Above 40 indicates a very strong trend, though values over 50 are rare and may hint at exhaustion.
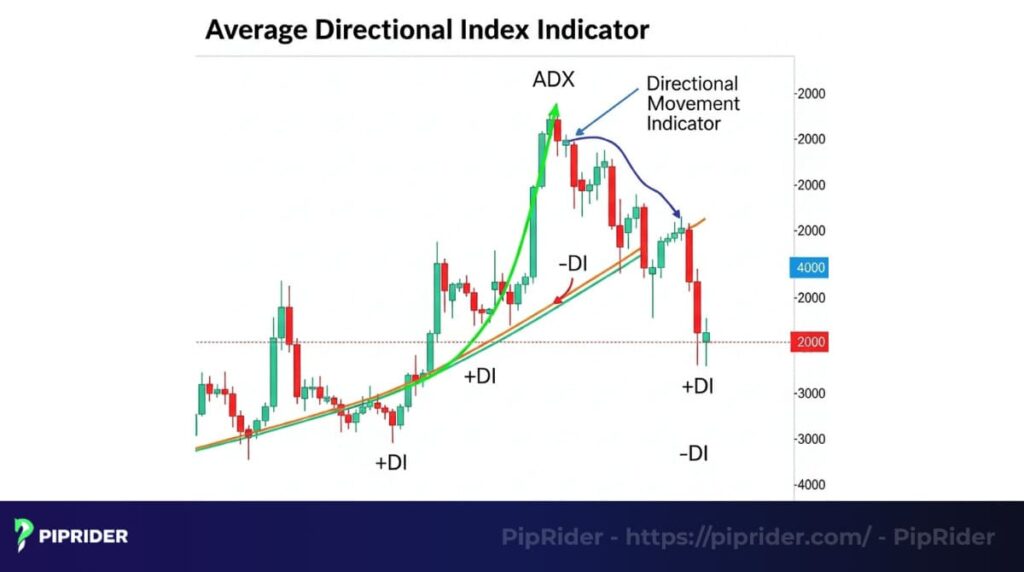
1.1. Components of ADX
The ADX works alongside two other lines: +DMI (Positive Directional Indicator) and -DMI (Negative Directional Indicator). These lines show the direction of the trend. For example, when +DMI is above -DMI, it points to an uptrend; if -DMI is higher, it’s a downtrend.
- I’ve noticed that watching these DMI lines helps clarify whether a trend is worth jumping into.
- The ADX line itself is plotted in the same chart window, often on platforms like TradingView or MT4.
- Together, they give a clear picture of both strength and direction.
1.2. Why ADX matters
So, what makes it different? Unlike other indicators, the ADX Indicator Average Directional Index focuses purely on trend strength, which makes it incredibly versatile for forex, stocks, or even gold. Think of it as a speedometer for market moves, helping you steer clear of time-wasting flat periods.
I’ve found it especially useful for spotting breakout opportunities, like when EUR/CHF surged 400 pips after ADX hit 50.
2. How does the ADX Indicator work?
Knowing how the ADX Indicator Average Directional Index works can feel like unlocking a secret to smarter trading. I’ve spent hours tweaking it on my charts, and it’s helped me understand when a market is ready to move big. Let’s dive into the mechanics behind this tool and how it signals trend strength.
2.1. The calculation behind ADX
To measure how strong a trend is, the Average Directional Index ADX indicator uses a series of complex calculation steps. It essentially starts by comparing price highs and lows over a period, typically 14 days.
This entire process, while it looks complex, boils down to tracking the intensity of price movement.
- Step 1: Calculate +DM (difference between current and previous highs) and -DM (difference between previous and current lows).
- Step 2: Find the True Range (TR), which accounts for price gaps and volatility, using the largest of current high-low, high-previous close, or low-previous close.
- Step 3: Smooth +DM and -DM to get +DI and -DI, then compute DX by comparing their difference to their sum.
- Step 4: Smooth DX over 14 periods to get the ADX value, often using a Wilder Moving Average.
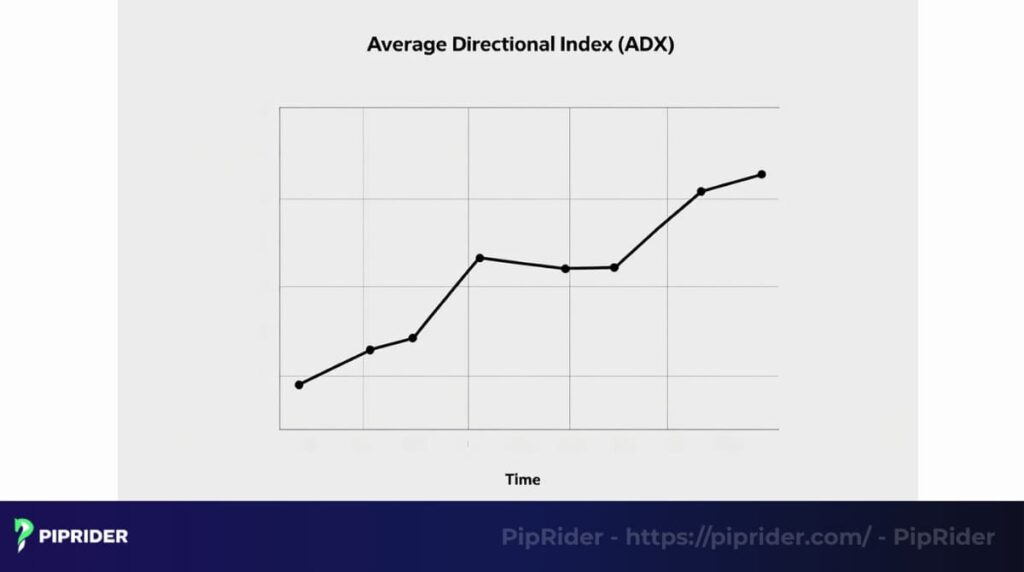
2.2. Reading ADX signals
The ADX line ranges from 0 to 100, showing trend strength without picking a direction. When you see the ADX line rising, it means the trend is gaining strength. Conversely, when it starts to fall, that’s a sign that momentum is weakening.
I’ve found that watching these shifts helps me time my trades better.
- Below 20, the market is usually flat, like a calm sea with no waves to ride.
- Between 20 and 40, a trend is forming, signaling it’s time to pay attention.
- Above 40, the trend is strong, but watch out values over 50 can hint at a slowdown.
2.3. The role of DMI lines
The +DMI and -DMI lines work hand-in-hand with ADX to show trend direction. When +DMI crosses above -DMI, it points to an uptrend; if -DMI is higher, it’s a downtrend. I always check these lines to confirm what the ADX is telling me.
- For example, on a GBP/USD chart, a +DMI crossover with ADX above 25 often signals a strong bullish move.
- These lines are plotted alongside ADX on platforms like MT4 or TradingView for easy reading.
- Combining ADX with DMI helps avoid jumping into trades with no clear direction.
3. Why use the ADX Indicator in forex trading?
When I started trading forex, I often got stuck in markets that went nowhere. The ADX Indicator Average Directional Index changed that by helping me focus on trends worth trading. Here’s why this tool is a must-have for any forex trader looking to make smarter moves.
3.1. Spotting strong trends
The Average Directional Index ADX Indicator shines at identifying when a market is trending strongly. Values above 25 signal a trend you can trust, while below 20 warn of a flat market.
I’ve found this helps me avoid wasting time on choppy price action.
- For instance, when ADX hit 38 on the S&P 500, it confirmed a strong downtrend.
- In forex, ADX helps you pick pairs like USD/JPY during powerful moves.
- This focus on trend strength saves you from trades with no momentum.
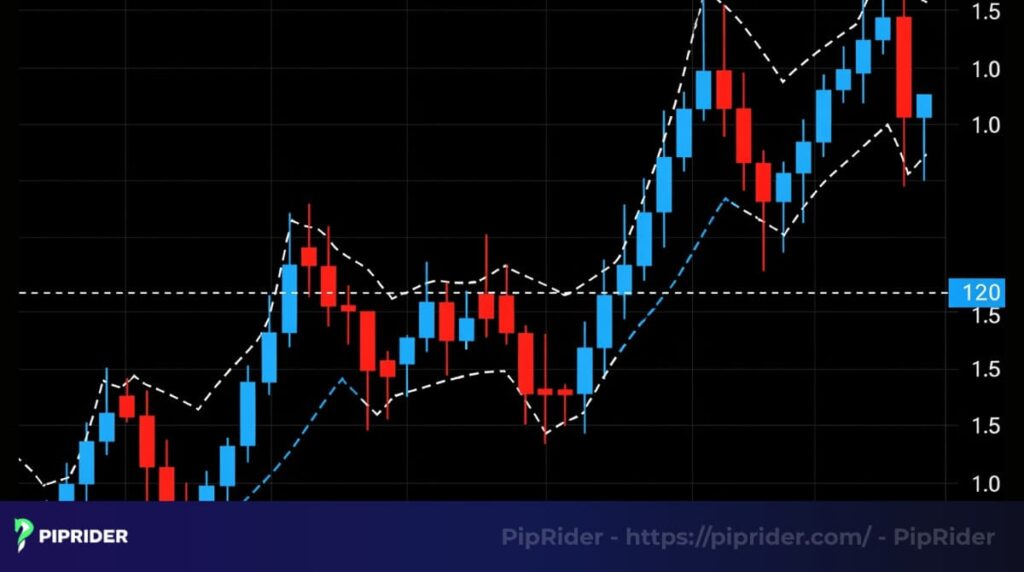
3.2. Confirming breakout trades
Breakouts can be tricky, some soar, others fizzle. The ADX Indicator Average Directional Index confirms when a breakout has real power, reducing the risk of false signals. I’ve seen it work wonders, like when EUR/CHF broke out with ADX above 50, delivering 400 pips.
- ADX rising from below 20 to above 25 validates a breakout’s strength.
- Pair it with +DMI/-DMI to know if the breakout is bullish or bearish.
- This combo helps you trade with confidence and avoid traps.
3.3. Enhancing risk management
A falling ADX signals a trend losing steam, prompting you to lock in profits. I’ve learned to watch for ADX dropping below 40 to exit trades before the market stalls. This simple trick has saved me from holding onto fading trends.
- For example, exiting a gold trade at 2650 when ADX declined worked well.
- It’s a clear signal to tighten stops or take partial profits.
- This keeps your risk in check during volatile markets.
3.4. Versatility across markets
The ADX isn’t just for forex; it works on stocks, gold, and more. Its ability to measure trend strength across assets makes it a go-to tool. I’ve used it on everything from EUR/USD to gold with consistent results.
- Platforms like TradingView offer customized ADX scripts for better visuals.
- It’s effective on any timeframe, from M15 for scalping to D1 for swing trading.
- This flexibility suits traders of all styles.
4. How to trade forex using the ADX Indicator
Trading forex can feel like chasing waves, but the ADX Indicator Average Directional Index helps you catch the big ones. I’ve used it to spot strong trends and avoid traps, and here are three practical strategies to make it work for you. Let’s explore how to use ADX to trade smarter.
4.1. Breakout confirmation strategy
Breakouts can lead to big wins or costly traps, and ADX helps you tell the difference. Wait for price to break a key level, like support or resistance, then check if ADX rises above 25.
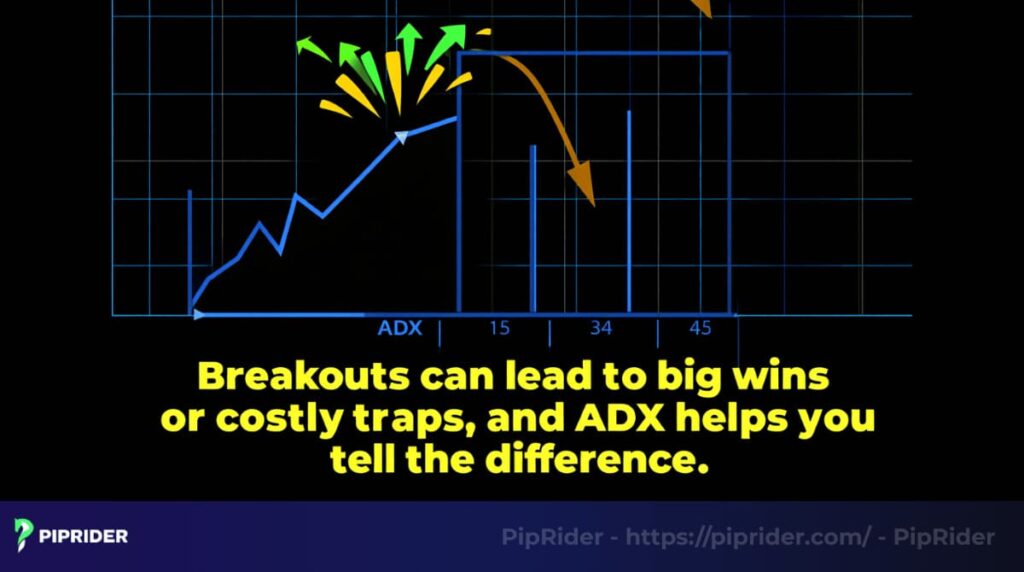
This confirms the breakout has real momentum.
- For example, EUR/CHF broke its range when ADX hit 50, delivering 400 pips.
- Look for +DMI above -DMI for a bullish breakout, or -DMI above +DMI for a bearish one.
- I’ve found this strategy works best on H4 or D1 charts for reliable signals.
4.2. Trend continuation strategy
Once a trend is rolling, the Average Directional Index ADX Indicator can help you ride it longer. Use ADX above 40 with a moving average, like EMA 50, to confirm the trend’s strength. Enter trades when price pulls back to the EMA and ADX stays high.
- On USD/JPY, I’ve seen ADX above 40 paired with EMA 50 signal strong uptrends.
- Enter a buy when +DMI is above -DMI and price touches the EMA.
- This approach keeps you in the trend while avoiding weak moves.
4.3. Exit signals for smarter trades
Knowing when to exit is just as crucial as entering. When ADX drops below 40, it signals the trend is losing steam, so consider locking in profits. I’ve used this to exit trades before the market stalls, saving me from reversals.
- For instance, exiting a gold trade at 2650 when ADX fell worked well.
- Watch for ADX flattening or dipping below 40 to tighten stops or take profits.
- Combining ADX with price action, like support levels, sharpens your exits.
5. Best settings for the ADX Indicator
Finding the right settings for the ADX Indicator Average Directional Index can make or break your trading strategy. I’ve spent hours testing different setups to see what works best for forex trading.
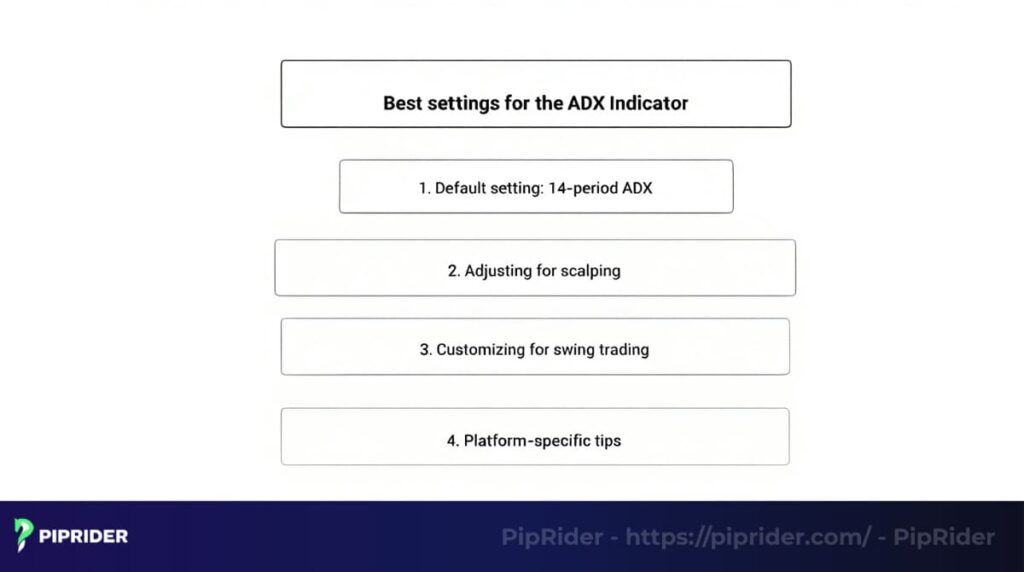
Here’s a guide to choosing the ideal settings for your style, whether you’re scalping or swing trading.
5.1. Default setting: 14-period ADX
The standard 14-period setting for the Average Directional Index ADX Indicator is a go-to for most traders. It balances responsiveness and reliability, making it ideal for daily or 4-hour charts. This setting works well across platforms like MT4 and TradingView.
- The 14-period ADX smooths out price noise, giving clear signals for trend strength.
- It’s perfect for swing traders looking for steady trends in pairs like EUR/USD.
- I’ve found it reliable for spotting breakouts, like the EUR/CHF move.
5.2. Adjusting for scalping
For fast-paced scalping on 5-minute or 15-minute charts, a shorter period, like 10, can make ADX more sensitive. This catches quick trend shifts but risks more false signals. Be cautious and pair it with other tools, like price action.
- A 10-period ADX reacts faster to short-term moves in volatile pairs like GBP/JPY.
- Use it with +DMI/-DMI to confirm trend direction on lower timeframes.
- I’ve noticed scalpers benefit from this but need to watch for market noise.
5.3. Customizing for swing trading
Swing traders typically use a 14-period setting or increase it to 20 for more refined signals. A longer period reduces false signals on higher timeframes, like daily charts. This setup suits patient traders hunting for big trends.
- A 20-period ADX works well for catching long-term trends in pairs like AUD/USD.
- TradingView’s Dynamic ADX script lets you tweak settings for better visuals.
- I’ve tested this for swing trading and found it cuts down on choppy signals.
5.4. Platform-specific tips
Different platforms offer unique ways to optimize ADX settings. On TradingView, scripts like Dema DMI reduce lag for faster signals. On MT4, you can adjust smoothing to fine-tune the indicator’s sensitivity.
- TradingView’s ADX Mura Vision script adds custom thresholds like 40 or 60.
- MT4’s default ADX is simple but effective for most forex pairs.
- Experiment on a demo account to find what fits your trading style.
6. Common mistakes to avoid when using ADX
Using the ADX Indicator Average Directional Index can boost your trading, but it’s easy to trip up if you’re not careful. I’ve stumbled into these errors before and had to learn from tough experiences.
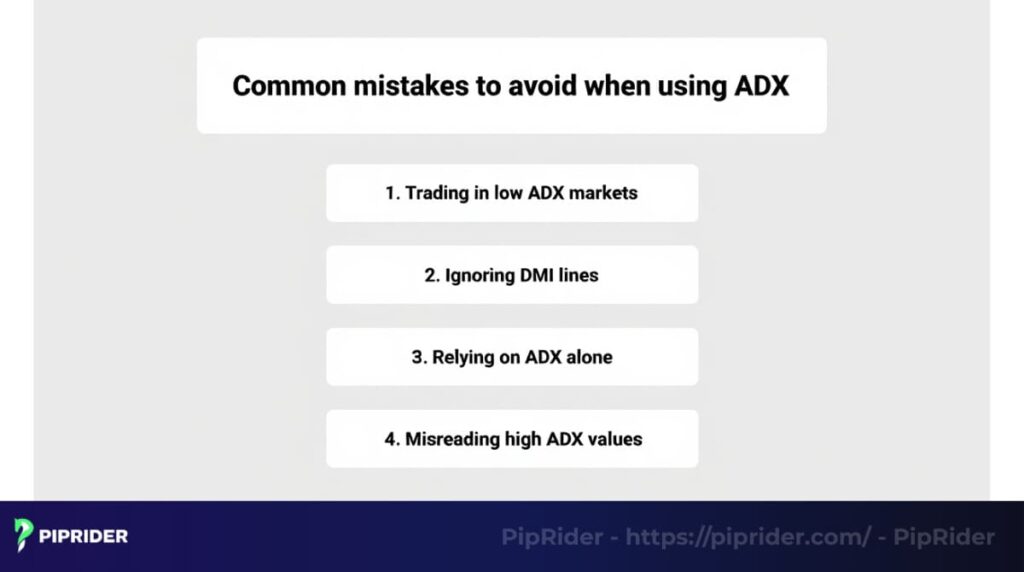
Here are four common pitfalls to steer clear of when using ADX in forex trading.
6.1. Trading in low ADX markets
Entering trades when the ADX falls below 20 often leads to disappointment. A low ADX indicates a stagnant or erratic market lacking a defined trend. I’ve seen traders lose pips chasing moves that go nowhere in these conditions.
- Hold off on trading until the ADX climbs above 25, signaling a strong trend worth pursuing.
- For instance, EUR/CHF remained stuck in a range when the ADX hovered below 20.
- Focus on other indicators, like support levels, in low ADX markets.
6.2. Ignoring DMI lines
Always remember, the ADX Indicator Average Directional Index tells you about trend strength, but not direction. Ignoring the +DMI and -DMI lines is a classic mistake; it’s like driving a fast car without a map. I learned the hard way to always check these lines to confirm where the market is actually headed.
- A +DMI above -DMI signals an uptrend; the reverse indicates a downtrend.
- On USD/JPY, I’ve avoided bad trades by confirming DMI crossovers first.
- Use DMI to add context to ADX readings for better decisions.
6.3. Relying on ADX alone
ADX is powerful, but it’s not a standalone tool. Using it without other indicators, like moving averages or price action, can leave you blind to key signals. I’ve found combining tools gives a fuller picture of the market.
- Use ADX in combination with EMA or RSI to validate your trade entries and exits.
- For instance, gold trades work better when ADX aligns with price levels.
- This approach reduces the risk of acting on incomplete information.
6.4. Misreading high ADX values
A high ADX, above 50, doesn’t mean “buy” or “sell”, it just shows a strong trend. Mistaking it for a trading signal can lead to late entries or missed exits. I’ve been cautious when ADX gets too high, as trends often slow down.
- Values above 50 may signal trend exhaustion, like in the S&P 500 case.
- Watch for ADX flattening to prepare for potential reversals.
- Always check price action to time your trades accurately.
7. FAQs
When diving into the ADX Indicator Average Directional Index, traders often have questions about how it works and how to use it effectively. I’ve come across these queries myself while learning to trade forex. Here are answers to the most common questions to help you master this tool.
8. Conclusion
In conclusion, mastering the ADX Indicator Average Directional Index truly is a game-changer for any trader aiming to ride strong trends and dodge flat markets. Mastering this tool will equip you with greater confidence and clarity in your trading decisions.
At Pip Rider, our blog is packed with guides to help you grow as a trader, whether you’re exploring the Best technical indicators or just starting with our For Beginner section. Ready to put ADX to work?
Infographic Section
-

ADX Indicator or Average Directional Index -
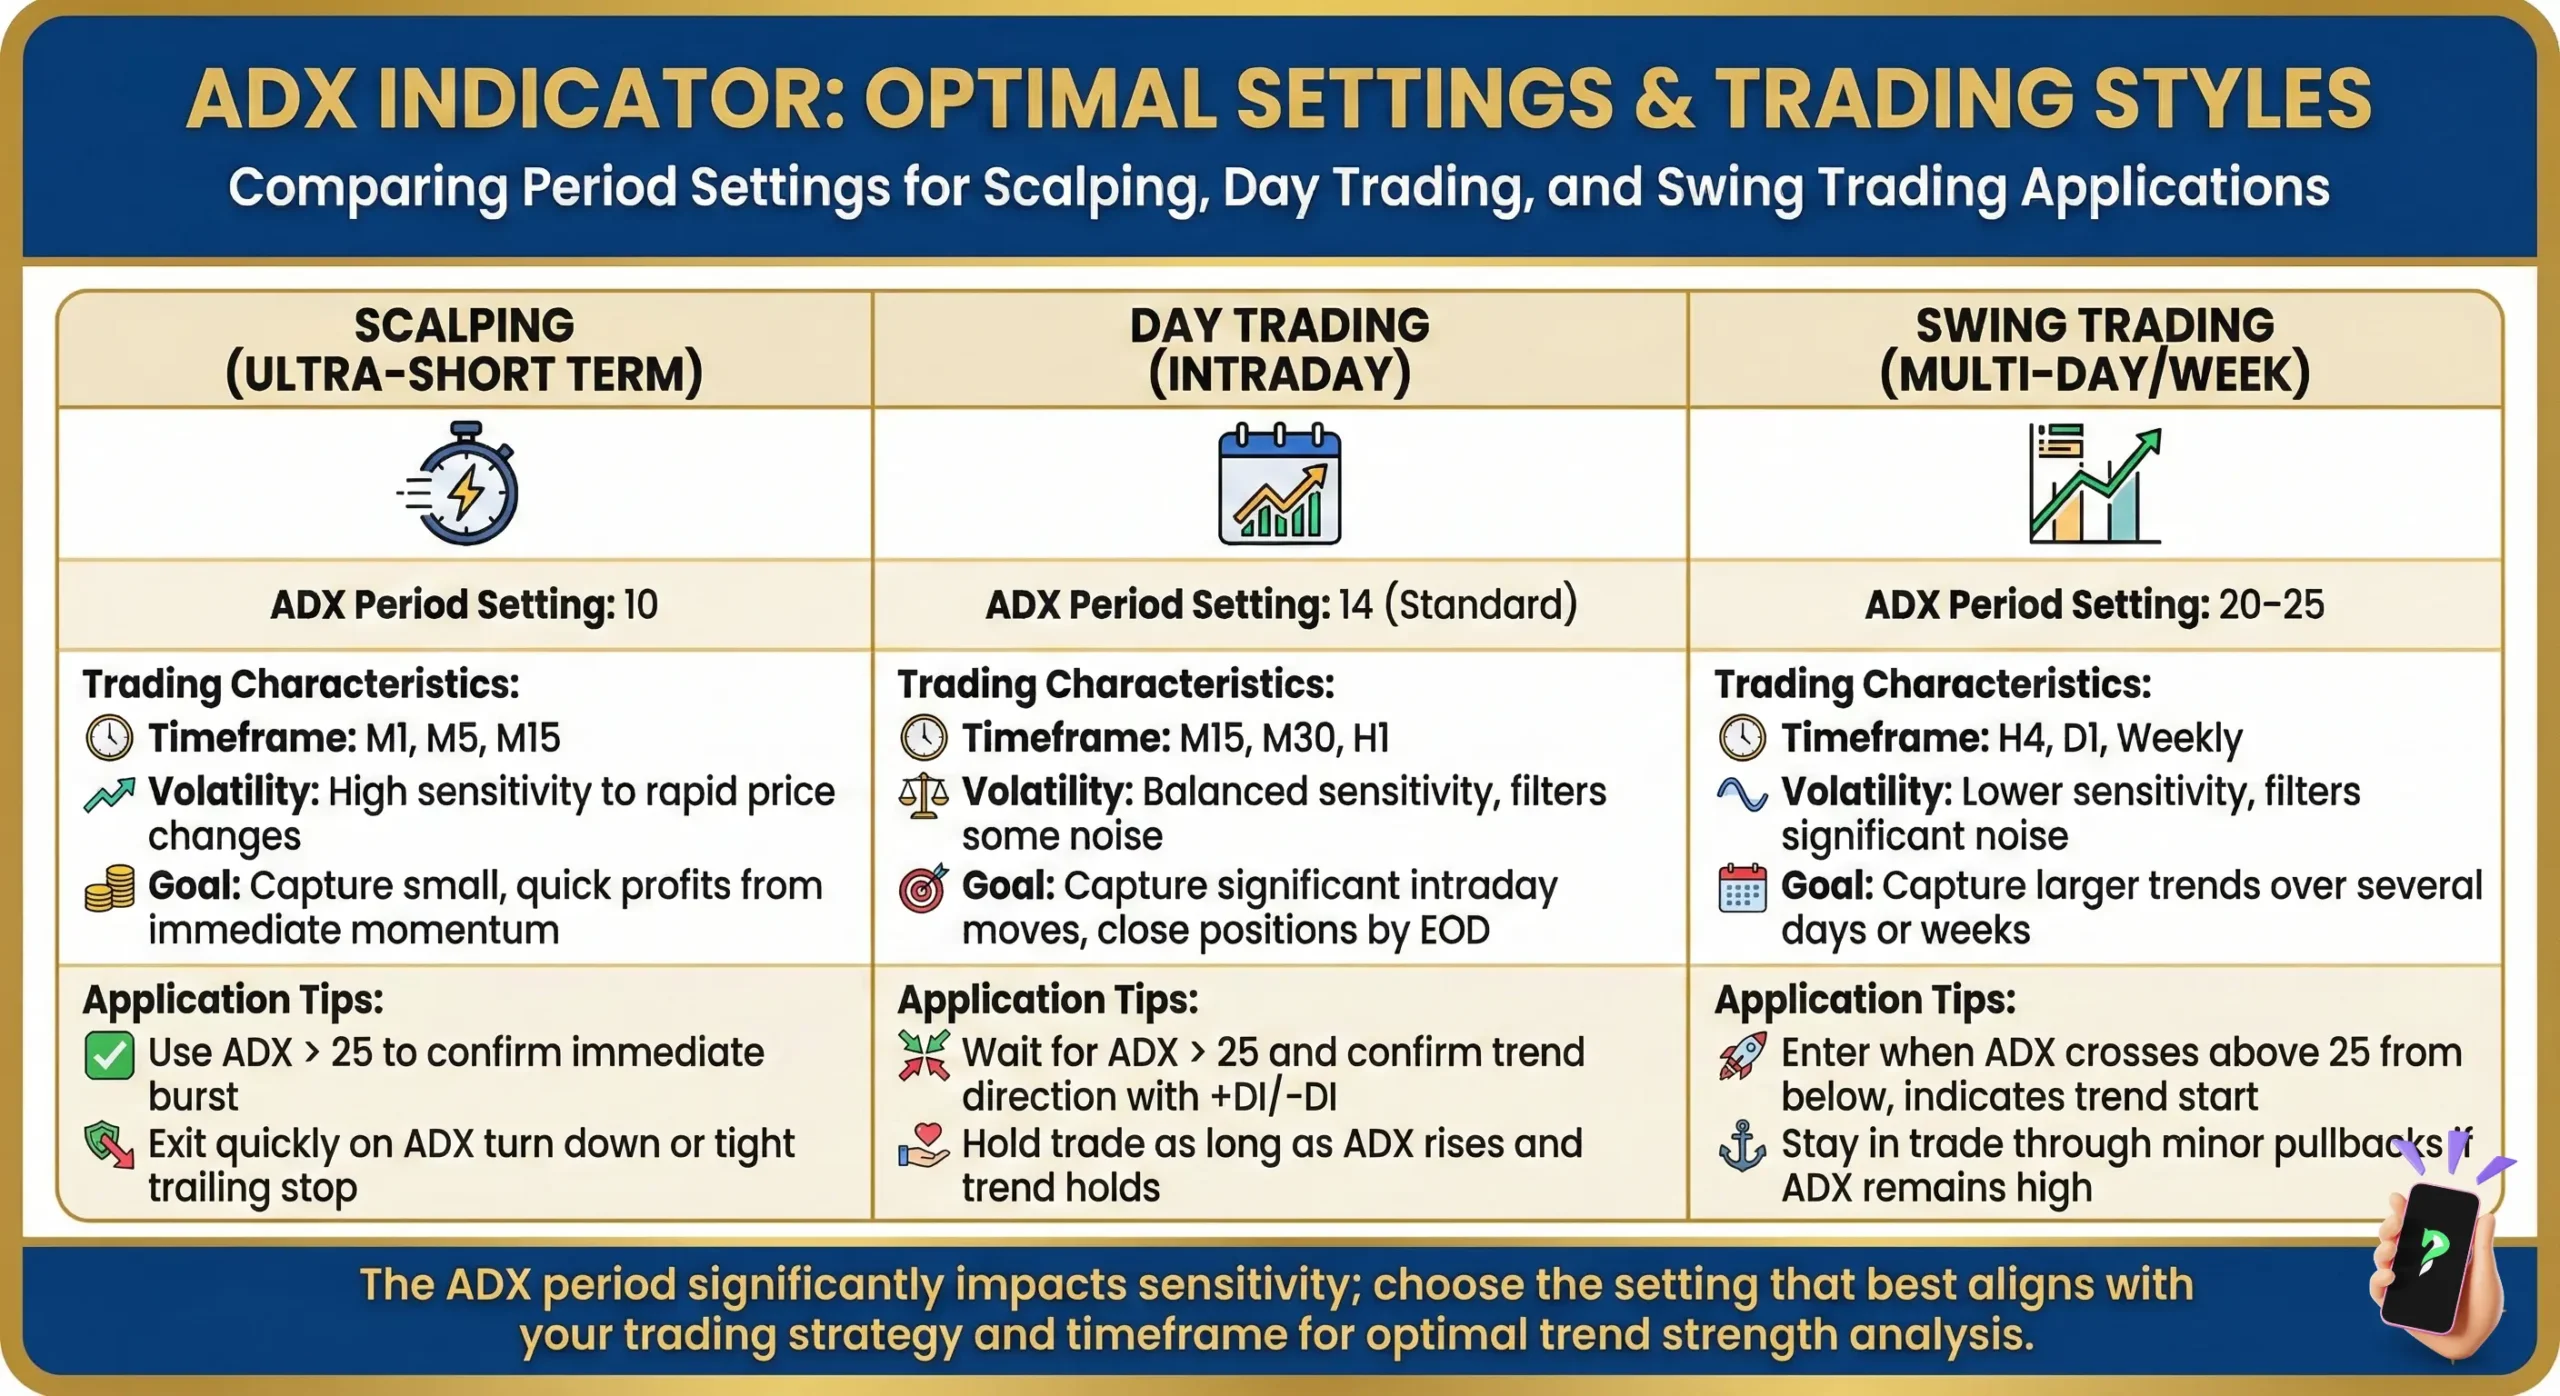
Comparing Period Settings -

Step by step Trading Process


