
I’ve always been fascinated by tools that simplify complex markets, and Andrew Pitchfork is one of those hidden gems in forex trading. This technical indicator, often overlooked by beginners, helps traders spot trends, support, and resistance levels with surprising ease. In this guide, we’ll break down how to use Andrew Pitchfork, share practical strategies, and show you how it can boost your trading confidence.
Whether you’re new to forex or looking to refine your skills, this article will walk you through everything you need to know about the Andrews Pitchfork indicator.
From drawing it on your charts to applying real-world strategies, we’ve got you covered with clear steps and visuals. Let’s dive in and explore how this tool can help you navigate the forex market like a pro.
Key Takeaways
-
- Understand what Andrew Pitchfork is and how its three-line structure identifies support and resistance.
-
- Learn why this tool is valuable for forex trading, especially for spotting trends and breakouts.
-
- Master drawing the Andrews Pitchfork indicator on platforms like MT4 or TradingView.
-
- Discover practical Andrews Pitchfork strategies, like trading support/resistance and breakouts.
-
- Explore variations like Schiff and Modified Schiff Pitchfork for different market conditions.
-
- Get tips to improve your skills and avoid common mistakes with the tool.
-
- Recognize the limitations of Andrew Pitchfork to use it wisely in your trades.
1. What is Andrew Pitchfork?
If you’re new to technical analysis, Andrew Pitchfork might sound intimidating, but it’s actually a straightforward tool that can make forex trading easier to understand. Let’s break it down step by step.
1.1. Understanding the basics
Andrew Pitchfork, also called Andrews Pitchfork, is a technical indicator that feels like a compass in a chaotic market. It uses three parallel lines to gently guide your eye, revealing hidden support and resistance levels on a price chart. It’s like a breath of fresh air for traders who feel lost in the noise.

It was created by the insightful Alan Andrews, who named it for its distinctive fork-like shape. The tool helps traders spot where prices might hold steady or reverse, offering a much-needed sense of clarity and direction in a chaotic market.
1.2. How it’s built
To create an Andrews Pitchfork indicator, you embark on a fun little mission: picking three key points on your chart, ideally at the start of a new trend. For a powerful uptrend, you’ll choose a low, a high, and another low.
It’s like tracing the market’s first big moves. For a confident downtrend, you’ll go with a high, a low, and another high. From that first anchor point, the tool brilliantly draws a median line through the midpoint of the other two, creating a beautiful, parallel channel with upper and lower lines. It’s truly a thing of beauty when it all comes together!
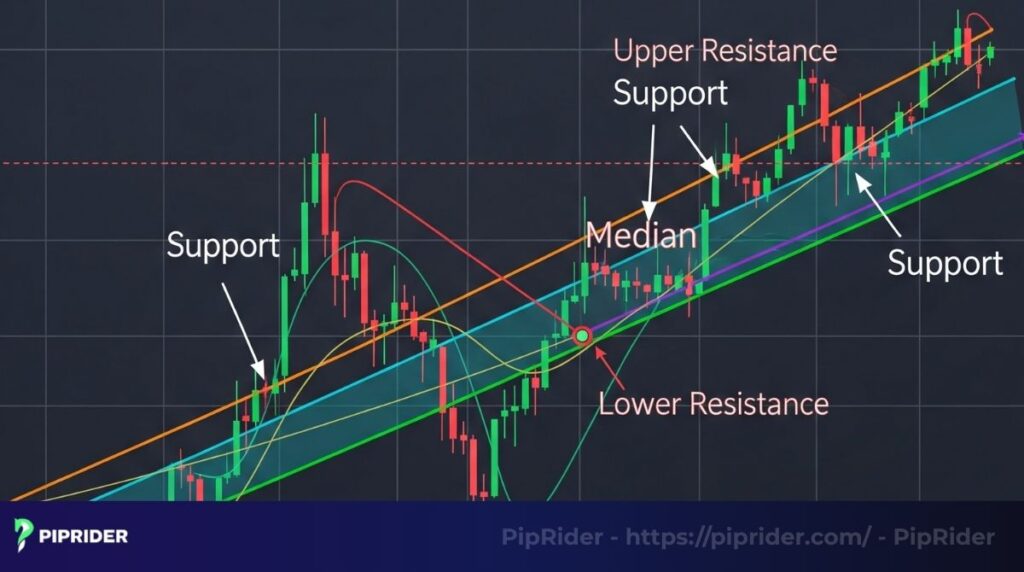
1.3. Why it looks like a fork
The shape comes from the three lines: the median line acts as the handle, while the upper and lower lines form the prongs. This setup helps you see potential price zones for buying or selling. For example, I’ve noticed that prices often bounce off the lower line in an uptrend, signaling a buying opportunity.
2. What insights does Andrews Pitchfork provide?
Andrews Pitchfork provides traders with a visual framework to identify key price levels in the forex market. It highlights areas where prices may find support or resistance and signals potential breakout or breakdown opportunities. By mapping a channel, it helps traders plan entries, exits, and stop-loss placements with greater precision.
2.1. Support and Resistance (Trading Ranges)
The Pitchfork’s upper and lower trendlines are not just lines; they’re powerful, dynamic support and resistance zones that you can truly rely on. They give traders the confidence to act: buying near the lower trendline in an uptrend, as it holds strong like a trusted friend, or selling near the upper trendline when it firmly rejects the price.
The median line also plays a role, offering a secondary level of support or resistance. While it’s not as ironclad as the outer lines, it can still be your first target for taking profits.
Imagine this: you enter a long position at the lower trendline and watch with satisfaction as the price climbs toward the median or upper line, where you can lock in your gains. It’s an effective strategy, especially when you have confirmation from indicators like RSI or a clear candlestick pattern to back you up.
2.2. Breakouts and Breakdowns (Trending Markets)
Andrews Pitchfork is also effective for spotting breakout (above the upper trendline) or breakdown (below the lower trendline) opportunities in trending markets.
These moves can signal significant price shifts, but traders should watch for false breakouts by confirming with volume-based indicators like OBV or momentum tools like MACD. Strong volume accompanying a breakout often indicates a reliable trend continuation, while weak volume may suggest a reversal.
3. Why use Andrew Pitchfork in forex trading?
Andrew Pitchfork might not be as famous as some forex tools, but it’s a powerful ally for traders who want clarity in their charts. Here’s why it’s worth adding to your trading toolkit.
The Andrews Pitchfork indicator shines because it simplifies spotting key price levels in the fast-moving forex market. It helps you pinpoint where prices might pause or reverse, making it easier to plan trades. Unlike some indicators that overwhelm with data, this one offers a clean, visual way to track trends.
I’ve found that Andrew Pitchfork is especially useful for staying calm in volatile markets. It highlights support and resistance zones, so you know where to enter or exit trades. It also works well for spotting breakout opportunities, which can lead to bigger profits if timed right.
Compared to tools like Fibonacci retracement or moving averages, Andrew Pitchfork gives a unique perspective by mapping out a channel. The table below illustrates how it compares:
| Tool | Strength | Best for |
| Andrew Pitchfork | Clear support/resistance channels | Trend and breakout trading |
| Fibonacci Retracement | Precise retracement levels | Short-term reversals |
| Moving Averages | Trend direction and momentum | Long-term trend following |
This tool fits perfectly into platforms like MT4 or TradingView, making it accessible for most traders. Whether you’re trading EUR/USD or GBP/JPY, the Andrews Pitchfork strategy can help you stay disciplined and make smarter decisions.
4. How to draw Andrew Pitchfork on your charts
Drawing an Andrews Pitchfork indicator might seem tricky at first, but with a bit of practice, it’s a breeze. Here’s how to set it up on your forex charts to start trading smarter.
The key to using Andrew Pitchfork is placing it correctly on your chart. It’s all about picking the right points to form a clear channel. I’ve learned that a little patience in setting it up can make a big difference in spotting reliable signals.
Here’s a simple step-by-step guide to draw Andrew Pitchfork:
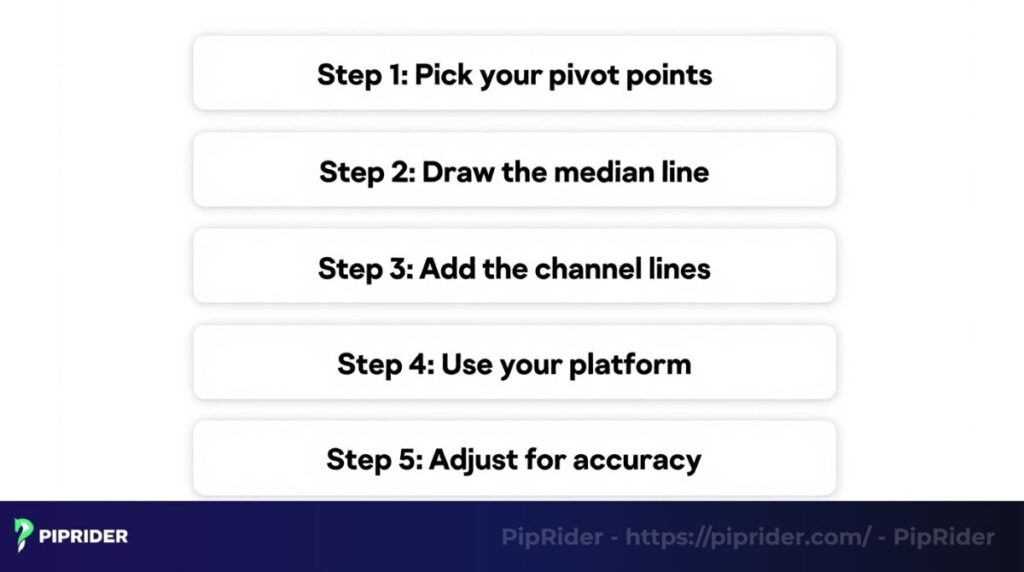
- Step 1: Pick your pivot pointsChoose three points based on the trend. For an uptrend, select a low, a high, then another low. For a downtrend, go with a high, a low, then another high.
- Step 2: Draw the median lineBegin at the initial point and draw a line through the center of the second and third points. This forms the core of the Andrews Pitchfork approach.
- Step 3: Add the channel linesSketch parallel lines from the second and third points to form the upper and lower limits of the channel.
- Step 4: Use your platformMost platforms like MT4, MT5, or TradingView have a Pitchfork tool. Select it, click your three points, and the chart will do the rest.
- Step 5: Adjust for accuracyIf the channel looks off, tweak the third point slightly. I’ve noticed this helps when trading volatile pairs like USD/JPY.
5. Andrews Pitchfork strategy for forex trading
Once you’ve drawn your Andrew Pitchfork, the real fun begins—using it to make smarter trades. This section shares practical ways to apply the Andrews Pitchfork strategy in forex, whether you’re aiming for steady gains or big breakouts.
I’ve found that the Andrews Pitchfork indicator is a game-changer when you know how to use it for different market conditions. It’s like having a map that guides you through price movements.

Here are three core strategies to get you started:
- Trade support and resistance:
Buy when the price nears the lower trendline, which acts as support in an uptrend. Sell near the upper trendline or median line if the trend weakens. Always check with tools like RSI to confirm signals. - Catch breakouts or breakdowns:
Enter a long trade if the price breaks above the upper trendline with strong volume, using indicators like OBV for backup. Go short if it drops below the lower trendline, signaling a breakdown. - Track trend strength:
Watch the median line. If prices stay above it in an uptrend, the trend is strong. If they fall below, it might be time to exit or rethink your position.
Here’s a quick comparison of these strategies:
| Strategy | When to use | Key indicator to pair |
| Support/resistance | Stable trends | RSI, candlestick patterns |
| Breakout/breakdown | Volatile markets | OBV, MACD |
| Trend strength | Confirming trend direction | Moving averages |
For me, the real ‘aha!’ moment came when I started pairing the Andrews Pitchfork strategy with simple candlestick patterns. Seeing a price touch the lower Pitchfork line is one thing, but seeing it form a clear bullish engulfing pattern right there? That’s what turns a hesitant signal into a high-confidence trade for me. Test these approaches on a demo account first to see what works best for you.
6. Variations of Andrew Pitchfork
The Andrews Pitchfork indicator isn’t a one-size-fits-all tool, it comes in different flavors to suit various market conditions. Understanding these variations can help you adapt your trading approach.
I’ve learned that tweaking the Pitchfork setup can make a big difference, especially in forex markets that shift quickly.
Let’s explore the main types of Andrew Pitchfork and when to use them.
Standard Andrews Pitchfork:
This is the classic version, built with three pivot points to form a channel. It’s great for clear trends, like when EUR/USD is steadily climbing or falling.
Schiff Pitchfork:
This variation, developed by Jerome Schiff, modifies the starting point of the pitchfork (pivot point 1). Instead of originating from the initial pivot 1, it is moved to a point located at the midpoint both vertically (in price) and horizontally (in time) between the first two pivots (points 1 and 2).
This adjustment makes the Schiff Pitchfork better suited for trends with a shallower slope, or when the standard Andrew Pitchfork indicator seems too steep to frame the price action.
Modified Schiff Pitchfork:
This is a modified version of the Schiff Pitchfork. It also repositions the starting point of the median line, but it only moves it 50% of the vertical distance (price difference) between pivot 1 and pivot 2.
The horizontal (time) starting point remains at pivot 1. This Modified Schiff Pitchfork variation is often considered suitable for volatile markets where price swings require a tighter channel fit.
Each variation has its place, depending on the market’s behavior. I’ve noticed the Schiff version helps when trends look uneven, while the standard one is my go-to for strong moves.
7. Tips for mastering Andrew Pitchfork
Using the Andrews Pitchfork indicator effectively takes practice, but a few smart habits can speed up your learning curve. These tips will help you get the most out of this tool in forex trading.
I’ve found that small tweaks and a bit of patience can turn Andrew Pitchfork into a reliable guide for your trades.
Here are some practical ways to sharpen your skills:
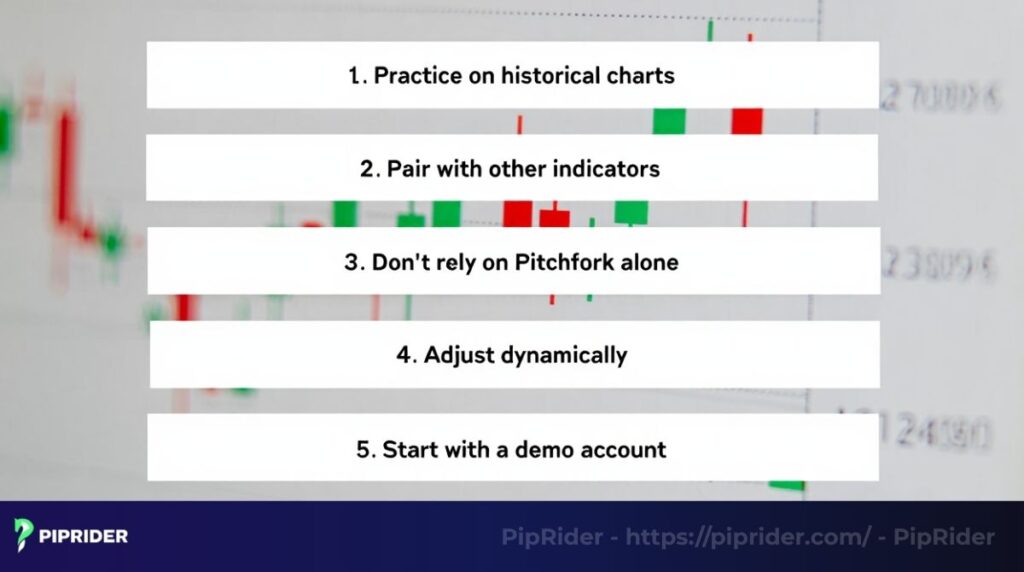
- Practice on historical charts: Test drawing Pitchforks on past price data to get a feel for picking pivot points. This builds confidence before you trade live.
- Pair with other indicators: Use tools like MACD or Bollinger Bands to confirm signals. This reduces the risk of acting on false breakouts.
- Don’t rely on Pitchfork alone: Always cross-check with volume or momentum indicators, like OBV, to avoid misreading market moves.
- Adjust dynamically: If the market shifts, tweak your pivot points. I’ve noticed that fine-tuning the third point helps when trading pairs like USD/JPY.
- Start with a demo account: Try your Andrews Pitchfork strategy in a risk-free setting to see what works for your trading style.
These steps can make the Andrews Pitchfork strategy more reliable, especially for beginners navigating the forex market.
8. Limitations of Andrew Pitchfork
No tool is perfect, and the Andrews Pitchfork indicator has its challenges. Knowing its limits can help you use it wisely in forex trading.
I’ve seen traders get frustrated when Andrew Pitchfork doesn’t work as expected, often because they overlook its weaknesses.

Here are the main limitations to keep in mind:
- Highly subjective pivot point selection: This is the biggest limitation of the Andrews Pitchfork indicator. The selection of the three pivot points is entirely dependent on the trader’s judgment.
Two different traders can draw two completely different pitchforks on the same chart, leading to contradictory signals and Andrews Pitchfork strategy approaches. This lack of objectivity requires significant experience and practice to identify meaningful pivot points.
- Struggles in choppy markets: The Pitchfork is less reliable when prices move sideways or swing wildly, like during news events.
- Risk of false breakouts: Prices can break through the channel but reverse quickly. I’ve noticed this happens without confirmation from tools like OBV.
- Needs regular tweaks: Markets change fast, so you must adjust the Pitchfork often to stay accurate.
Understanding these limits helps you pair the Andrews Pitchfork strategy with other tools for better results.
9. Frequently Asked Questions
10. Conclusion
Ultimately, Andrew Pitchfork is more than just lines on a chart; it’s a framework for interpreting the market’s rhythm. While no single indicator guarantees success, mastering the Andrews Pitchfork strategy will undoubtedly sharpen your eye for trends and discipline your entries and exits. Treat it as a loyal guide, not an infallible oracle.
Whether you’re a beginner or sharpening your skills, this tool can guide you through price movements. Explore more tips and tools in the blogs of Pip Rider, especially in our best technical indicators and For Beginner categories. Ready to level up your trading?
Infographic Section
-
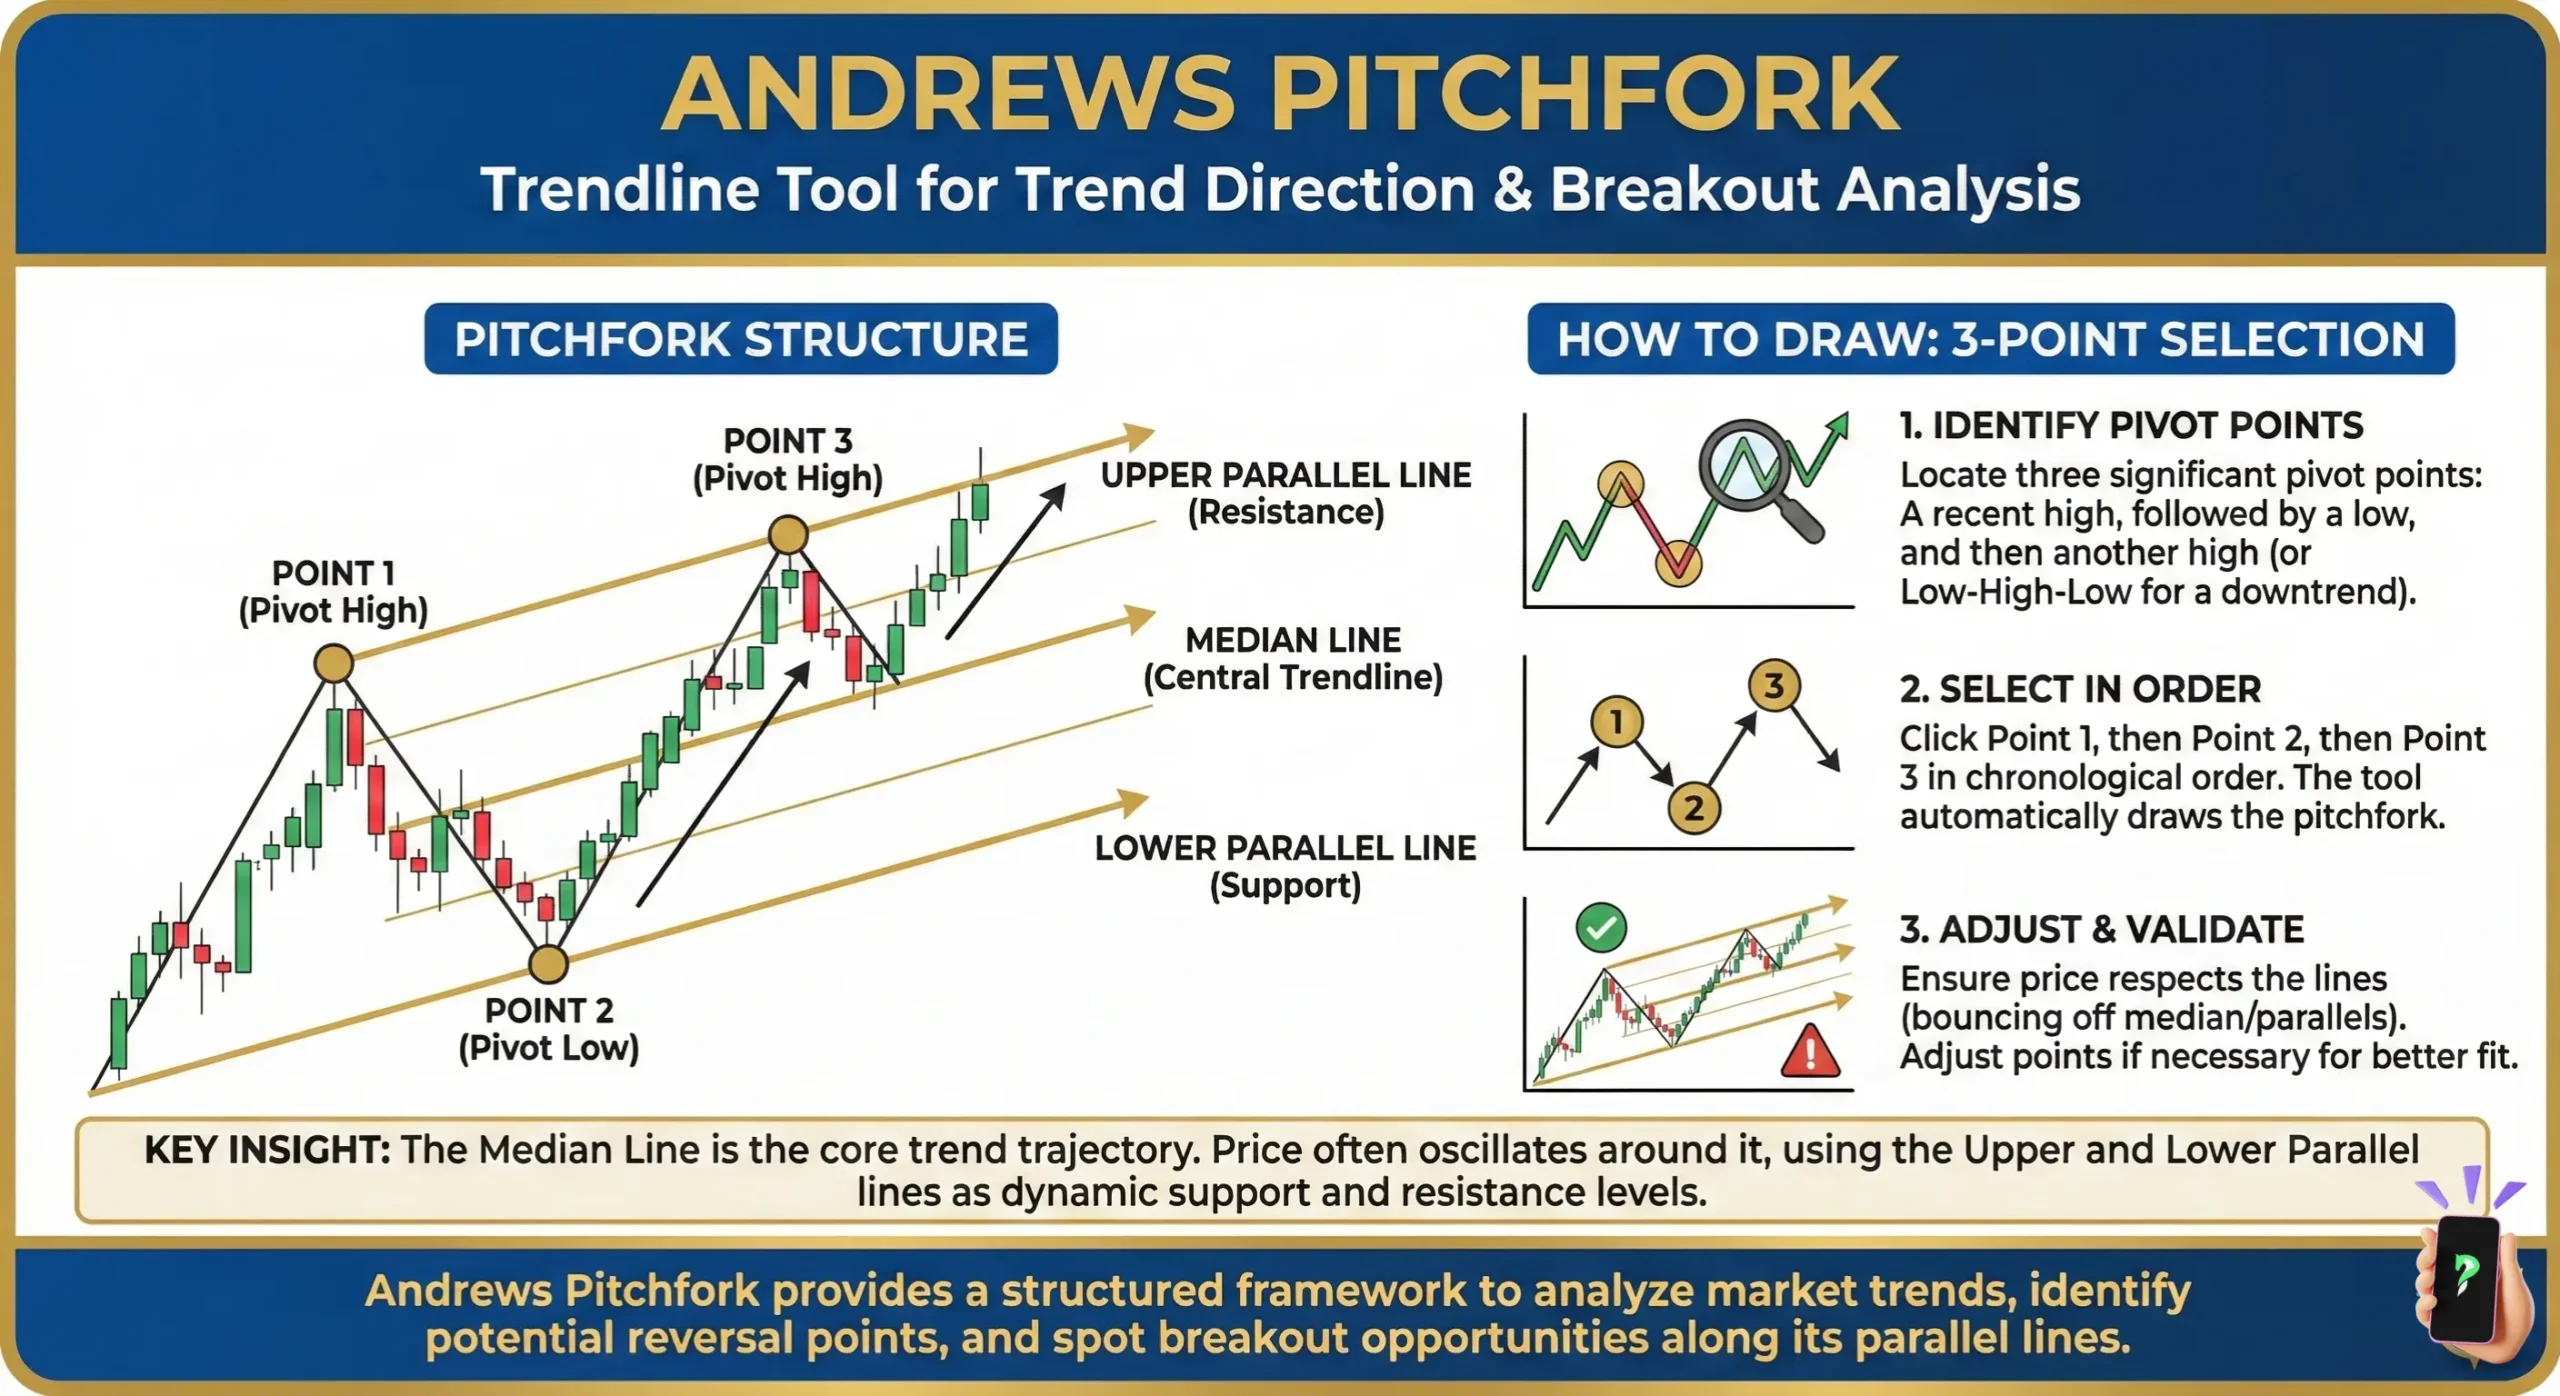
Andrews Pitchfork: Trendline Tool for Trend Direction & Breakout Analysis -
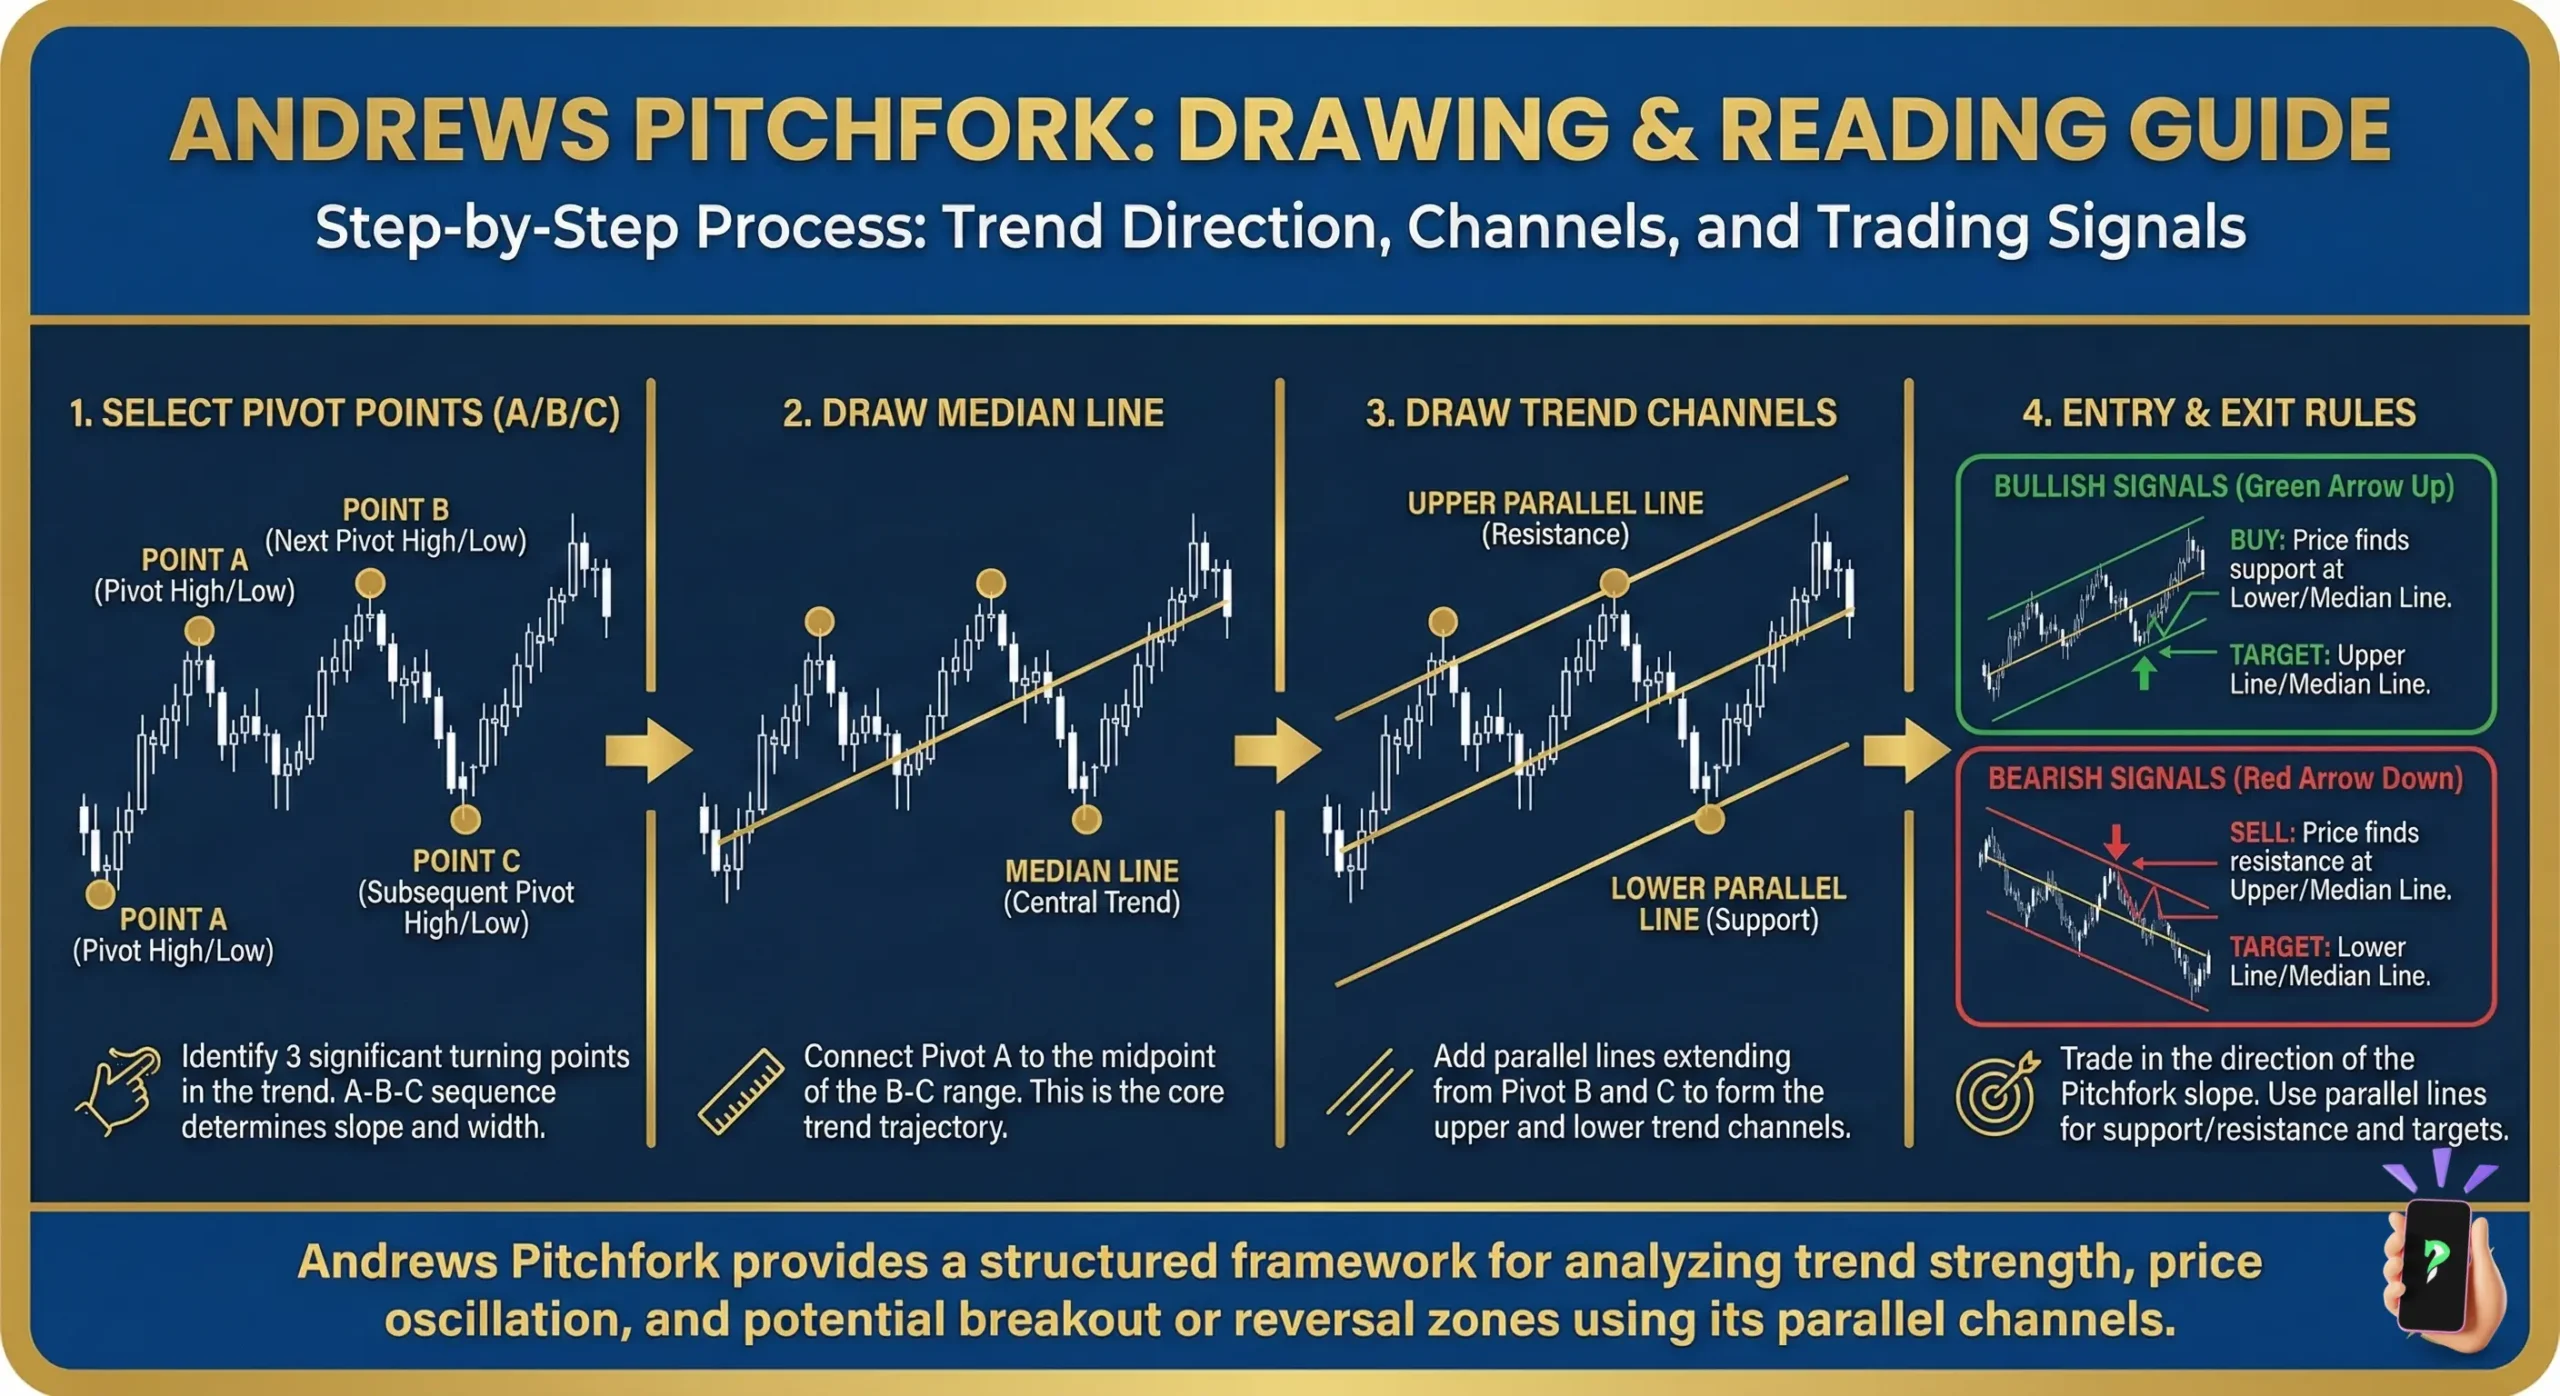
Andrews Pitchfork: Drawing & Reading Guide -
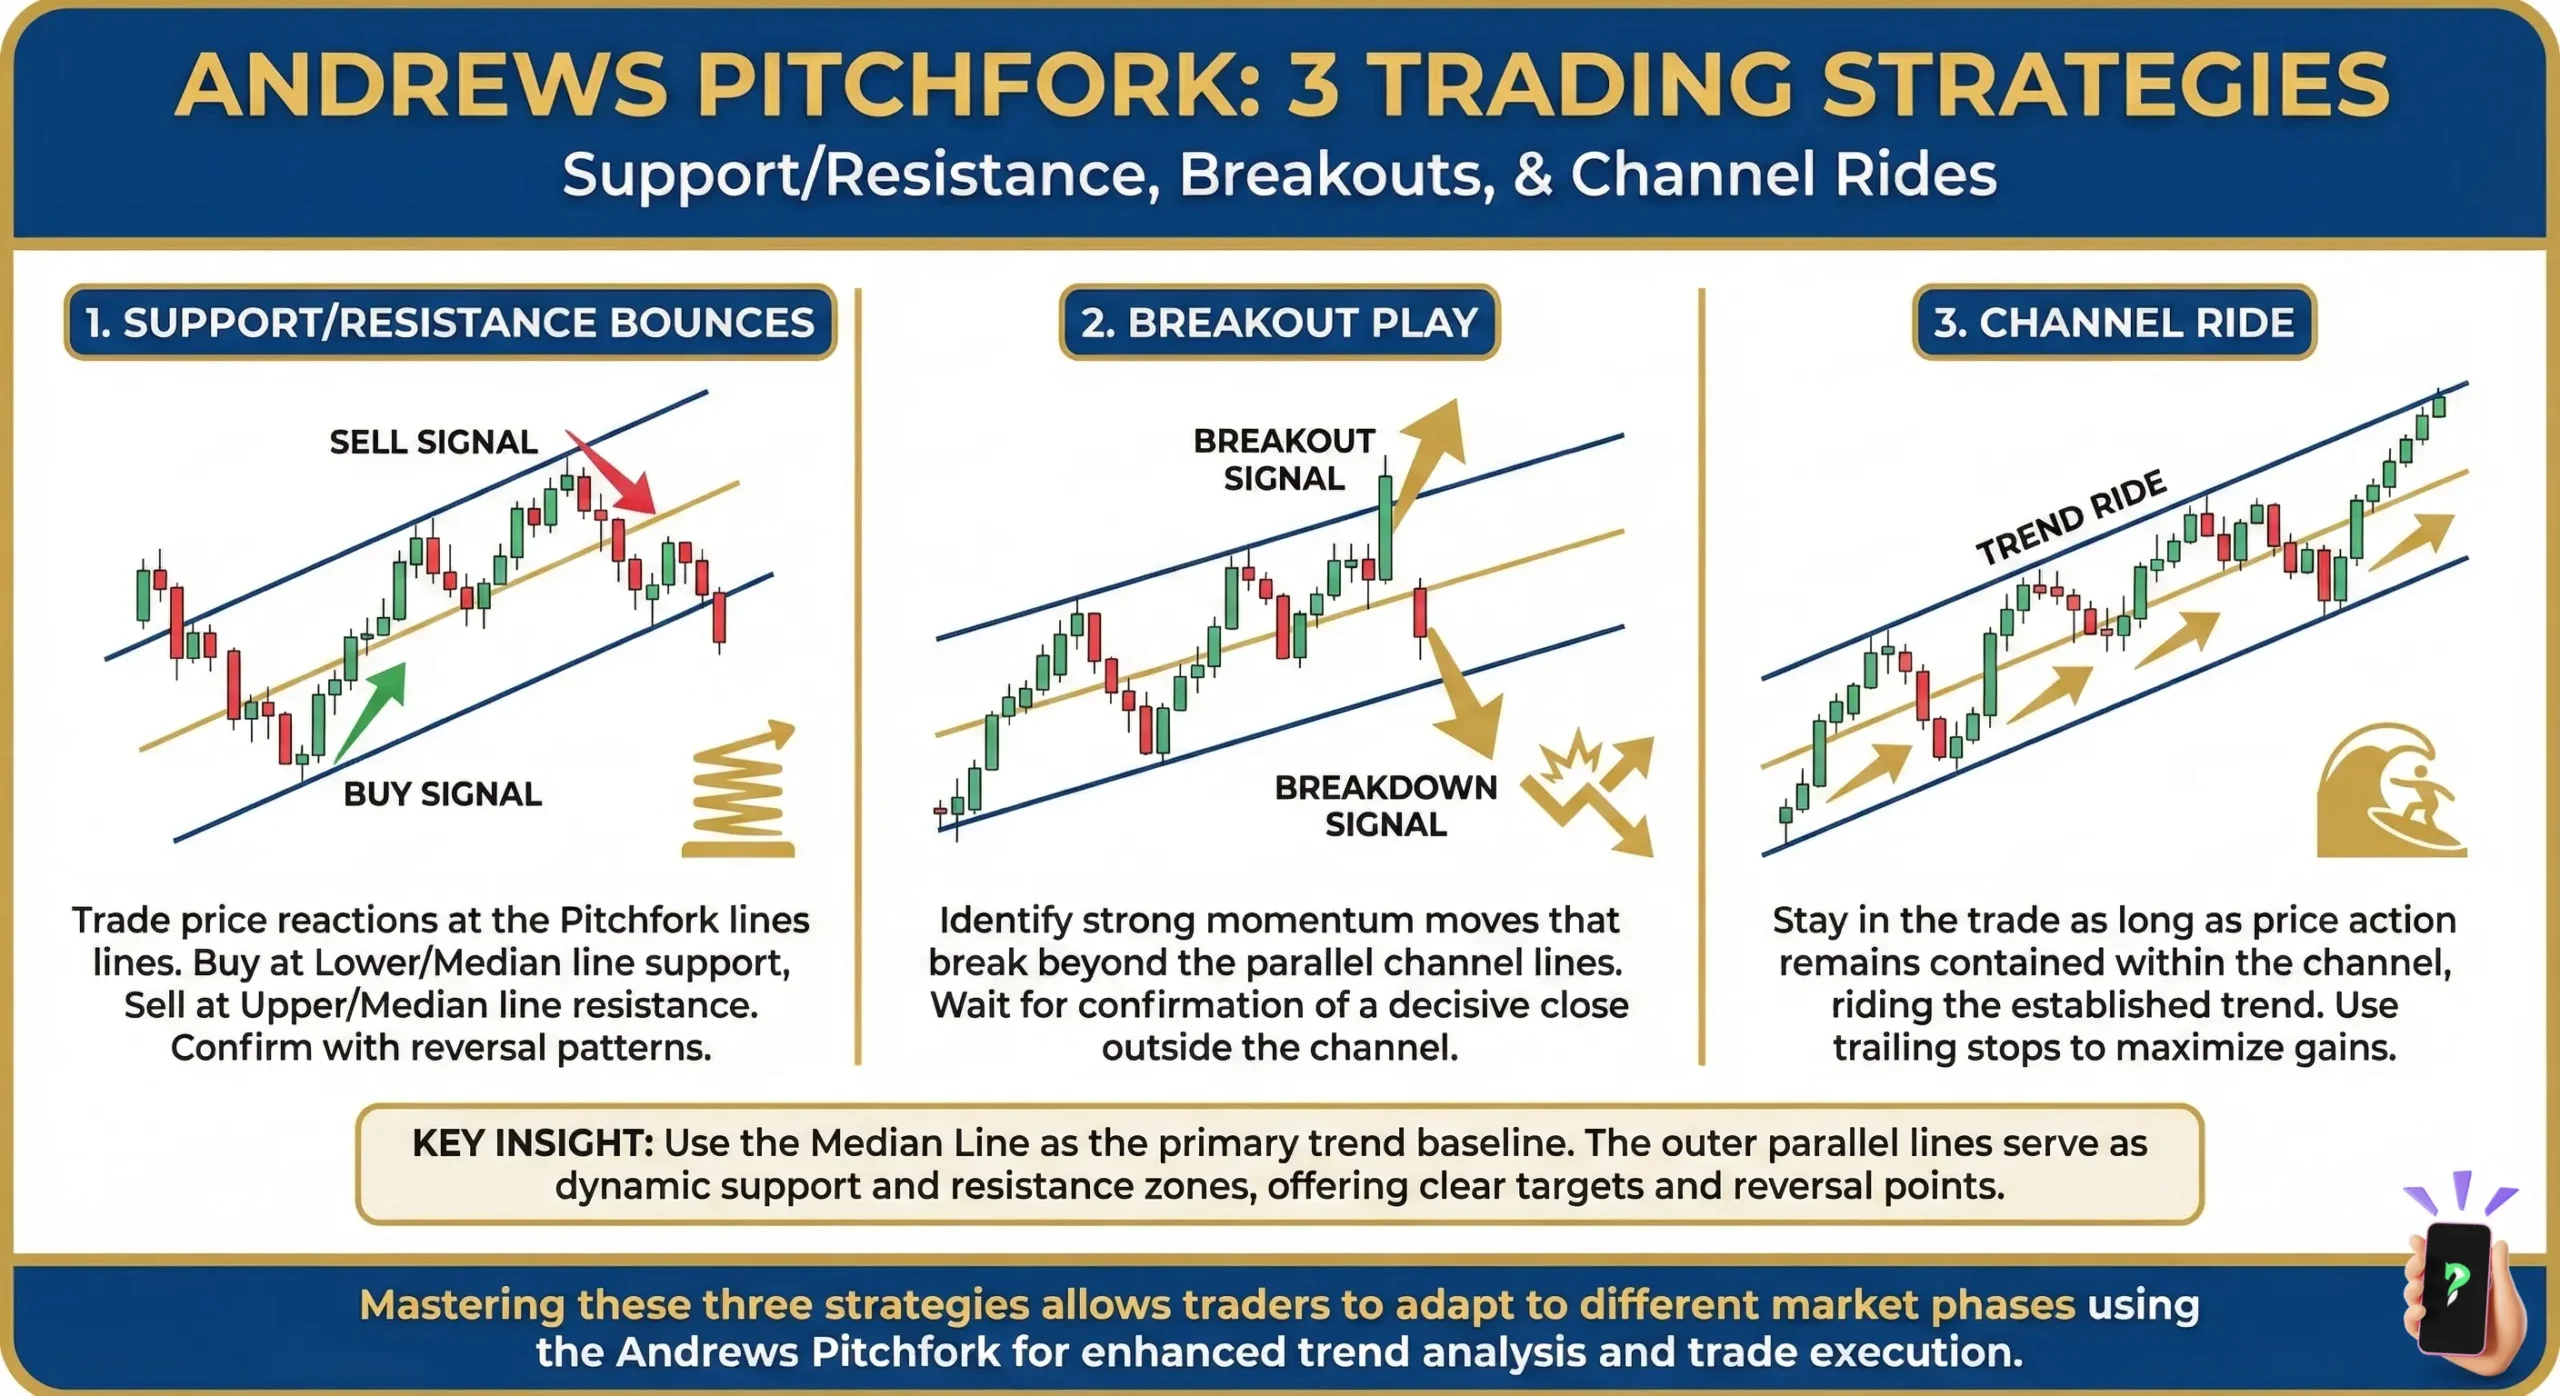
Andrews Pitchfork: 3 Trading Strategies


