
Simplifying complex market structures is the hallmark of professional trading, and the Andrews Pitchfork is one of the most effective tools for this task. Often misunderstood by beginners as a mathematical tool, the Andrews Pitchfork is actually an advanced median line drawing tool used to map a trend channel and dynamic support and resistance (S/R) levels.
In this guide, we will break down the geometry behind the Pitchfork, share practical strategies, and demonstrate how applying median line studies can significantly boost your trading accuracy. Whether you are new to market geometry or looking to refine your technical edge, this article covers everything from drawing precise anchor points to executing high-probability trades.
Key Takeaways
-
- Understand what Andrews Pitchfork is and how its three-line structure identifies support and resistance.
-
- Learn why this tool is valuable for forex trading, especially for spotting trends and breakouts.
-
- Master drawing the Andrews Pitchfork on platforms like MT4 or TradingView.
-
- Discover practical Andrews Pitchfork strategies, like trading support/resistance and breakouts.
-
- Explore variations like Schiff and Modified Schiff Pitchfork for different market conditions.
-
- Get tips to improve your skills and avoid common mistakes with the tool.
-
- Recognize the limitations of Andrew Pitchfork to use it wisely in your trades.
1. What is Andrews Pitchfork?
If you’re new to technical analysis, Andrews Pitchfork might sound intimidating, but it’s actually a straightforward tool that can make forex trading easier to understand. Let’s break it down step by step.
1.1. Understanding the basics
The Andrews Pitchfork is not a calculated technical indicator like the RSI or MACD; rather, it is a sophisticated drawing tool that acts as a structural compass in a chaotic market. By utilizing three parallel lines, it maps out a clear trend channel, revealing hidden dynamic support and resistance zones.
Created by Alan Andrews and named for its distinctive fork-like shape, this “median line study” helps traders visually frame market geometry. It highlights exact zones where prices are mathematically likely to hold steady or reverse, offering a high-probability roadmap for navigating trend continuation and structural exhaustion.

1.2. Geometric Construction
The Andrews Pitchfork is constructed using a three-point anchor system based on established market swing points—a methodology standardized in modern technical analysis and documented by leading platforms like TradingView. To map a valid trend, three consecutive pivots must be selected:
- For an Uptrend: A major Low (Pivot 1), followed by a High (Pivot 2), and a higher Low (Pivot 3).
- For a Downtrend: A major High (Pivot 1), followed by a Low (Pivot 2), and a lower High (Pivot 3).
The tool functions by calculating the exact midpoint between Pivot 2 and Pivot 3. It then projects a median line starting from the first anchor (Pivot 1) and extending through that midpoint. Simultaneously, two parallel lines are drawn from Pivots 2 and 3, forming a geometric channel that defines the market’s trajectory.
1.3. Anatomy of the Tool
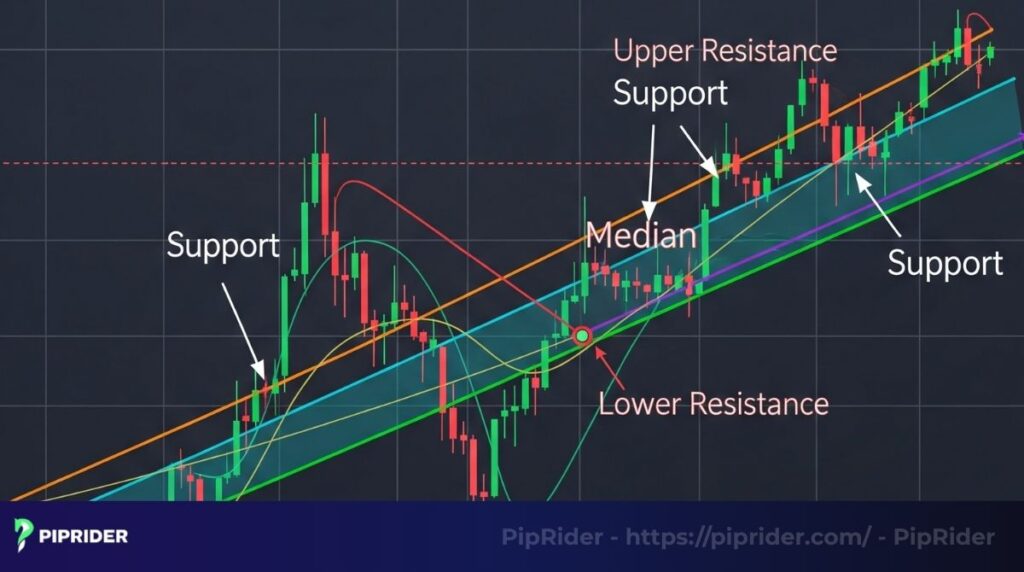
The name “Pitchfork” is derived from its unique three-pronged visual structure, which resembles a traditional pitchfork. Understanding its components is vital for identifying trading zones:
- The Handle (Median Line): This central axis represents the “fair value” or the mean of the trend. In a balanced market, price action tends to gravitate toward and oscillate around this line.
- The Prongs (Parallel Lines): The upper and lower parallel lines act as dynamic boundaries. These lines represent areas of extreme price deviation, identifying high-probability zones for support or resistance.
Rather than looking at static horizontal levels, this anatomy allows traders to visualize the market’s “rhythm,” identifying where price is mathematically expected to stall or reverse within a moving trend.
2. What insights does Andrews Pitchfork provide?
The Andrews Pitchfork provides a visual framework to track the rhythm of the market. By projecting a median line and two parallel boundaries, it helps traders map out precise areas where price is mathematically likely to pause, reverse, or accelerate.
2.1. Dynamic Support and Resistance
The upper and lower parallel lines of the Pitchfork act as dynamic support and resistance boundaries. In a valid uptrend, traders utilize the lower trendline as a high-probability buying zone, and the upper trendline as a target for taking profits. The central median line serves as the primary “price magnet” and a secondary structural level to manage active positions.
2.2. Breakouts and Breakdowns
Beyond trading within the established channel, the Pitchfork effectively highlights structural shifts. A price closing decisively above the upper trendline signals a bullish breakout, while a drop below the lower trendline indicates a bearish breakdown.
Important Note for Forex Traders: In spot FX, volume is typically tick volume (a proxy), not centralized traded volume. Use volatility indicators like ATR or Volume Spread Analysis (VSA) principles focused on price spread as secondary confirmation only. To validate a breakout and avoid traps, prioritize a strong candle close outside the fork, a successful retest that holds the new level, and volatility expansion measured by tools like the ATR (Average True Range) or MACD.
3. Why use the Andrews Pitchfork in Forex Trading?
While many traders rely on lagging indicators that react to past price action, the Andrews Pitchfork is a leading geometric tool. It provides a structural roadmap by projecting future areas of support and resistance before the price even reaches them. This forward-looking capability is essential in the fast-paced Spot FX market.
Key Advantages for Forex Traders:
- Defining Market Equilibrium: Based on the median line theory popularized in John J. Murphy’s ‘Technical Analysis of the Financial Markets,’ the median line acts as a ‘magnet’ representing the trend’s fair value. In high-liquidity pairs like EUR/USD, price action gravitates toward this central axis approximately 80% of the time.
- Structural Discipline: By anchoring the tool to major swing points, traders avoid “chasing” the market. It forces a disciplined approach, requiring price action to reach specific geometric boundaries before a trade is considered.
- Confluence with Volatility: The Pitchfork pairs seamlessly with volatility filters like the ATR (Average True Range), allowing for precise stop-loss placement outside of noise-heavy zones.
Comparison: Pitchfork vs. Traditional Tools
The Andrews Pitchfork offers a unique perspective that standard technical tools often miss. The table below highlights its specific strengths:
| Tool | Strength | Best For |
|---|---|---|
| Andrews Pitchfork | Clear support/resistance channels | Trend and breakout trading |
| Fibonacci Retracement | Precise retracement levels | Short-term reversals |
| Moving Averages | Trend direction and momentum | Long-term trend following |
By integrating the Andrews Pitchfork into platforms like TradingView or MT4/5, traders gain a geometric edge that simplifies complex price movements into a tradable, structural channel.
4. How to draw Andrews Pitchfork on your charts
Correctly placing the Andrews Pitchfork depends entirely on selecting the right pivot points. A misaligned anchor point will result in a channel that price action ignores.
Step-by-step application:
- Step 1: Identify Structural Pivots
- Select clear, established structural swing points that have visibly formed a major peak or trough. Avoid using minor pullbacks or market “noise” on lower timeframes (like M5 or M15).
- Step 2: Anchor the Points
- For an uptrend, anchor the tool to a major Low, a subsequent High, and a higher Low. For a downtrend, select a major High, a subsequent Low, and a lower High.
- Step 3: Project the Channel
- Select the Pitchfork tool on your trading platform (such as MT4, MT5, or TradingView) and click the three chosen pivots. The platform will automatically project the median line and the parallel upper and lower boundaries.
- Step 4: Refine and Invalidate (The “Refit” Rule)
- While initial micro-adjustments to the third pivot can optimize the starting fit, avoid ‘chasing’ the price later. If the geometry fails, delete it and start fresh.
5. Andrews Pitchfork strategy for forex trading
The geometry of the Pitchfork offers a precise roadmap for executing trades. However, professional execution requires pairing these geometric lines with price action triggers and volatility filters.
| Strategy | When to Use | Key Indicator to Pair |
|---|---|---|
| Support / Resistance | Stable trends | RSI, Candlestick patterns |
| Breakout / Breakdown | Volatile markets | ATR, MACD, Price Action (Retest) |
| Trend Strength | Confirming trend direction | Moving Averages |

5.1. Strategy 1: Range Trade Inside the Fork (Mean Reversion)
This strategy capitalizes on the natural ebb and flow of price within a well-established trend channel, treating the outer lines as dynamic boundaries.
- Condition: A clear Pitchfork structure is drawn, and price action is visibly respecting the upper and lower parallel lines.
- Entry: Execute a trade when the price touches the outer boundary (e.g., lower parallel in an uptrend) and prints a confirming candlestick pattern (such as a pin bar or engulfing candle) or breaks market micro-structure on a lower timeframe.
- Stop-Loss (SL): Place the SL below the nearest structural swing low, or just outside the lower parallel line with an added ATR buffer to avoid stop-hunts.
- Take-Profit (TP): Scale out with TP1 at the median line (the primary price magnet), and leave a runner for TP2 at the opposite upper parallel line.
- Fail Case (Invalidation): If the price closes outside the Pitchfork boundary for 1-2 consecutive candles, the range geometry is broken. Invalidate the setup and exit.
5.2. Strategy 2: Median Line “Magnet” Continuation (Trend-Follow)
In a high-momentum environment, price often hugs the median line rather than oscillating between the outer boundaries. This strategy uses the median line as dynamic support/resistance for trend continuation.
- Condition: A strong directional trend is established. The price sustains trading strictly above the median line (in an uptrend) or below it (in a downtrend).
- Entry: Wait for a pullback directly into the median line. Enter upon the formation of a clear rejection candle bouncing off the median axis.
- Stop-Loss (SL): Place the SL safely outside the pullback pivot point. Never place the SL exactly on the median line, as volatility spikes will easily trigger it.
- Exit: Target the outer parallel line (upper for longs, lower for shorts), or manually trail the stop-loss behind newly formed market structure to capture maximum trend extension.
5.3. Strategy 3: Breakout & Re-entry (Fork Failure)
Markets eventually break their geometric structures. This strategy profits from the failure of the Pitchfork channel, transitioning from a trend-following mindset to a breakout approach.
- Condition: Price decisively breaches the upper or lower parallel line and strictly closes outside the Pitchfork geometry.
- Entry: Do not blindly chase the initial breakout candle. Prioritize a “break-and-retest” setup—wait for the price to pull back and retest the breached parallel line from the outside before entering.
- Stop-Loss (SL): Place the SL back inside the Pitchfork structure, adding a volatility buffer. If the price re-enters the channel deeply, the breakout has failed.
- Take-Profit (TP): Project a 1:1 measured move based on the maximum width of the Pitchfork channel, or target the next major swing level on a higher timeframe.
5.4. Real-World Forex Case Study: EUR/USD H4 Downtrend
To illustrate the Pitchfork’s geometric precision, consider a standard structural downtrend on the EUR/USD 4-hour timeframe.
- The Setup: A descending Pitchfork is anchored to three distinct structural pivots: a macro swing High (Pivot 1), a steep swing Low (Pivot 2), and a corrective lower High (Pivot 3).
- The Trigger (Entry): As the downtrend accelerates, the price drops cleanly through the central median line into the lower half of the channel. It then initiates a corrective pullback, rallying upward to retest the underside of the median line. Upon striking this geometric axis, a textbook bearish pin bar forms. This rejection confirms institutional selling pressure (aligning perfectly with Strategy 2: Median Line Continuation).
- Risk Management: A short position is executed at the close of the pin bar. The Stop-Loss (SL) is placed strictly above the pin bar’s high, with an additional 15-pip ATR buffer to survive algorithmic stop-hunts.
- The Target (Exit): The Take-Profit (TP) is projected at the lower parallel line. As bearish volatility expands, the price is magnetically drawn to the lower boundary, triggering the exit for a highly structured 1:3 Risk-to-Reward ratio.
6. Variations of the Andrews Pitchfork
Market geometry is rarely uniform. While the standard median line study is highly effective, it cannot frame every type of price action. When a trend’s angle is exceptionally steep or unusually shallow, a standard Pitchfork will fail to contain the price. To adapt to shifting market momentum, traders utilize geometric variations that mathematically adjust the origin point of the median line.

6.1. Standard Andrews Pitchfork
The classic configuration uses the raw pivot points (1, 2, and 3) without any mathematical modification.
Best for: Symmetrical, well-defined trends with standard momentum (roughly a 45-degree angle), where impulse and correction waves are proportionate.
6.2. Schiff Pitchfork
Developed by Jerome Schiff to address structural misalignment in slow markets. According to technical standards from StockCharts ChartSchool, the origin of the median line (Pivot 1) is shifted to the exact midpoint—both vertically (in price) and horizontally (in time)—between Pivot 1 and Pivot 2.
Best for: Shallow, slow-moving consolidation trends where the standard Pitchfork channel proves too steep and price consistently breaks out of the lower boundary (in an uptrend).
6.3. Modified Schiff Pitchfork
This variation shifts the origin point by 50% of the vertical distance between Pivot 1 and Pivot 2. As detailed in StockCharts’ technical studies, the horizontal starting point remains anchored at Pivot 1, creating a unique slope for volatile pullbacks.
Best for: Moderate trends featuring deep, volatile pullbacks. It is the perfect “middle ground” when the Standard is too steep, but the regular Schiff is too flat to accurately capture the price action.
Execution Tip: Selecting the correct variation depends entirely on the angle of the trend. If the price immediately violates the boundaries of a Standard Pitchfork, apply the Modified Schiff first. If the price action is still not contained, switch to the Schiff to locate the true geometric rhythm of the market.
7. Tips for mastering Andrews Pitchfork
Mastering median line geometry requires precision and structural awareness. To integrate the Pitchfork into a professional forex trading system, traders must adopt strict execution habits and avoid common retail pitfalls.
Here are core rules to sharpen your geometric trading edge:
- Demand Structural Confluence: A Pitchfork boundary is an “area of interest,” not an automatic buy or sell signal. Always require secondary confirmation, such as a clear candlestick rejection (pin bar or engulfing pattern) or momentum divergence (using RSI or MACD), before executing a trade at the outer lines or the median axis.
- Factor in Forex Volatility (ATR): Spot FX is highly prone to algorithmic stop-hunts around obvious geometric lines. Never place a stop-loss exactly on the Pitchfork boundaries. Always incorporate an ATR (Average True Range) buffer to give the trade room to breathe.
- Respect Market Shifts (Do Not Over-Fit): If a currency pair violently breaks the channel and establishes a new macro structure, do not force the old Pitchfork to fit the new price action by endlessly tweaking the pivots. Delete the drawing and anchor a fresh Pitchfork using the newly formed swing points.
- Backtest Macro Structures: The accuracy of this tool depends entirely on the quality of the anchor points. Practice on historical charts, focusing exclusively on identifying major swing highs and lows (macro structures) rather than minor intraday pullbacks.
8. Limitations of Andrews Pitchfork
While median line analysis is highly effective for framing trends, it has inherent structural limitations. Understanding these vulnerabilities is critical to avoid forced trades and manage risk effectively.

Here are the main limitations to keep in mind:
- Highly Subjective Anchor Points: The most significant flaw of any median line tool is its reliance on the trader’s visual judgment. Two traders can draw entirely different channels on the same chart by selecting different swing highs and lows. This subjectivity demands strict, rule-based criteria for defining major pivot points.
- Ineffective in Ranging Markets: The Pitchfork is fundamentally a trend-framing tool. In choppy, sideways consolidation zones or highly erratic markets (such as during major fundamental news releases), the geometric boundaries lose their predictive value, generating frequent false signals.
- Vulnerability to False Breakouts (Stop-Hunts): Price will frequently pierce the outer parallel lines to trigger stop-losses before abruptly reversing back into the channel. Relying solely on a line touch without candlestick confirmation or volatility filters (like the ATR) will expose traders to trap setups.
- Structural Obsolescence (The Curve-Fitting Trap): A Pitchfork is only valid as long as the market respects its initial geometry. When a macro trend breaks, the tool becomes obsolete. A common trap is constantly tweaking the anchor points to force the channel to fit the new price action. When the structure definitively fails, the tool must be discarded, not repeatedly adjusted.
9. Frequently Asked Questions
10. Conclusion
The Andrews Pitchfork is more than a drawing on a chart; it is a rigorous framework for interpreting market rhythm and geometric symmetry. By moving beyond static support levels and adopting dynamic median line studies, traders can stay aligned with the market’s fair value while avoiding the noise of lower timeframes.
Success with this tool requires discipline: respect the pivots, avoid curve-fitting, and always seek confluence with price action. Use this guide as your structural roadmap, and explore further advanced strategies in our Technical Indicators List and For Beginner categories on PipRider. Ready to master the geometry of the markets?
Infographic Section
-
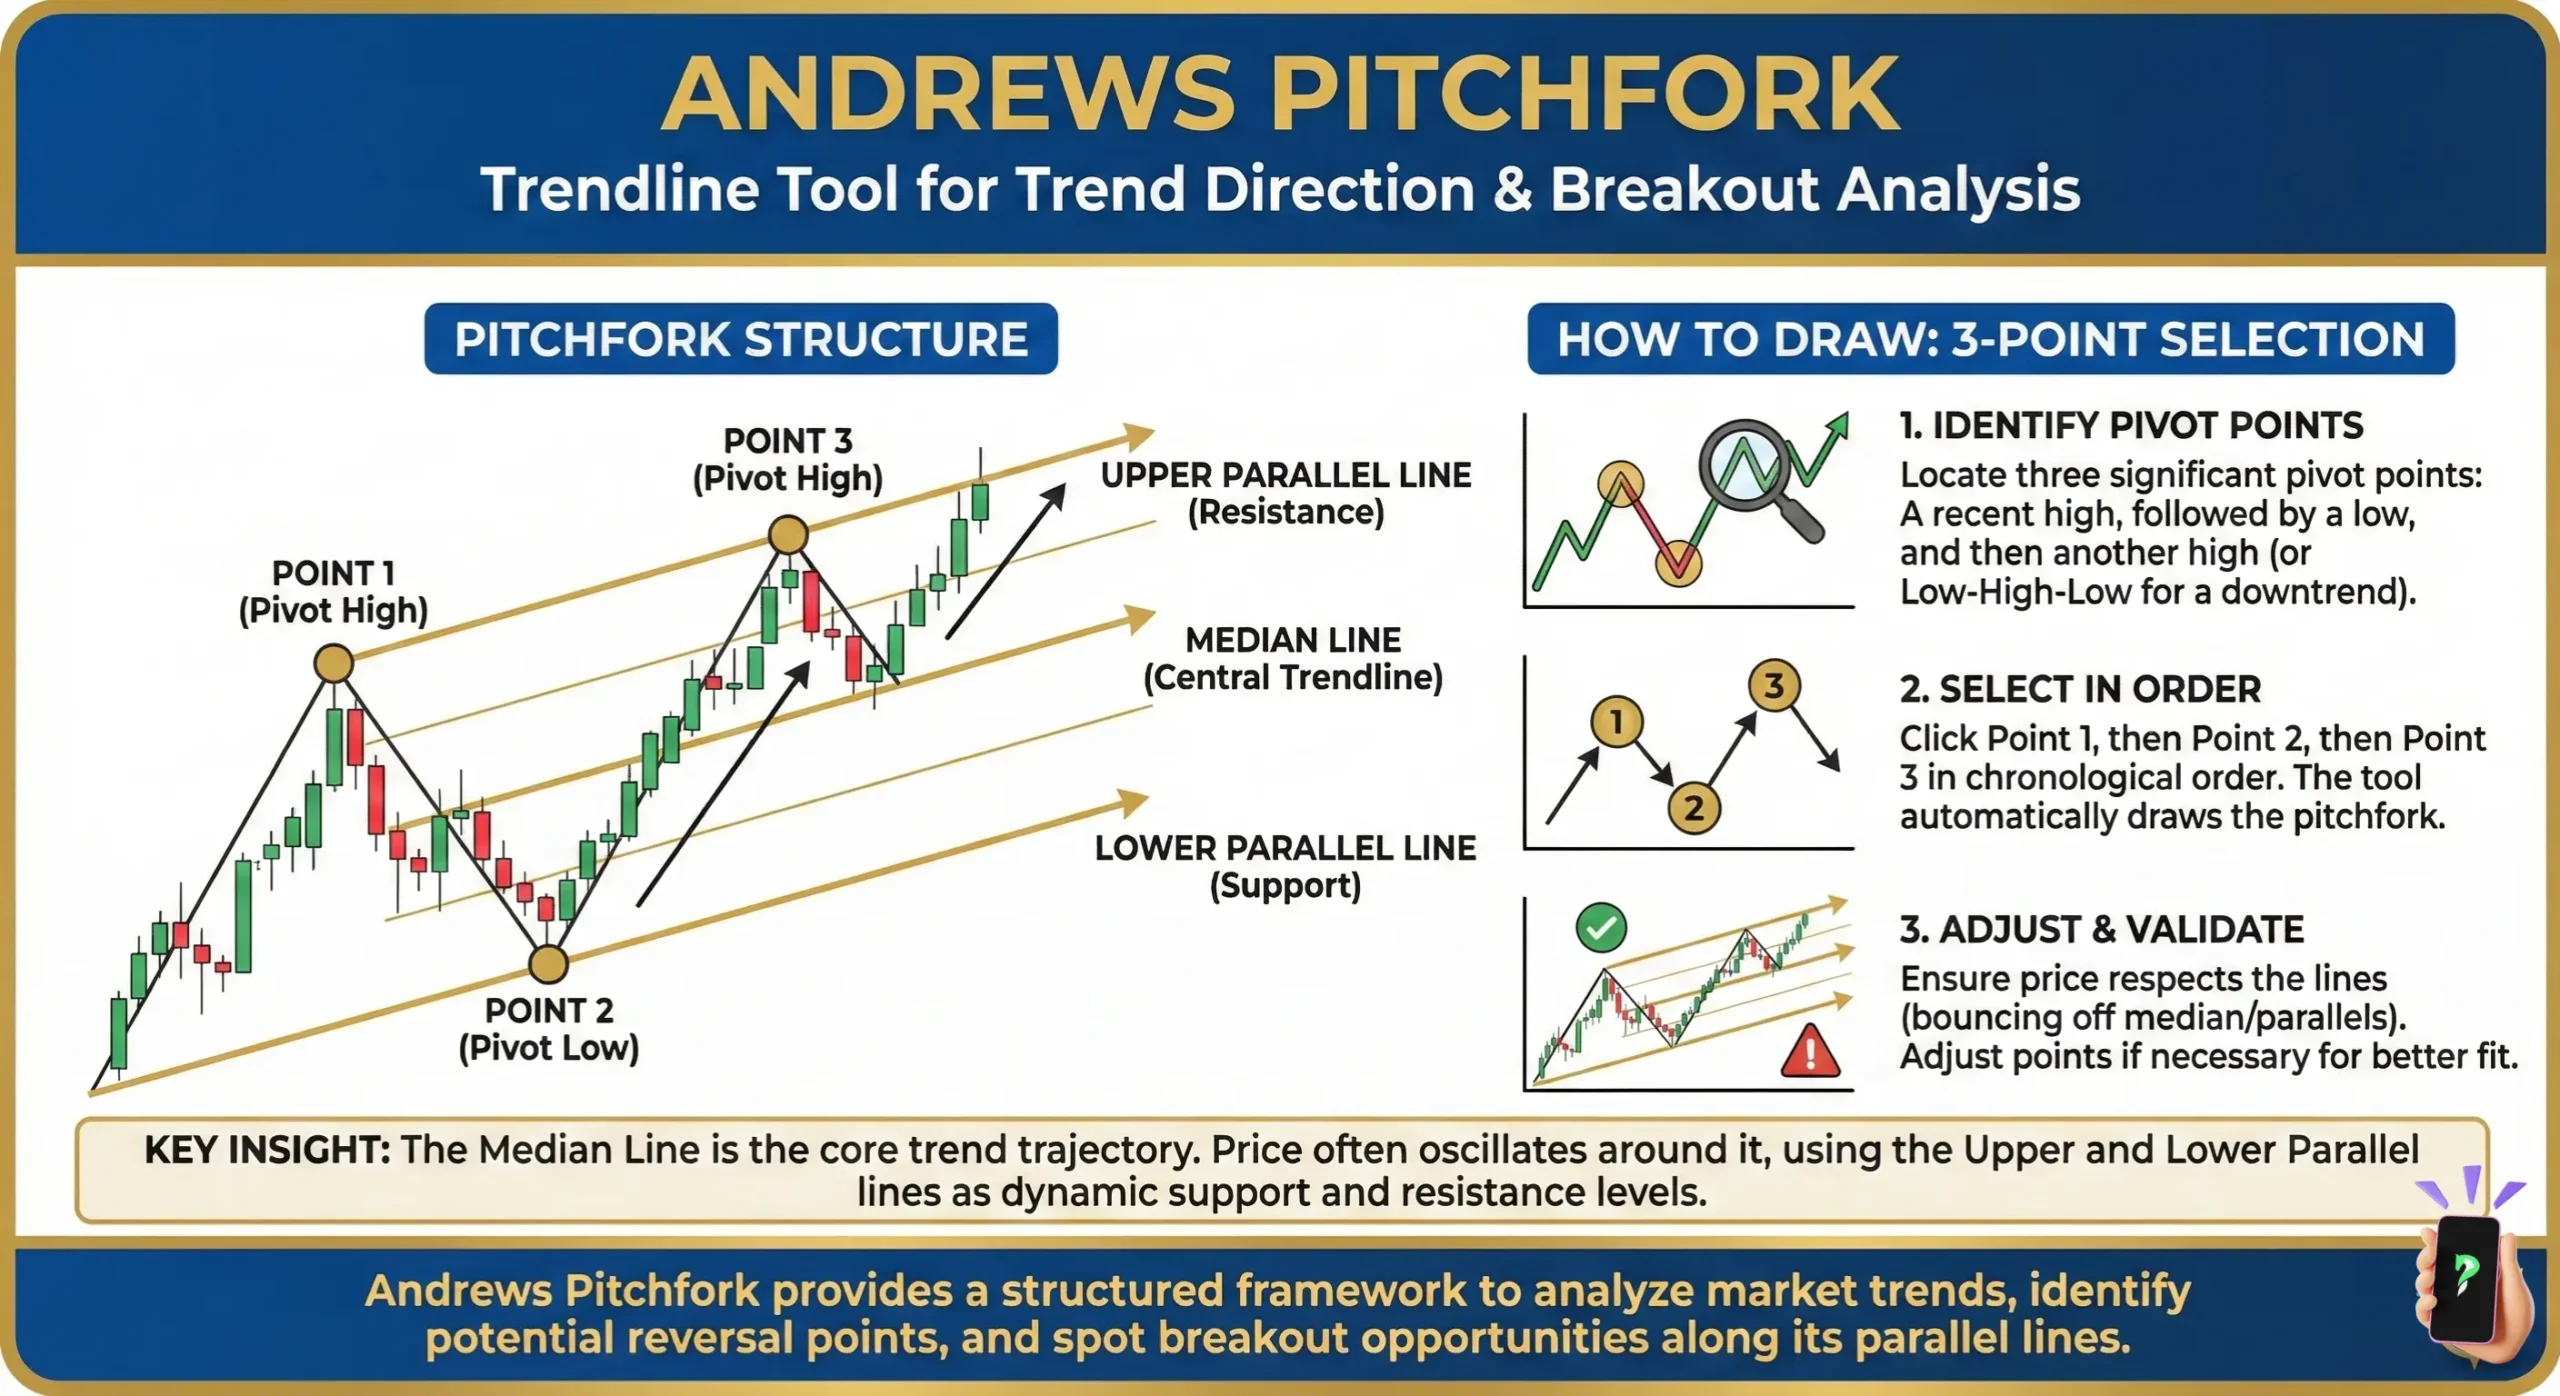
Andrews Pitchfork: Trendline Tool for Trend Direction & Breakout Analysis -
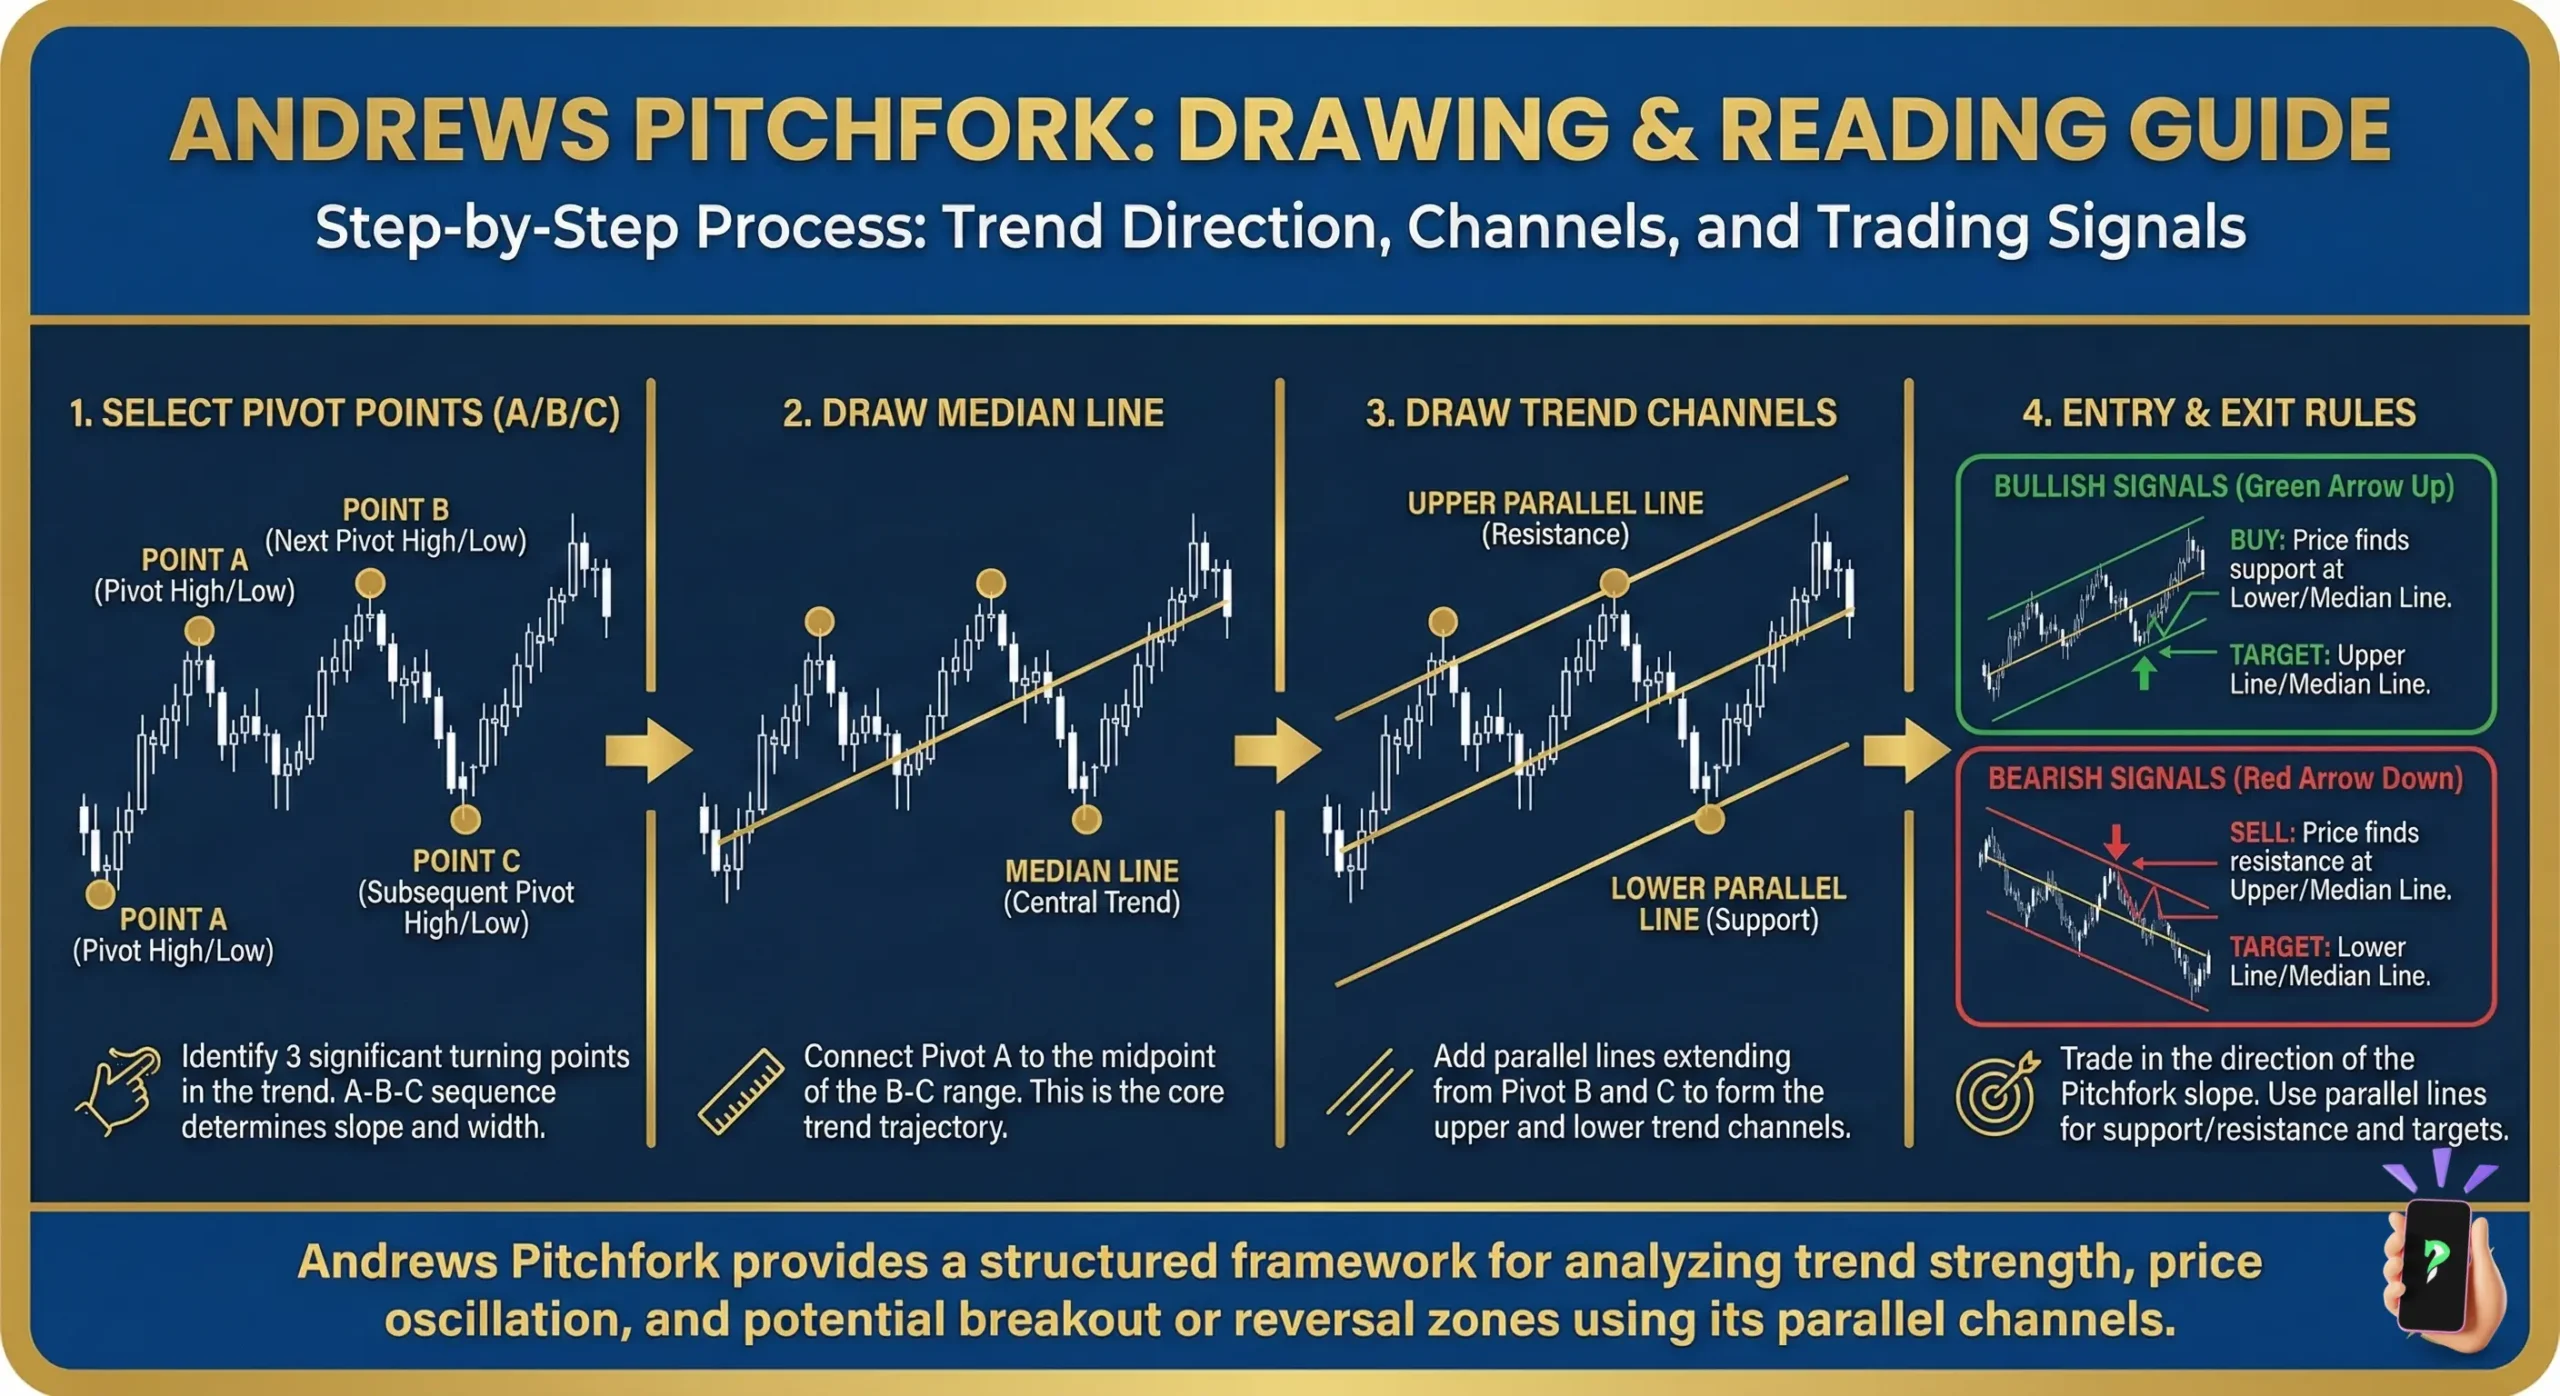
Andrews Pitchfork: Drawing & Reading Guide -
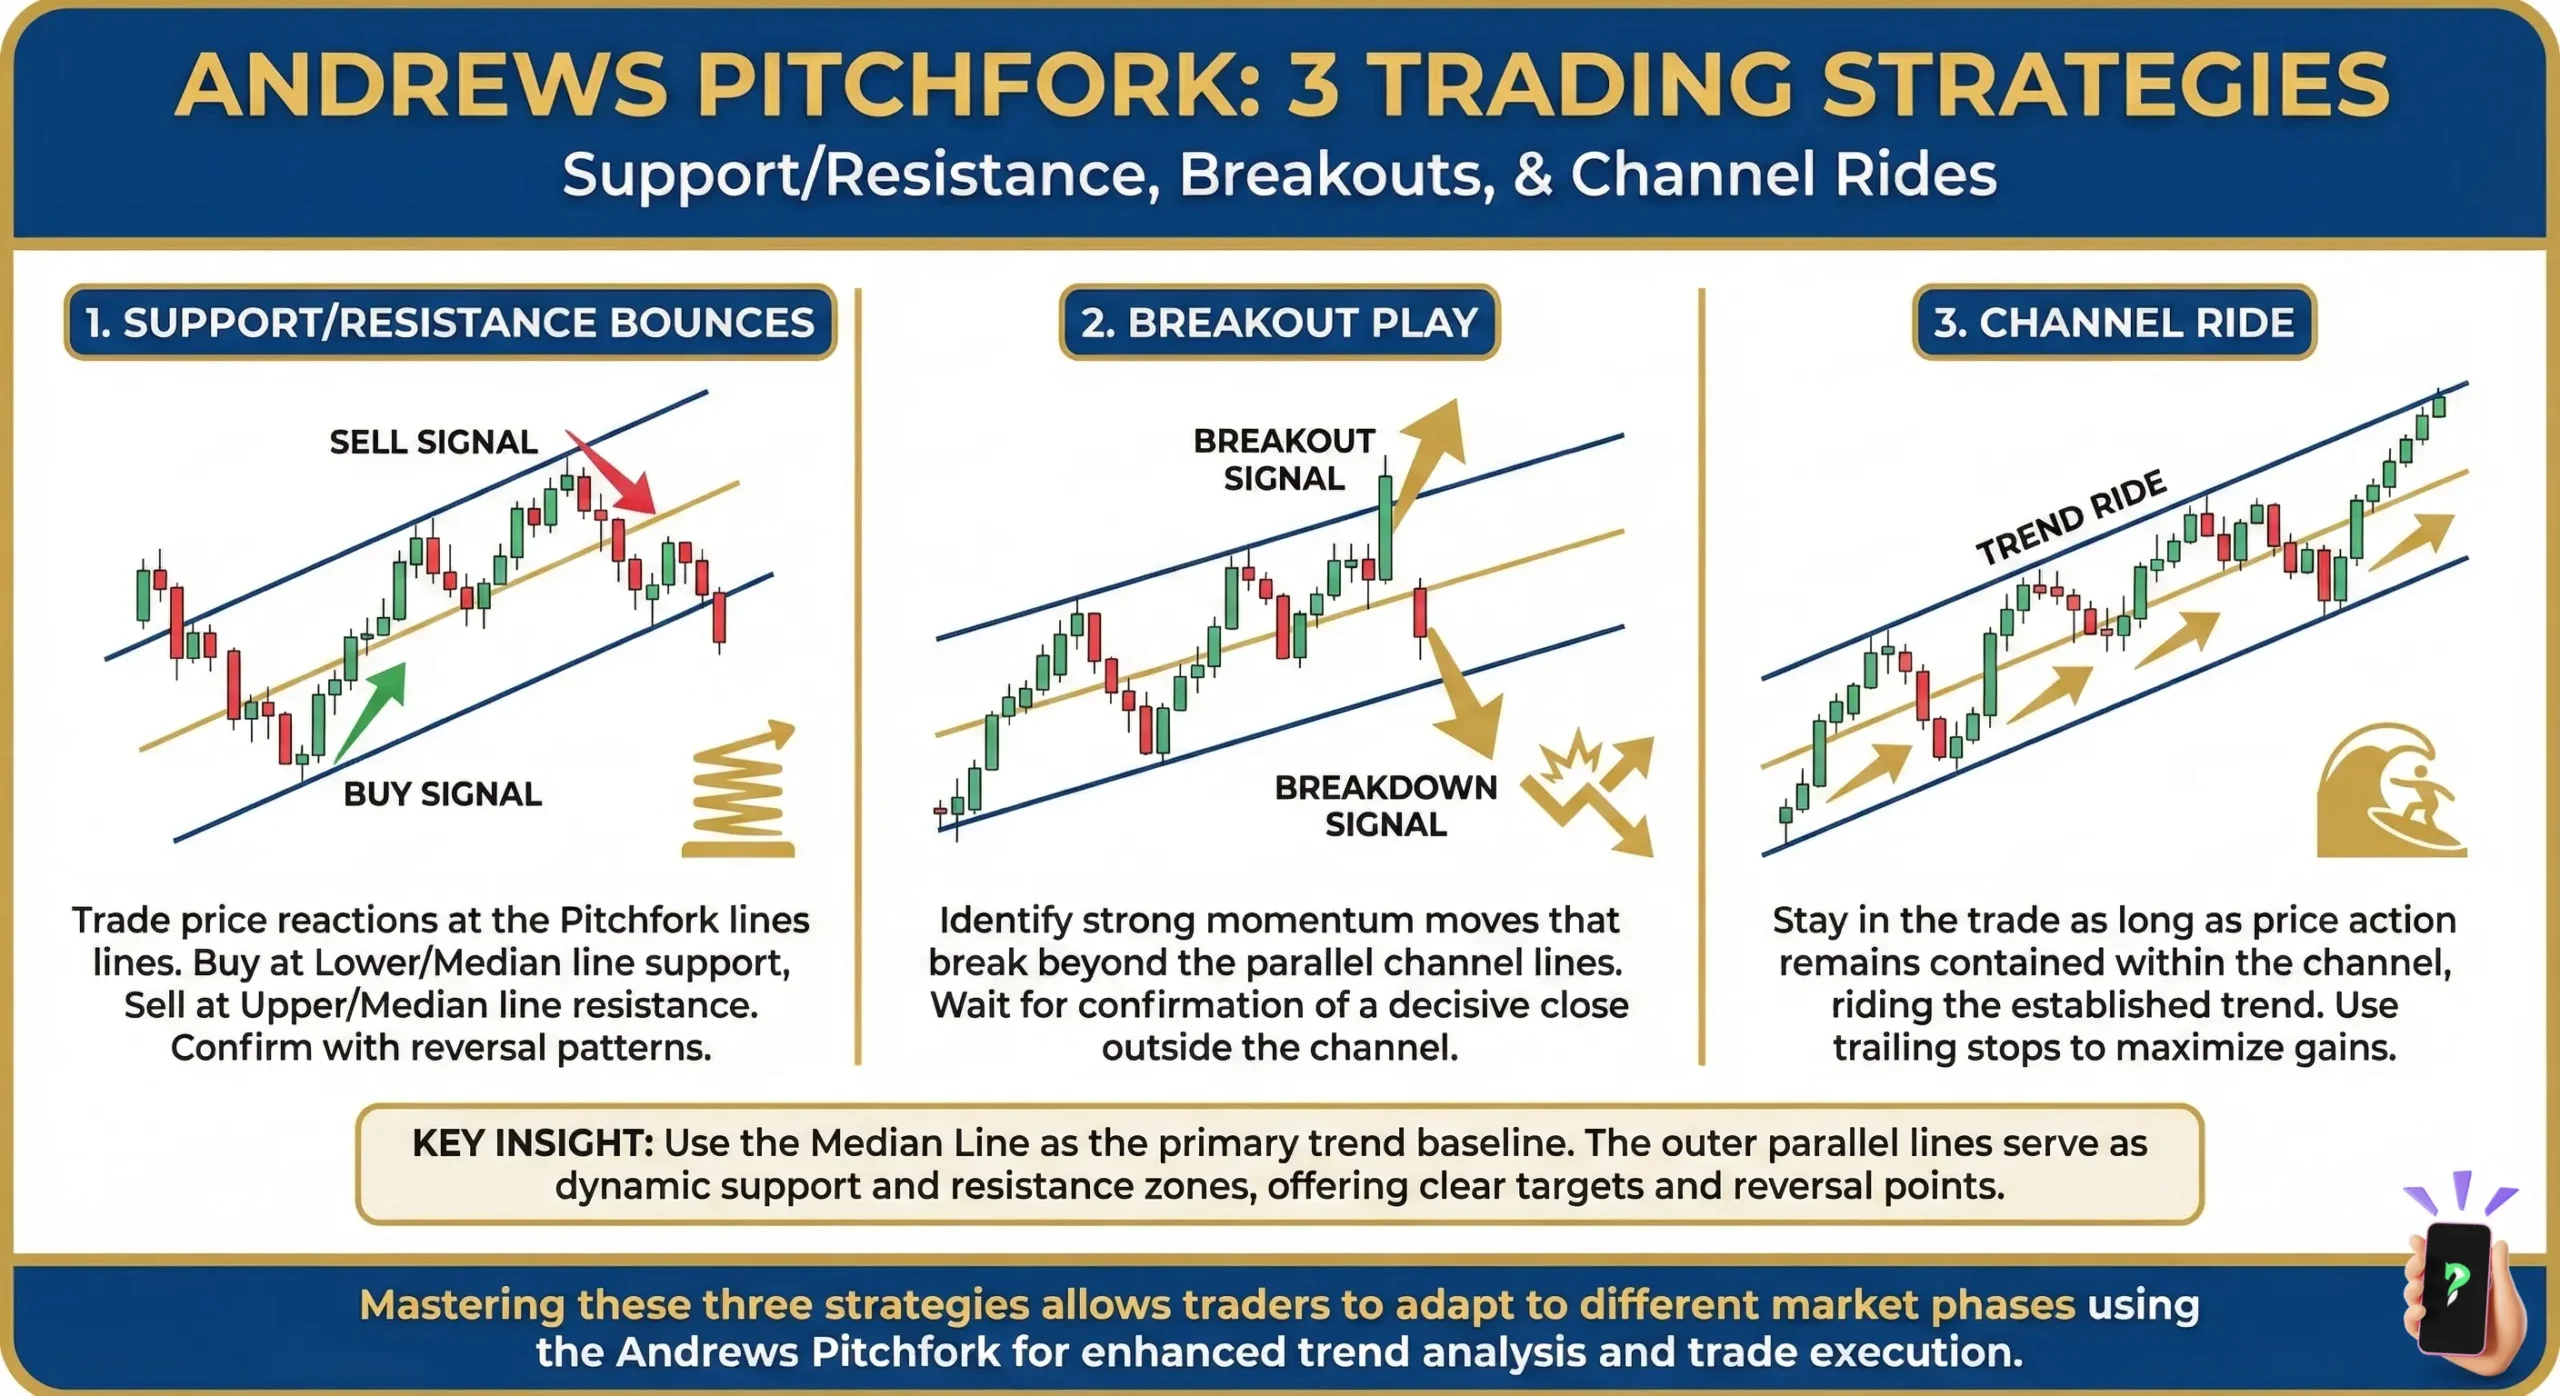
Andrews Pitchfork: 3 Trading Strategies


